The Jurassic shales of the Wessex area: geology and shale oil and shale gas resource estimation
←
→
Page content transcription
If your browser does not render page correctly, please read the page content below

THE JURASSIC SHALES OF THE WESSEX AREA: GEOLOGY AND SHALE OIL AND SHALE GAS RESOURCE ESTIMATION

 The Jurassic shales of the Wessex area:
 geology and shale oil and shale gas
 resource estimation

 Lias, Black Ven, Dorset. Photograph from the Geologists’ Association Carrack Archive. © NERC

 i
 © OGA 2016

THE JURASSIC SHALES OF THE WESSEX AREA: GEOLOGY AND SHALE OIL AND SHALE GAS RESOURCE ESTIMATION

 Disclaimer
 This report is for information only. It does not constitute legal, technical or professional
 advice. The Oil and Gas Authority does not accept any liability for any direct, indirect or
 consequential loss or damage of any nature, however caused, which may be sustained as a
 result of reliance upon the information contained in this report.

 All material is copyright and is licensed under the Open Government Licence v3.0. To view
 this licence, visit http://www.nationalarchives.gov.uk/doc/open-government-licence/ or
 write to the Information Policy Team, The National Archives, Kew, Richmond, Surrey, TW9
 4DU. It may be produced in whole or in part subject to the inclusion of an
 acknowledgement of the source, but should not be included in any commercial usage or
 sale. Reproduction for purposes other than those indicated above requires the written
 permission of the Oil and Gas Authority.

Suggested citation:

Greenhalgh, E. 2016. The Jurassic shales of the Wessex Area: geology and shale oil and shale gas
resource estimation. British Geological Survey for the Oil and Gas Authority, London, UK.

 Requests and enquiries should be addressed to:

 Toni Harvey
 Senior Geoscientist - UK Onshore
 Email: Toni.Harvey@ogauthority.co.uk

 ii
 © OGA 2016

THE JURASSIC SHALES OF THE WESSEX AREA: GEOLOGY AND SHALE OIL AND SHALE GAS RESOURCE ESTIMATION

Foreword

This report has been produced under contract by the British Geological Survey (BGS), as an
addendum to the Weald Basin study (Andrews, 2014). It is based on a recent analysis of all available
information, together with published data and interpretations.

Additional information is available at the Oil and Gas Authority (OGA) website.
https://www.ogauthority.co.uk/exploration-production/onshore/. This includes licensing
regulations, maps, monthly production figures, basic well data and where to view and purchase
data. Shale oil/gas related issues including hydraulic fracturing, induced-seismicity risk mitigation
and the information regarding the onshore regulatory framework can also be found on this
webpage.

Interactive maps, with licence data, seismic, relinquishment reports and stratigraphic tops for many
wells are available at www.ukogl.org.uk.

A glossary of terms used and equivalences is tabled at the end of the report (see page 62).

All of the detailed figures in this report are attached in A4 or larger format (Appendix C);
thumbnails are also included in the text for reference.

Acknowledgements

The author would like to thank the other contributors to this report, most notably Ian Andrews1,
Mike Sankey1, Mark Kassyk1, Toni Harvey2 and Mark Quint2.
1
 British Geological Survey, Edinburgh, UK
2
 Oil and Gas Authority, London, UK

Dick Selley and Al Fraser are thanked for reviewing this report and providing helpful feedback.
Thanks also go to Matthew England (Azinor) for providing geochemical data and analyses from his
PhD work, Infrastrata for the release of the APT UK (2013) report and UKOGL for providing the
seismic data.

 iii
 © OGA 2016
THE JURASSIC SHALES OF THE WESSEX AREA: GEOLOGY AND SHALE OIL AND SHALE GAS RESOURCE ESTIMATION

Contents
 Disclaimer............................................................................................................................................ ii
 Foreword............................................................................................................................................ iii
 Acknowledgements............................................................................................................................ iii
 Contents ............................................................................................................................................. iv
 List of figures ....................................................................................................................................... v
 List of tables ........................................................................................................................................ x
1 Summary ......................................................................................................................................... 1
2 Introduction to the Wessex Study Area .......................................................................................... 5
 2.1 Area of Interest ....................................................................................................................... 5
 2.2 Interval of Interest .................................................................................................................. 5
 2.3 Exploration History ................................................................................................................. 5
 2.3.1 Oil Fields .......................................................................................................................... 6
 2.3.2 Other Hydrocarbon Indications .................................................................................... 10
 2.4 Seeps ..................................................................................................................................... 11
3 Database ....................................................................................................................................... 13
4 Structure and Tectonic History ..................................................................................................... 17
 4.1 Structural Elements............................................................................................................... 17
 4.2 Tectonic History .................................................................................................................... 18
 4.3 Background Seismicity of the Wessex Area .......................................................................... 22
 4.4 Depth Grids ........................................................................................................................... 22
5 Stratigraphy of the Jurassic in the Wessex Area ........................................................................... 26
 5.1 Lower Lias.............................................................................................................................. 27
 5.2 Middle Lias ............................................................................................................................ 27
 5.3 Upper Lias ............................................................................................................................. 27
 5.4 Inferior Oolite........................................................................................................................ 28
 5.5 Great Oolite Group ............................................................................................................... 28
 5.6 Oxford Clay and Kellaways .................................................................................................... 29
 5.7 Corallian ................................................................................................................................ 29
 5.8 Kimmeridge Clay ................................................................................................................... 29
 5.9 Portland and Purbeck Beds ................................................................................................... 30
6 Estimate of the Magnitude of Missing Section ............................................................................. 31
 6.1 This Study .............................................................................................................................. 31

 iv
 © OGA 2016

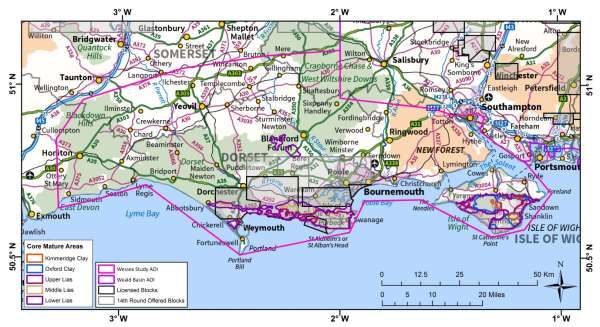
THE JURASSIC SHALES OF THE WESSEX AREA: GEOLOGY AND SHALE OIL AND SHALE GAS RESOURCE ESTIMATION

 6.2 Published Studies .................................................................................................................. 33
7 Geochemistry ................................................................................................................................ 35
 7.1 Source Rock Potential ........................................................................................................... 35
 7.1.1 Kimmeridge Clay Formation ......................................................................................... 35
 7.1.2 Oxford Clay Formation .................................................................................................. 38
 7.1.3 Upper Lias ..................................................................................................................... 40
 7.1.4 Middle Lias .................................................................................................................... 42
 7.1.5 Lower Lias ..................................................................................................................... 42
 7.2 Data Quality .......................................................................................................................... 47
 7.3 Source of Conventional Discoveries...................................................................................... 49
8 Estimation of Oil-in-Place.............................................................................................................. 50
9 Synthesis and Conclusions ............................................................................................................ 56
10 Glossary ..................................................................................................................................... 62
11 References ................................................................................................................................ 63

Appendix A. Monte Carlo input parameters for the volumetric calculation.
Appendix B. Detailed correlation of strata between selected key wells in the Wessex area.
Appendix C. Large-scale copies of figures.

List of figures
Figure 1. Figure 1. Location of the BGS/OGA Wessex study area in southern Britain, with previous
BGS/DECC shale study areas, currently licensed blocks and hydrocarbon fields. Other shale oil and
shale gas plays may exist.

Figure 2. (Top) Location of the BGS/DECC shale oil Weald Basin study and the BGS/OGA Wessex
study area, southern Britain. (Bottom) Zoom-in of location of the Wessex study area. Contains
Ordnance Survey data © Crown copyright and database right 2016.

Figure 3. Areas considered to be protected under the 2015 Infrastructure Act, where hydraulic
fracturing (fracking) may only be permitted at burial depths of 1200 m (c. 3950 ft) or greater.
Background is shaded-relief topography. Contains Ordnance Survey data © Crown copyright and
database right (2016). Data sources: Areas of Outstanding Natural Beauty & National Parks ©
Natural England copyright, 2016. Contains Ordnance Survey data © Crown copyright and database
right (2016); World Heritage Sites © Historic England (2016). Contains Ordnance Survey data ©
Crown copyright and database right (2016). The Historic England GIS Data contained in this material
were obtained on 21/04/2016. The most publicly available up to date Historic England GIS Data can
be obtained from http://www.HistoricEngland.org.uk; Groundwater Source Protection Zones (SPZ)
© Environment Agency copyright and/or database right 2016.

 v
 © OGA 2016

THE JURASSIC SHALES OF THE WESSEX AREA: GEOLOGY AND SHALE OIL AND SHALE GAS RESOURCE ESTIMATION

Figure 4. Surface geology of the study area with hill-shaded relief, with the Wessex study area
(shown in pink). Surface geology from BGS 1:50,000 scale DiGMapGB © NERC.

Figure 5. Generalised stratigraphic column for the Jurassic of the Wessex area showing the main
source rock intervals (in red) and other potential source rock intervals (in pink). Adapted from
Andrews (2014).

Figure 6. Distribution of producing oil fields, discovery wells and well with hydrocarbon shows within
the study area, based on well reports and published literature. Also shown are areas currently
licensed or offered for award for exploration, and main BGS structural elements (British Geological
Survey, 1996). Contains British Geological Survey materials © NERC (2016).

Figure 7. Exploration, appraisal and development wells, and deep boreholes (> 100 m total depth) of
the Wessex area. Background is hill-shaded topography. Contains Ordnance Survey data © Crown
copyright and database right (2016). Contains British Geological Survey materials © NERC (2016).

Figure 8. Distribution of wells with time-depth data available for this study (blue). Also shown are
the boreholes for which stratigraphical and geochemical data were available (pink). Background is
hill-shaded topography. Contains Ordnance Survey data © Crown copyright and database right
(2016). Contains British Geological Survey materials © NERC (2016).

Figure 9. Location of the six well correlation panels shown in Appendix B, with the main BGS
structural elements (British Geological Survey, 1996). Contains British Geological Survey materials
© NERC (2016).

Figure 10. Location of wells, boreholes and outcrops for which geochemical data were available for
this study. Also shown is the area within which the Lower Lias is believed to have reached sufficient
maturity for oil generation (black polygon). Background is the outcrop geology from BGS 1:50,000
scale DiGMapGB © NERC. Contains British Geological Survey materials © NERC (2016).

Figure 11. Location of 2D and Wytch Farm 3D seismic data used to map the subsurface in the study
area. Lines A & B show the location of the data shown in Figure 12. All seismic data were obtained
from the UK Onshore Geophysical Library (UKOGL http://ukogl.org.uk/).

Figure 12. Comparison of seismic data quality from a tectonically quiet area (A – Line HB-84-014)
with a structurally complex area (B – Line BP78-02-233), demonstrating the reduction in data quality
in highly faulted areas. Seismic lines provided by UKOGL.

Figure 13. The major Mesozoic structural features of southern England. Adapted from Andrews
(2014), and based on Stoneley (1982); Chadwick (1983); Lake (1985); Sellwood et al. (1985); Hancock
& Mithen (1987); Butler & Pullan (1990); Butler (1998); Hawkes et al. (1998); Underhill & Stoneley
(1998); Chadwick & Evans (2005). The Wessex Basin sensu Underhill & Stoneley (1998) lies
southwest of the orange dashed line. Study area outlines in pink (Wessex) and purple (Weald).
Abbreviations: ARF = Abbotsbury-Ridgeway Fault; LCF = Litton-Cheney Fault; PF = Purbeck Fault; NF =
Needles Faults; SF = Sandhills Fault; PdBF = Pays de Bray Fault; BRF = Bere Regis Fault; W-CF =
Watchet-Cothelstone Fault; CF = Cranborne Fault; LSF = Lymington-Sandhills Fault; MF = Mere Fault;
DHF = Dean Hill Fault; PMF = Portsdown-Middleton Fault; VoPF = Vale of Pewsey Faults; HBF = Hog’s

 vi
 © OGA 2016

THE JURASSIC SHALES OF THE WESSEX AREA: GEOLOGY AND SHALE OIL AND SHALE GAS RESOURCE ESTIMATION

Back Fault; GBF = Godley Bridge Fault; BBF = Brightling-Bolney Fault; DABF = Detention-Ashour-
Bletchingley Fault; FZ = Fault Zone.

Figure 14: Bouguer gravity (mGal) (top), 50 km high-pass filtered Bouguer gravity (bottom),
horizontal gradient of Bouguer gravity (next page, top) and tilt derivative (next page, bottom) of
southern England. All images show the main BGS structural elements (British Geological Survey,
1996) and Wessex (pink polygon) and Weald (purple polygon) study areas. Regional east-west and
northwest-southeast trends are clearly visible. Gravity data from the BGS UKCS compilation, which is
based on a compilation of BGS and open-file data. Contains British Geological Survey materials ©
NERC (2016).

Figure 15. Crustal section across the Wessex and Weald areas, illustrating the influence of
extensional reactivation of Variscan thrusts, after Chadwick (1986). See Figure 13 for location.

Figure 16. Generalised subcrop map beneath the Base Greensand Unconformity, determined from
seismic and well data, and Whittaker (1985). Pink polygon outlines the Wessex study area.

Figure 17. Schematic cross-section showing the progressively westward truncation of Jurassic (and
older) strata beneath the Base Greensand Unconformity in the Wessex area, after Underhill &
Stoneley (1998).

Figure 18. Earthquakes recorded by BGS from 1970 to 2016 for the Wessex area, coloured by
magnitude. Also shown are the BGS structural elements (British Geological Survey, 1996) and the
area in which the Lower Lias is predicted to be mature with a 1200 m below ground-level cut-off.
Background is hill-shaded topography. Contains Ordnance Survey data © Crown copyright and
database right (2016). Contains British Geological Survey materials © NERC (2016). Earthquake
database available from BGS at http://earthquakes.bgs.ac.uk/earthquakes/dataSearch.html

Figure 19. Depth to Top Kimmeridge Clay Fm, as mapped by this study for the Wessex area and by
Andrews (2014) for the Weald Basin. Contour interval = 500 ft.

Figure 20. Depth to Top Oxford Clay Fm, as mapped by this study for the Wessex area and by
Andrews (2014) for the Weald Basin. Contour interval = 500 ft.

Figure 21. Depth to Top Upper Lias, as mapped by this study for the Wessex area and by Andrews
(2014) for the Weald Basin. Contour interval = 500 ft.

Figure 22. Depth to Top Middle Lias, as mapped by this study for the Wessex area and by Andrews
(2014) for the Weald Basin. Contour interval = 500 ft.

Figure 23. Depth to Top Lower Lias, as mapped by this study for the Wessex area and by Andrews
(2014) for the Weald Basin. Contour interval = 500 ft.

Figure 24. Generalised stratigraphic column for the Jurassic of the Wessex area. J1-J6 are the Jurassic
megasequences as defined by Hawkes et al. (1998).

Figure 25. Comparison of gamma ray and sonic logs for the Lias of the Wessex (Arreton 2) and Weald
(Godley Bridge 1) study areas.

 vii
 © OGA 2016

THE JURASSIC SHALES OF THE WESSEX AREA: GEOLOGY AND SHALE OIL AND SHALE GAS RESOURCE ESTIMATION

Figure 26. Comparison of gamma ray and sonic logs for the Kimmeridge Clay of the Wessex
(Southard Quarry 1) and Weald (Balcombe 1) study areas.

Figure 27. Interval velocities vs TVD for determination of the normal compaction trend (NCT) for the
Oxford Clay of the Wessex and Weald areas, used to estimate the amount of erosion.

Figure 28. Total erosion for the Wessex area estimated in this study from interval velocity analysis
and stratigraphic restoration. Plotted values are those estimated using the NCT (determined in figure
27) for individual wells.

Figure 29. TOC and S1 vs frequency plots for the Kimmeridge Clay in the Wessex area. Out of a total
of 2813 data points, 150 have TOC values > 10%. The high S1 (>= 5 mgHC/gRock) are from samples
taken from oil shales at outcrop. Data from Farrimond et al. (1984); Ebukanson & Kinghorn (1985);
Morgans-Bell et al. (2001); and well reports.

Figure 30. Gross thickness of the Kimmeridge Clay Formation within the area it has been predicted to
have reached oil maturity, and below a present-day burial depth of c. 3950 ft (1200 m). No part of
the predicted mature section is presently at depths of c. 5000 ft (1500 m) or greater below the
surface. The P50 estimate for the proportion of organic-rich shale is 0.35. Shaded region is the area
of mature Kimmeridge Clay, with no top-down truncation applied.

Figure 31. TOC and S1 vs frequency plots for the Oxford Clay Formation in the Wessex area. Data are
from Ebukanson & Kinghorn (1985); England (2010); and well reports.

Figure 32. Gross thickness of the Oxford Clay Formation within the area it has been predicted to
have reached oil maturity, and below a present-day burial depth of c. 3950 ft (1200 m). Only a very
minor volume of the predicted mature section is below a present-day burial depth of c. 5000 ft
(1500 m) (contour not shown). The P50 estimate for the proportion of organic-rich shale is 0.28.
Shaded region is the area of mature Oxford Clay, with no top-down truncation applied.

Figure 33. 1D basin model for Kimmeridge 5 indicating that the Oxford Clay has reached early
maturity for oil generation at this location (from Fraser & Aryanto, in prep).

Figure 34. TOC and S1 vs frequency plots for the Upper Lias in the Wessex area. Data are from
Ferguson (2002); England (2010); and well reports.

Figure 35. Gross thickness of the Upper Lias within the area it has been predicted to have reached oil
maturity, and below a present-day burial depth of c. 3950 ft (1200 m). Dashed line is the extent of
the predicted mature area below a present-day burial depth of c. 5000 ft (1500 m).

Figure 36. TOC and S1 vs frequency plots for the Middle Lias (including the Eype Clay) in the Wessex
area. Data are from Ferguson (2002); El-Mahdi (2004); England (2010); and well reports.

Figure 37. Gross thickness of the Middle Lias within the area it has been predicted to have reached
oil maturity, and below a present-day burial depth of c. 3950 ft (1200 m). Dashed line is the extent of
the predicted mature area below a present-day burial depth of c. 5000 ft (1500 m). Removing the
top-down truncation does not alter the predicted mature area or gross rock volume significantly.

 viii
 © OGA 2016

THE JURASSIC SHALES OF THE WESSEX AREA: GEOLOGY AND SHALE OIL AND SHALE GAS RESOURCE ESTIMATION

Figure 38. (Top) TOC vs frequency from the Lower Lias in the Weald Basin (from Andrews, 2014). Red
= legacy data; blue = BGS data (see Appendix B of the Weald report); green = pyrolysis-derived TOCs,
courtesy of Celtique Energie. TOC (middle) and S1 (bottom) vs frequency plots for the Lower Lias in
the Wessex area. Data are from Ebukanson & Kinghorn (1990); Kiriakoulakis et al. (2000); Scotchman
(2001); Ferguson (2002); Najm (2003) – data courtesy of P. Farrimond; El-Mahdi (2004); Eltera
(2004); England (2010); Farrimond (unpublished); and well reports.

Figure 39. Gross thickness of the Lower Lias within the area it has been predicted to have reached oil
maturity, and below a present-day burial depth of c. 3950 ft (1200 m). Dashed line is the extent of
the predicted mature area below a present-day burial depth of c. 5000 ft (1500 m). Removing the
top-down truncation does not alter the predicted mature area or gross rock volume significantly.

Figure 40. (Left) All vitrinite reflectance data points in the Wessex area available to this study,
plotted against burial depth. (Right) Measured vitrinite reflectance (averaged where multiple values
exist for a single depth within a well) in blue and vitrinite reflectance calculated from Tmax in orange,
plotted against burial depth.

Figure 41. Vitrinite reflectance derived from Tmax versus measured vitrinite reflectance data for the
Wessex area.

Figure 42. a) S1 vs TOC for the Wessex area. Blue = Lower Lias, grey = all other data. b) S1 corrected
for evaporative loss vs TOC for the Lower Lias in the Wessex area (not including data from West
Compton 1 – see text for discussion). c) Corrected S1 vs TOC for all Jurassic shales in the Weald
Basin, from Andrews (2014).

Figure 43. Measured vitrinite reflectance (blue crosses) and vitrinite reflectance derived from Tmax
(orange crosses) for the Wessex area, plotted against maximum burial depth. The two trend lines
were derived from maturity data in the Weald Basin (Andrews, 2014), but show a good fit to the
maturity data from the Wessex area. Trend A (red line) has Ro = 0.6% at 7000 ft (2130 m) and trend B
(green line) has Ro = 0.6% at 8000 ft (2440 m).

Figure 44. Probabilistic distribution and cumulative probability curve representing the result of a
Monte Carlo analysis for the in-place resource estimation of shale oil for all Jurassic shale intervals,
with a maturity cut-off of 2130 m.

Figure 45. (Top) Core mature areas for the Jurassic shale intervals of the Weald and Wessex areas.
(Bottom) Zoom-in of Wessex area. Location of the seismic sections in Figure 46 (red lines) and the
well correlation panel in Figure 47 (black line) also shown.

Figure 46. Interpretation of three north-south seismic lines with horizons mapped in this study. (A)
Line AUK-94-AJ053 & B92-54, (B) UKOGL-RG-004, (C) BP-353 1 & BP-353 2. Dashed black line is
approximately 1200 m (c. 3950 ft) below surface. Seismic data provided by UKOGL. Location of lines
shown in Figure 45.

Figure 47. Correlation of the Lower Lias section demonstrating the significant increase in thickness of
this interval south of the Purbeck-Isle of Wight Disturbance. Location of wells shown in Figure 45.

 ix
 © OGA 2016

THE JURASSIC SHALES OF THE WESSEX AREA: GEOLOGY AND SHALE OIL AND SHALE GAS RESOURCE ESTIMATION

Figure 48. Generalised cross-sections through the Wessex and Weald study areas showing the
relationship between the present-day depth of the shale intervals with the oil window and top-down
truncation.

Figure 49. Core mature areas with a 1200 m (c. 3950 ft) below ground level cut-off applied for each
shale interval evaluated in this study. Contains Ordnance Survey data © Crown copyright and
database right (2016).

Figure 50. Core mature areas with a 1200 m (c. 3950 ft) below ground level cut-off applied for each
shale interval evaluated in this study with protected areas as defined in the Infrastructure Act 2015.
Background is hill-shaded topography.

List of tables
Table 1. Estimates of the total potential in-place shale oil resource for the Jurassic in the Wessex
study area (top) and in the Weald Basin (bottom, from Andrews (2014)), onshore southern England.
P90, P50 and P10 values are given for each unit, where P10 is the most optimistic scenario. This
estimate only covers unconventional oil, and excludes volumes in potential tight conventional or
hybrid plays.

Table 2. Comparison of geochemical data (S2, TOC and HI) for the Lower Lias of the Wessex area and
Weald Basin (updated from Andrews, 2014).

Table 3. S1 values used for the Monte Carlo simulation (top = this study, bottom = Weald study
(Andrews, 2014)). *denotes average values taken from all data, due to limited data for samples with
TOC > 2%.

Table 4. Estimates of the total potential in-place shale oil resource for the Jurassic in the Wessex
study area. P90, P50 and P10 values are given for each unit, where P10 is the most optimistic
scenario. This estimate only covers unconventional oil, and excludes volumes in potential tight
conventional or hybrid plays.

 x
 © OGA 2016
THE JURASSIC SHALES OF THE WESSEX AREA: GEOLOGY AND SHALE OIL AND SHALE GAS RESOURCE ESTIMATION

1 Summary
This report on the Jurassic shale oil and gas potential of the Wessex area follows previous
assessments of the potential distribution and in-place resource for shale oil and gas onshore UK
(Figure 1), including the Carboniferous shales of the Midland Valley of Scotland (Monaghan, 2014),
the Carboniferous shales of the Bowland-Hodder (Andrews, 2013), and the Jurassic shales of the
Weald (Andrews, 2014); it is intended as an addendum to the Weald Basin report. Following the
methodology used in the assessment of the Weald Basin (Andrews, 2014), a preliminary in-place oil
resource calculation has been performed for the main Jurassic shale intervals in the Wessex area. As
in the Weald Basin, no significant shale gas resource is recognised in the Jurassic of the Wessex area.
The resource assessment is of the hydrocarbons present in shale strata and does not include
volumes which have migrated into potential tight conventional or hybrid plays.

The study area has a long history of conventional hydrocarbon exploration and production, with
exploration activity since the 1930s (Lees & Cox, 1937), and first production in 1961 from the
Kimmeridge Oilfield. The Wytch Farm Oilfield in Dorset lies within the Wessex area and is the largest
onshore oil accumulation in North-West Europe. Two other oil fields – Waddock Cross and Wareham
– are also situated within the study area.

The Wessex study area lies immediately to the west of the Weald Basin, and is composed of several
fault-controlled sub-basins and highs (Chadwick, 1986). The Jurassic sedimentary section is
composed of six shallowing-upward sequences of marine shales and siltstones capped by sandstones
or limestones (Hawkes et al., 1998). The area has a complex tectonic history and has experienced
two significant phases of uplift and erosion – one in the Aptian-Albian, and a Tertiary phase
associated with Alpine compression (Lake & Karner, 1987; Butler, 1998; Underhill & Stoneley, 1998).
These events have led to a considerable amount of missing Late Jurassic – Early Cretaceous and
Tertiary section across much of the area.

Five marine shale units within the Jurassic of the Wessex area are the focus of this study: the Lower,
Middle and Upper Lias (Lower Jurassic), the Oxford Clay (Middle-Upper Jurassic) and the Kimmeridge
Clay (Upper Jurassic). The amount of organic matter in these units varies across the area, both
laterally and temporally. Organic-rich shales (with total organic carbon (TOC) > 2%) occur regionally
in the Kimmeridge Clay, in the lower section of the Oxford Clay and in the Lower Lias. The most
significant shales in terms of TOC and S2 are the Kimmeridge Clay and all five shale intervals that
comprise the Lower Lias. A distinct difference to the Weald Basin is the organic richness of the Lower
Lias; the previous study identified only limited potential in this interval, yet in the Wessex area there
are rich source intervals throughout the strata. The contrast in organic richness and lithology
between the Wessex and Weald areas may be due to differences in palaeogeography and organic
input or preservation. Although both the Upper and Middle Lias have well-developed clay intervals,
potential in these sections is more limited.

The maturity of the shales is a function of burial depth and heat flow through time. In the Weald
study (Andrews, 2014), the Jurassic shales are considered mature for oil generation at vitrinite
reflectance, Ro, values between 0.6% and 1.1% at maximum burial depths between approximately
7000-8000 ft (2130-2440 m) and 12000-13000 ft (3660-3960 m) below surface; analysis of available
vitrinite reflectance and Tmax data for the study suggest that these depths are also applicable to the
 1
 © OGA 2016
THE JURASSIC SHALES OF THE WESSEX AREA: GEOLOGY AND SHALE OIL AND SHALE GAS RESOURCE ESTIMATION

Wessex area. Shales in the Wessex area may have experienced up to 6900 ft (2100 m) of uplift
(England, 2010) during the two significant uplift and erosion events in the Cretaceous and Tertiary.

Burial depths indicate that only the Lower Lias in the Channel Basin, south of the Purbeck-Isle of
Wight Disturbance, may be in the oil window present-day; however, palaeo-temperature data
suggest the rocks reached higher maturity during the time of maximum burial attained prior to the
uplift/erosion events. In the model presented here, accounting for maximum burial depth, only the
deepest interval – the Lower Lias – is considered to have potential for oil in terms of source rock
richness and (palaeo-) maturity, and only in a localised area, largely south of the Purbeck-Isle of
Wight Disturbance. The existence of a mature source rock which has generated and expelled
hydrocarbons, at least locally within the area, is supported by the presence of oil in conventional
reservoirs that has been correlated to Lower Lias source rocks (Colter & Havard, 1981; England,
2010). Although minor amounts of gas have been produced at Wytch Farm and gas shows have been
encountered in several onshore wells, the Lower Lias is not considered to ever have been sufficiently
deeply buried to have generated significant amounts of gas onshore. Well 98/11-2 in Bournemouth
Bay encountered dry gas in the Sherwood Sandstone (P1022 Relinquishment Document, 2009) and a
thermogenic gas seep offshore at Anvil Point on the Dorset coast (Selley, 1992; Selley, 2012; APT UK
Ltd., 2013) indicates that the Lower Lias maturity may increase into the Channel Basin depocentre.

Shales with an oil saturation index (Jarvie, 2012) of greater than 100 are identified in all of the
intervals of the Lower Lias, and therefore can be considered to have excellent source potential.
Interpreting the presence of producible oil in the organic-rich shales allows for an in-place resource
volume to be calculated with a broad range of probabilities. The determination of oil-in-place was
undertaken using the same methodology applied in the Weald study (Andrews, 2014) and is
described in detail in Andrews et al. (2014). The total volume of potentially productive shale in the
Wessex area was estimated using a 3D geological model built using seismic mapping integrated with
well data. This gross volume was then reduced to a net mature organic-rich shale volume using a
maximum, pre-uplift burial depth corresponding to a vitrinite reflectance of 0.6% (modelled at 7000
ft/2130 m and 8000 ft/2440 m). A further upwards truncation was then applied at two alternative
levels – firstly at a depth of c. 3950 ft (1200 m) and secondly at a depth of c. 5000 ft (1500 m) (as
proposed by Charpentier & Cook, 2011) below surface. A first truncation value of c. 3950 ft (1200 m)
was used for this study (as opposed to c. 3000 ft (1000 m) used in the Weald study) due to recent
legislation in the Infrastructure Act 2015 stating that hydraulic fracturing (fracking) is permitted only
at depths greater than 1200 m below National Parks, groundwater source protection zones 1, World
Heritage Sites and Areas of Outstanding Natural Beauty, which together cover most of the
prospective area. These cut-offs are applied regionally; the depth at which shale oil (or shale gas)
productivity becomes an issue in terms of pressure and hydrogeology will need to be addressed
locally.

The volumes of potentially productive shale and average oil yields were used as the input
parameters for a statistical calculation (using a Monte Carlo simulation, in which all the parameters
were varied within their set distributions over 50,000 iterations) of the in-place oil resource (see
Andrews, 2014). The results of the two scenarios modelled for each unit are presented in Table 1.
This study offers a range of total in-place oil resource estimates for the various Jurassic shales of the
Wessex area of 0.2-1.1-2.8 billion bbl (32-149-378 million tonnes) (P90-P50-P10). It should be

 2
 © OGA 2016
THE JURASSIC SHALES OF THE WESSEX AREA: GEOLOGY AND SHALE OIL AND SHALE GAS RESOURCE ESTIMATION

Figure 1. Location of the BGS/OGA Wessex study area in southern Britain, with previous BGS/DECC
shale study areas, currently licensed blocks and hydrocarbon fields. Other shale oil and shale gas
plays may exist.

 3
 © OGA 2016
THE JURASSIC SHALES OF THE WESSEX AREA: GEOLOGY AND SHALE OIL AND SHALE GAS RESOURCE ESTIMATION

emphasised that these ‘oil-in-place’ figures refer to an estimate for the entire volume of oil
contained in the rock formation, not how much can be recovered. A more refined methodology, like
the USGS’s Technically Recoverable Resource “top-down” estimates, requires production data from
wells, as yet unavailable for the study area.

Given the paucity of data, there is a high degree of uncertainty in these figures. There is likely to be
little or no ‘free oil’ for the Oxford Clay, Upper Lias and Middle Lias based on the oil saturation index
and although the Kimmeridge Clay does show excellent source potential, it is likely to be immature
regionally. The Lower Lias appears to be the only interval with shale oil potential onshore, albeit with
relatively small volumes in a localised area largely south of the Purbeck-Isle of Wight Disturbance.

 Total oil in-place estimates (billion bbl) Total oil in-place estimates (million tonnes)
 With top of oil With top of oil With top of oil With top of oil
 window at 7000 ft window at 8000 ft window at 7000 ft window at 8000 ft
 (2130 m) maximum (2440 m) maximum (2130 m) maximum (2440 m) maximum
 burial depth burial depth burial depth burial depth
Kimmeridge Clay 0.00 – 0.01 – 0.04 0.00 – 0.00 – 0.00 0.24 – 1.50 – 4.77 0.00 – 0.00 – 0.00
Oxford Clay 0.00 – 0.01 – 0.03 0.00 – 0.00 – 0.00 0.20 – 1.17 – 3.52 0.01 – 0.06 – 0.19
Upper Lias Clay 0.00 – 0.00 – 0.01 0.00 – 0.00 – 0.00 0.12 – 0.39 – 1.00 0.03 – 0.09 – 0.20
Middle Lias Clay 0.01 – 0.03 – 0.08 0.00 – 0.01 – 0.02 1.31 – 4.38 – 11.53 0.38 – 1.21 – 2.93
Lower Lias 0.52 – 1.34 – 2.70 0.22 – 0.55 – 1.08 71.5 – 182.8 – 368.4 30.0 – 75.2 – 147.3
All Jurassic clay
 0.2 – 1.1 – 2.8 32 – 149 – 378
units - Wessex
Kimmeridge Clay 0.41 – 2.03 – 4.77 0.11 – 0.61 – 1.44 55 – 270 – 636 15 – 81 – 192
Corallian Clay 0.20 – 0.52 – 1.04 0.11 – 0.30 – 0.61 27 – 69 – 139 15 – 40 – 81
Oxford Clay 0.59 – 1.39 – 2.46 0.41 – 0.96 – 1.70 79 – 185 – 328 55 – 128 – 227
Upper Lias Clay 0.28 – 0.63 – 1.05 0.22 – 0.52 – 0.85 37 – 84 – 140 29 – 69 – 113
Middle Lias Clay 0.33 – 0.79 – 1.43 0.27 – 0.64 – 1.15 44 – 105 – 191 36 – 85 – 153
All Jurassic clay
 2.2 – 4.4 – 8.6 293 – 591 – 1143
units - Weald

Table 1. Estimates of the total potential in-place shale oil resource for the Jurassic in the Wessex
study area (top) and in the Weald Basin (bottom, from Andrews (2014)), onshore southern England.
P90, P50 and P10 values are given for each unit, where P10 is the most optimistic scenario. This
estimate only covers unconventional oil, and excludes volumes in potential tight conventional or
hybrid plays.

 4
 © OGA 2016
THE JURASSIC SHALES OF THE WESSEX AREA: GEOLOGY AND SHALE OIL AND SHALE GAS RESOURCE ESTIMATION

2 Introduction to the Wessex Study Area
2.1 Area of Interest
This study is an extension to the assessment of the in-place reserves of the Jurassic shales in the
Weald Basin (Andrews, 2014). This assessment covers an area of 2455 miles2 (6359 km2)
immediately west of the Weald Basin study (Figure 2) from the New Forest (Hampshire) to Honiton
(East Devon). The area contains several sites which are considered protected areas for hydraulic
fracturing under the Infrastructure Act 2015, including the Dorset Coast which is designated a World
Heritage Site, groundwater source protection zones, the New Forest National Park, and the Isle of
Wight, Dorset and Cranborne Chase, and West Wiltshire Downs Areas of Outstanding Natural Beauty
(Figure 3). In these regions fracking can only take place at a minimum depth of c. 3950 ft (1200 m)
below the surface.

This study is concerned only with a subsection of the onshore portion of the Wessex Basin, which is
termed in this report the ‘Wessex study area’. The Wessex study area encompasses three half-
graben sub-basins – the Dorset (or Winterbourne Kingston Trough), Mere (or Vale of Wardour), and
the onshore part of the Channel (or Portland-Wight) sub-basins – which together, along with the
Pewsey Sub-basin, comprise the Wessex Basin (as defined by Underhill & Stoneley, 1998; see Section
3.5.1 of Andrews (2014) for a discussion of the terminology). The Pewsey Sub-basin was included in
the Weald evaluation, as it can be considered a westward continuation of the Weald Basin
(Andrews, 2014).

2.2 Interval of Interest
Shales of Jurassic age are the focus of this study. Source richness of Cretaceous-aged sediments has
been identified in limestones of the Purbeck Group (Riboulleau et al., 2007; Schnyder et al., 2009),
but are not prospective due to their immaturity basin-wide (England, 2010). There are no pre-
Jurassic rocks with significant hydrocarbon potential identified within the study area (Stoneley,
1992), although organic-rich shales within the Triassic Mercia Mudstone Group were encountered in
the Kimmeridge 5 well (Brand, 1980). To the west of the study area, around the Bristol Channel, dark
shales of the Triassic Westbury Formation may contain some organic-rich intervals (Macquaker et
al., 1986; Tuweni & Tyson, 1994). Knowledge of the Jurassic section within the study area comes
from a number of wells which have penetrated the interval. The full Jurassic succession crops out
within the study area (Figure 4), providing additional insight into lithology and facies variability.
Three main source rock intervals have been identified – the Lower Lias, Oxford Clay and Kimmeridge
Clay – whilst additional potential may exist in other shale units, including the Middle Lias Eype Clay
and Upper Lias Downcliff Clay (Figure 5).

2.3 Exploration History
Oil and gas exploration in the Wessex area began in the 1930s when geologists from D’Arcy
Exploration discovered oil seeps in Corallian, Purbeck and Wealden beds along the Dorset coast
(Lees & Cox, 1937). After the 1934 Petroleum Production Act came into force, the first exploration
licenses were issued in 1935 to D’Arcy Exploration (Evans et al., 1998), with early exploration

 5
 © OGA 2016
THE JURASSIC SHALES OF THE WESSEX AREA: GEOLOGY AND SHALE OIL AND SHALE GAS RESOURCE ESTIMATION

 Figure 2. (Top) Location of the BGS/DECC shale oil Weald Basin study and the BGS/OGA
 Wessex study area, southern Britain. (Bottom) Zoom-in of location of the Wessex study area.
 Contains Ordnance Survey data © Crown copyright and database right 2016.

targeting anticlinal structures which had been mapped at surface (Buchanan, 1998). Since then (as of
March 2016), there have been a total of 301 hydrocarbon wells drilled in the Wessex area,
consisting of 77 exploration, 10 appraisal and 214 development wells. No unconventional or hybrid-
play wells have so far been drilled within the study area.

2.3.1 Oil Fields

There are four oil fields within the study area, including the largest onshore oil field in North-West
Europe, Wytch Farm. The other fields are Kimmeridge, Wareham and Waddock Cross (Figure 6); all
 6
 © OGA 2016
THE JURASSIC SHALES OF THE WESSEX AREA: GEOLOGY AND SHALE OIL AND SHALE GAS RESOURCE ESTIMATION

 Figure 3. Areas considered to be protected under the 2015 Infrastructure Act, where hydraulic
 fracturing (fracking) may only be permitted at burial depths of 1200 m (c. 3950 ft) or greater.
 Background is shaded-relief topography. Contains Ordnance Survey data © Crown copyright and
 database right (2016). Data sources: Areas of Outstanding Natural Beauty & National Parks ©
 Natural England copyright, 2016. Contains Ordnance Survey data © Crown copyright and
 database right (2016); World Heritage Sites © Historic England (2016). Contains Ordnance Survey
 data © Crown copyright and database right (2016) The Historic England GIS Data contained in
 this material was obtained on 21/04/2016. The most publicly available up to date Historic
 England GIS Data can be obtained from http://www.HistoricEngland.org.uk; Groundwater Source
 Protection Zones (SPZ) © Environment Agency copy right and/or database right 2016.

fields are located in the northern part of the Channel Basin, close to the Portland-Isle of Wight fault
system, on Jurassic – Early Cretaceous palaeo-highs. Wytch Farm and Wareham are interpreted to
have been charged by upwards and cross-fault migration of oil from mature Lower Liassic source
rocks situated on the downthrown (south) side of the Purbeck-Isle of Wight fault system, prior to
Cretaceous and Tertiary uplift (Underhill & Stoneley, 1998; Buchanan, 1998; Scotchman, 2001). The
Kimmeridge field is unique in being the only commercial discovery in a trap created by Tertiary
structural inversion and the only producing field in the hanging wall of the Purbeck-Isle of Wight
Disturbance (Evans et al., 1998; Hawkes et al., 1998; Gluyas et al., 2003). So far, of the four sub-
basins in the Wessex Basin (sensu Underhill & Stoneley, 1998), only the Channel Basin has proved a
viable petroleum system (DECC, 2013).

The Wytch Farm structure is an east-west trending fault block bounded to the south by a normal
fault down-thrown to the south, with minor faults to the north, east and west (Colter & Havard,
1981). The initial discovery well, Wytch Farm 1, was drilled by Gas Council (Exploration) in 1973 and
encountered light oil in the Bridport Sands and oil shows in the Cornbrash. Wytch Farm D5, drilled in
1977, was the first test of the deeper Triassic Sherwood (Bunter) Sandstone and discovered light oil
 7
 © OGA 2016
THE JURASSIC SHALES OF THE WESSEX AREA: GEOLOGY AND SHALE OIL AND SHALE GAS RESOURCE ESTIMATION

 Figure 4. Surface geology of the study area with hill-shaded relief, with the Wessex study area
 (shown in pink). Surface geology from BGS 1:50,000 scale DiGMapGB © NERC.

in that interval (Colter & Havard, 1981). In addition to the Bridport Sands and Sherwood Sandstone
reservoir intervals, oil shows are present in the Cornbrash and Forest Marble associated with vugs
and fractures (Colter & Havard, 1981). Since production began in 1979, 200 wells have been drilled
in the Wytch Farm Oilfield, which has produced approximately 76x106 m3 oil and 4x10⁶ m3 gas
(figures from OGA, Feb 2016; more recent production figures are available at
https://www.ogauthority.co.uk/data-centre/data-downloads-and-publications/production-data/).
Coupled with the offshore extensions, the Wytch Farm Oilfield is estimated to contain 500 mmbbls
recoverable reserves (DECC, 2013).

The oldest commercial hydrocarbon discovery in the Wessex area is the Kimmeridge Oilfield (Evans
et al., 1998; Gluyas et al., 2003). It was discovered by the BP-operated Kimmeridge 1 well in 1959,
testing a large surface anticline (Colter & Havard, 1981). The trap is a faulted inversion anticline,
formed in the Tertiary, immediately to the south (on the downthrown side) of the Purbeck-Isle of
Wight Disturbance (Evans et al., 1998; Gluyas et al., 2003). Production is from underpressured,
fractured tight limestones in the Cornbrash (Colter & Havard, 1981; Selley & Stoneley, 1987; Gluyas
et al., 2003). Following the Wytch Farm discovery, Kimmeridge 5 was drilled in 1980 as a test of the
deeper potential at the Kimmeridge Oilfield (Evans et al., 1998; Gluyas et al., 2003), recording oil
shows in the Bridport Sands and Sherwood Sandstone. Produced volumes at the Kimmeridge Oilfield
have exceeded the estimated trap volume, with several theories developed to explain this (Selley &
Stoneley, 1987; Evans et al., 1998). It has been proposed that the field is receiving charge from a
deeper reservoir present-day (Selley & Stoneley, 1987) although Evans et al. (1998) argue that the
production decline curve does not support this. Alternatively, additional reserves may be trapped
either offshore in an unmapped extension (Evans et al., 1998; Gluyas et al., 2003), the fracture
system may extend the reservoir into the Oxford Clay (Evans et al., 1998) or the Cornbrash reservoir
may be actively recharging from a mature lower Oxford Clay source (Fraser & Aryanto, in prep).

 8
 © OGA 2016
THE JURASSIC SHALES OF THE WESSEX AREA: GEOLOGY AND SHALE OIL AND SHALE GAS RESOURCE ESTIMATION

Wareham 1, drilled by BP in 1964, encountered oil in a thin fractured Inferior Oolite interval and at
the top of the Bridport Sands (Colter & Havard, 1981). The well was initially interpreted to have
failed to locate pay, but was subsequently re-evaluated, re-entered and tested in 1970 (Hurst &
Colter, 1998). Wareham 2, drilled downdip from Wareham 1, produced oil from the Cornbrash after
acid wash treatment (Colter & Havard, 1981). Good oil shows were encountered in Wareham W2
(D5), drilled by Gas Council (Exploration) in 1980, in the Inferior Oolite and Bridport Sands, with
additional gas shows in the Oxford Clay, Kellaways, Cornbrash, Forest Marble, and Fuller’s Earth

 Figure 5. Generalised stratigraphic column for the Jurassic of the Wessex area showing the main
 source rock intervals (in red) and other potential source rock intervals (in pink). Adapted from
 Andrews (2014).

 9
 © OGA 2016
THE JURASSIC SHALES OF THE WESSEX AREA: GEOLOGY AND SHALE OIL AND SHALE GAS RESOURCE ESTIMATION

 Figure 6. Distribution of producing oil fields, discovery wells and well with hydrocarbon shows
 within the study area, based on well reports and published literature. Also shown are areas
 currently licensed or offered for award for exploration, and main BGS structural elements
 (British Geological Survey, 1996). Contains British Geological Survey materials © NERC (2016).

formations. To date, less than 0.7 x 10⁶ m3 oil has been produced from the Wareham field (data from
OGA, Feb 2016).

Waddock Cross 1 was drilled by Gas Council (Exploration) in 1982, and produced oil at sub-
commercial flow rates from the Bridport Sandstone. The structure, a low-relief closure with four-way
dip, was re-evaluated in 2003 by Egdon Resources with the drilling of Waddock Cross 2, which
discovered a gross oil column of c. 78 ft (24 m) in the Bridport Sandstone (Waddock Cross 2 Wellsite
Geological Report, 2004) and began producing in 2013.

2.3.2 Other Hydrocarbon Indications

Alongside the producing fields, numerous other wells in the Wessex area have encountered
hydrocarbon shows (Figure 6), giving further indication of an active petroleum system. On the Isle of
Wight the Arreton 2 well, drilled in 1974 by Gas Council (Exploration), was completed as a dry hole
but encountered dead oil staining in several intervals. This suggests that the structures in the
Jurassic have been flushed, possibly as a result of late faulting/folding (Gas Council Exploration,
1974). UK Oil & Gas Investments (UKOG) have re-evaluated the Arreton 2 data and interpreted it to
be an undeveloped oil discovery, with 78 ft (23.8 m) oil pay in the Portland and 127 ft (38.7 m) oil
pay in the Inferior Oolite, and a P50 oil-in-place volume of 219 mmbbl in the whole Arreton structure
(UKOG press release, 2016).

Also on the Isle of Wight, but to the north of the Purbeck-Isle of Wight Disturbance, minor oil shows
were encountered largely within limestones of the Great Oolite Group in Sandhills 1 (drilled in 1982),
and Sandhills 2/2z (drilled in 2005). Geochemical analysis of samples from Sandhills 2/2Z indicates
that the oil is residual and highly biodegraded (GHGeochem, 2005).
 10
 © OGA 2016
THE JURASSIC SHALES OF THE WESSEX AREA: GEOLOGY AND SHALE OIL AND SHALE GAS RESOURCE ESTIMATION

The Bushey Farm A1 well (and sidetrack A1Z) drilled by British Gas in 1981, was classified as a dry
hole although light, low sulphur oil was encountered in the top of the Bridport Sandstone reservoir
(Johnson & Lister, 1981). Oil was also found in the Bridport Sandstone reservoir within the Coombe
Keynes 1 well, which additionally encountered small amounts of biodegraded oil within the Oxford
Clay and Lower Lias; the biodegraded oils were of a similar type and maturity to the non-
biodegraded oil within the reservoir (McQullken & Cocksedge, 1989). Geochemical analysis
indicates the oil found in minor shows at Chickerell 1 (Forbes, 1987), Coombe Keynes 1 (McQullken
& Cocksedge, 1989) and Bushey Farm A1 (Johnson & Lister, 1981) is derived from the same or similar
source as the oil at the Wytch Farm, Wareham and Kimmeridge oil fields. Forbes (1987) found a
good correlation between the oils and Lower Lias source rocks in the Chickerell 1 well, although the
Lower Lias is immature at the well location.

High levels of gas (C1-C5) were encountered in the Lower Lias mudstones of the Hewish 1 well,
although the target reservoir interval, the Sherwood Sandstone, was water wet. Elevated gas
readings were common throughout the Jurassic and in the Triassic Sherwood Sandstone at Southard
Quarry 1. However, despite log interpretations indicating the presence of hydrocarbons in the target
reservoir intervals, poor hole conditions prevented open hole testing for a full assessment of the
potential (Bromfield, 1990). Lulworth Banks 1, drilled offshore in Quadrant 97 but on an onshore
license, discovered uncommercial gas in sandstones of the Bridport and Kellaways formations (DECC,
2014). Also offshore, in Bournemouth Bay, Well 98/11-2 was a sub-commercial gas discovery, with
the Sherwood Sandstone as the main reservoir interval (BP, 2011).

2.4 Seeps
As previously mentioned, surface oil seepages along the Dorset coast gave exploration geologists an
initial indication of an active petroleum system in the Wessex area (Lees & Cox, 1937) and have
subsequently been reported at several locations on the coast, including at Osmington Mills,
Worbarrow Bay, Mupe Bay, Lulworth Cove and Durdle Door (Ebukanson & Kinghorn, 1986b; Selley,
1992; Bigge & Farrimond, 1998; Underhill & Stoneley, 1998; Hawkes et al., 1998; Watson et al.,
2000). The seeps are limited to where Jurassic – Early Cretaceous beds dip north into major faults
(Selley & Stoneley, 1987). The cliff section of the Bencliff Grits (Middle Oxfordian age) at Osmington
Mills is dominated by oil-stained sandstones (Watson et al., 2000), and an oil-water contact has been
identified within the section (Cornford et al., 1988); Watson et al (2000) proposed that this is the
remnant of a breached trap. In addition, thermogenic gas seeps have been reported from the sea-
floor off Anvil Point, Swanage (Miles et al., 1993; Selley, 2012; APT UK Ltd, 2013). The gases are
thought to be oil-associated, as they were generated at a maturity equivalent to approximately 1.0%
Ro, and have a similar source to other hydrocarbons in the area (APT UK Ltd., 2013).

The Mupe Bay seep is of particular significance as it has been cited as evidence for an Early
Cretaceous onset of petroleum generation and migration within the Wessex area (Cornford et al.,
1988; Kinghorn et al., 1994; Wimbledon et al., 1996; Emmerton et al., 2013), although this view has
been challenged (Miles et al., 1993; Miles et al. 1994; Bigge & Farrimond, 1998; Parfitt & Farrimond,
1998). The seep occurs in a Wealden fluvial channel conglomeratic bed which contains darker oil-
cemented, poorly consolidated sandstone clasts in a matrix of sand permeated by light oil, with oil
continuing to seep into the sandstone at the present time (Lees & Cox, 1937; Selley, 1992;
Emmerton et al., 2013). Hesselbo & Allen (1991) inferred a local source for the clasts, either through
 11
 © OGA 2016
THE JURASSIC SHALES OF THE WESSEX AREA: GEOLOGY AND SHALE OIL AND SHALE GAS RESOURCE ESTIMATION

collapse of a river bank or another surface degradation process. The seep oils have all been heavily
biodegraded (Bigge & Farrimond, 1998; Parfitt & Farrimond, 1998).

Cornford et al. (1988) proposed a two-phase staining model for the seep based on maturity
differences between the oils in the clasts and matrix. In this model, oil generated in the Early
Cretaceous seeped to the surface and stained and cemented alluvial channel sands. These were then
eroded and re-deposited as oil-cemented clasts in a conglomeratic sandstone, with the matrix then
stained by a subsequent migration of oil. This model is supported by sedimentological (Wimbledon
et al., 1996) and palaeomagnetic studies (Emmerton et al., 2013). Others have suggested that the
apparent difference in maturity can be explained by differential biodegradation between the clasts
and matrix (Miles et al., 1993; Bigge & Farrimond, 1998), or that in fact there is no difference in
maturity (Parfitt & Farrimond, 1998), although this does not preclude two phases of oil staining or
Early Cretaceous generation and migration.

 12
 © OGA 2016
THE JURASSIC SHALES OF THE WESSEX AREA: GEOLOGY AND SHALE OIL AND SHALE GAS RESOURCE ESTIMATION

3 Database
The assessment of the Jurassic shales of the Wessex area was carried out with the development of a
3D model created from detailed seismic mapping integrated with all available hydrocarbon well
data, relevant deep stratigraphic borehole information and outcrop geology. A total of 301
hydrocarbon wells have been drilled in the study area, and numerous boreholes have been drilled
for resources, commercial development or scientific studies (Figure 7). Boreholes are generally
relatively shallow and lack downhole geophysical data that are commonly acquired with
hydrocarbon wells.

 Figure 7. Exploration, appraisal and development wells, and deep boreholes (> 100 m total
 depth) of the Wessex area. Background is hill-shaded topography. Contains Ordnance Survey
 data © Crown copyright and database right (2016). Contains British Geological Survey materials
 © NERC (2016).

Out of the total 87 exploration and appraisal wells drilled in the study area, time-depth data was
available on 47 of these wells (Figure 8) which were used to tie the seismic interpretation and build
the velocity model for the depth conversion. A selection of these key wells are illustrated in six
correlation panels (Appendix B), which extend into the Weald Basin study area (Figure 9).
Geochemical data were available on a total of 14 wells, three boreholes and from eight outcrop
localities (Figure 10). The boreholes at Swanworth Quarry and Metherhills, southern Dorset, were
drilled as part of the Natural Environment Research Council’s Rapid Global Geological Events (RGGE)
special topic ‘Anatomy of a Source Rock’, and cored the complete Kimmeridge Clay Formation
(Morgans-Bell et al., 2001). There are numerous wells and boreholes in the ‘core mature area’ of the
Lower Lias in southern Dorset and on the Isle of Wight, however many are too shallow or lack time-
depth data for use in this project. Geochemical data is limited to one well on the Isle of Wight

 13
 © OGA 2016
You can also read