Competition and the Reputational Costs of Litigation
←
→
Page content transcription
If your browser does not render page correctly, please read the page content below
Competition and the Reputational Costs of Litigation∗
             Felix von Meyerinck†, Vesa Pursiainen‡, and Markus Schmid§

                                              August 2021

                                                 Abstract
         We study the role of competition in customers’ reactions to litigation against firms,
         using anonymized mobile phone location data. A class action lawsuit filing results
         in a 4% average reduction in customer visits to target firms’ outlets in the following
         months. The effect strongly depends on competition. Outlets facing more competition
         experience significantly larger negative effects. Closer competition matters more, both
         in terms of geographic and industry proximity. Announcement returns and quarterly
         accounting revenues around lawsuit filings also strongly depend on competition. Our
         results suggest that competition is an important component in customers’ ability to
         discipline firms for misbehavior.

       JEL classification: D12, D43, G14, G30, K42
       Keywords: class action lawsuits, corporate misbehavior, competition, reputational costs

   ∗
     We appreciate the helpful comments from Yakov Amihud, Efraim Benmelech, Mikael Homanen, William
Johnson, Jonathan Karpoff, Peter Limbach, Guy Liu, Sibo Liu, Fangyuan Ma, Alberto Manconi, Adair
Morse, Holger Mueller, Mikael Paaso, Bruno Pellegrino, Martin Schmalz, Thomas Schmid, Steven Davidoff
Solomon, Philip Valta, and Petra Vokata as well as conference and seminar participants at the University of
St. Gallen, China International Conference in Finance (CICF) 2021, Swiss Finance Insitute (SFI) Research
Days 2021, Workshop on Corporate Governance and Investment (WCGI) 2021, and International Young
Finance Scholars’ Conference 2021. The authors have no conflicts of interest to disclose. All errors are ours.
   †
     University of St. Gallen, E-mail: felix.meyerinck@unisg.ch
   ‡
     University of St. Gallen, E-mail: vesa.pursiainen@unisg.ch
   §
     University of St. Gallen, E-mail: markus.schmid@unisg.ch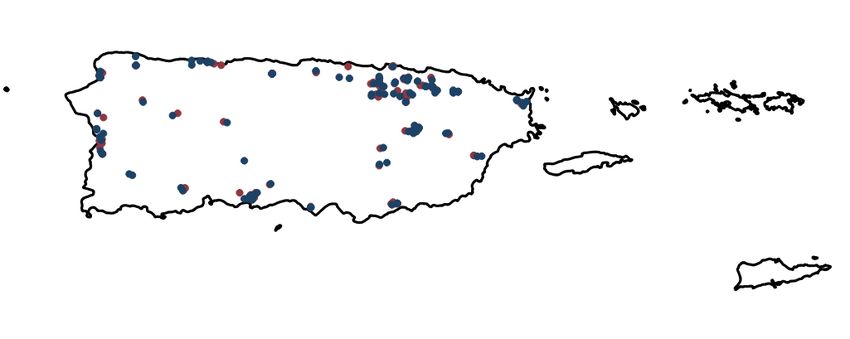
1         Introduction

Lawsuits against firms tend to be associated with a negative stock price reaction for the
target firm.1 Dyck, Morse, and Zingales (2020), among many others, suggest that part
of this loss of value is attributable to reputational costs – i.e., the customers of the firm
being less inclined to do business with it. Moreover, Karpoff and Lott (1993) argue that the
reputational cost constitutes most of the cost incurred by firms accused of fraud. In effect,
this means that a substantial part of the mechanism through which lawsuits discipline firms
is customers’ decision to punish firms that do something they do not approve of. While this
seems intuitive, the empirical measurement of this disciplining mechanism is difficult, with
most evidence based on indirect measures like share price reactions (e.g., Murphy, Shrieves,
and Tibbs, 2009) or anecdotal survey data.2,3

        One important aspect that has not been studied is the fact that customers’ ability to vote
with their feet depends on the availability of alternatives. In other words, it requires com-
petition. While there are numerous studies suggesting that more competition is associated
with lower prices (Dafny, Duggan, and Ramanarayanan, 2012; Borenstein and Rose, 1994;
Brown and Goolsbee, 2002), better quality (Matsa, 2011), and reduced governance problems
(Giroud and Mueller, 2010, 2011), there is, to the best of our knowledge, no research on the
role of competition in enforcing discipline through the legal system. If reputational costs
represent a large part of the potential punishment from litigation, a lack of competition has
the potential to render the legal system ineffective in disciplining firms.

        In this paper, we study the role of competition in the reputational costs associated with
class action lawsuits. We conjecture that competition is a crucial part of the efficacy of the
legal system to discipline firms for wrongdoing. Prior studies suggest that legal penalties
    1
      See, e.g., Bhagat, Brickley, and Coles (1994), Bizjak and Coles (1995), and Gande and Lewis (2009).
    2
      For example, a recent CompareCards survey finds that 38% of all Americans feel that at least one firm
is behaving wrongly and are willing to express their disapproval by withholding their dollars.
    3
      Johnson, Xie, and Yi (2014) find evidence of reputational damage in business volumes with large cus-
tomers.

                                                    1
from litigation are small relative to the total value loss to firms (e.g., Bizjak and Coles, 1995).
This means that much of the potential cost inflicted on firms must come from reputational
losses that result in a loss of business. However, such reputational damage is likely to result
in financial losses by reduced business volumes only if customers have alternative providers
that they can switch to.
We perform three sets of analyses. First, we analyze changes in monthly customer visits
at the outlet level around lawsuit filings. Second, we study stock price reactions to the filings
of class action lawsuits. Third, we analyze changes in quarterly accounting revenue around
lawsuit filings. The outlet analysis allows a clean identification of reputational effects at a
high frequency across a large sample of outlets. Importantly, it also enables constructing
detailed measures of the different dimensions of competition at the outlet level.4 On the other
hand, the availability of data for the period from 2018 onward reduces the sample of lawsuits
underlying this analysis. The analysis of abnormal returns to the filings of lawsuits allows us
to compare our results with prior literature on the shareholder value effect of lawsuits (e.g.,
Gande and Lewis, 2009), while the analysis of quarterly accounting revenues around lawsuit
filings shows that our outlet-level results generalize to the most comprehensive sample of
class action lawsuits starting in 1996.
To measure outlet visits, we use aggregated and anonymized mobile phone data from
SafeGraph. SafeGraph offers anonymized mobile phone location statistics covering a rep-
resentative sample of approximately 10% of all mobile devices in the United States. These
data allow us to observe the monthly number of customer visits to each retail outlet. Hence,
we are able to observe the changes in retail business volume at a monthly frequency at the
outlet level, which helps us overcome many of the data challenges of studies using account-
ing data.5 We collect data on 29 class action lawsuits announced between March 2018 and
4
Moreover, it does not suffer from the confounding effects that complicate interpretations of abnormal
returns or accounting measures. See, e.g., Karpoff (2012) for a discussion on the measurement of reputational
losses.
5
In Table A.2, we report regressions of the logarithm of quarterly revenues on aggregate customer visits
across all outlets during a quarter. Results suggest that aggregate customer visits are closely related to
2February 2020 and construct a panel dataset of 25,155 outlets belonging to the target firms.
As a control group, we use all retail outlets within the same six-digit NAICS industry and
the same ZIP code as the target outlets. This allows a clean identification of the effect of
the lawsuits on target retail customer volumes, controlling for any changes in local business
conditions. To measure competition, we calculate Herfindahl-Hirschman indices (HHI) based
on the number of stores of competing firms within the target firm’s six-digit NAICS industry
and ZIP code. As an alternative measure for competition, we calculate the simple number
of alternative outlets in the same industry and location.
Our results provide strong evidence of reputational costs associated with class action law-
suits. The filing of a class action lawsuit is accompanied by a reduction in monthly customer
visits of approximately 4%. The reduction in unique visitors is of a similar magnitude. We
also find that competition plays a crucial role in the effect of lawsuits on customer behavior,
with significantly larger negative effects in outlets facing more competition. The effects of
competition are economically large. A one-standard-deviation increase in competition, as
measured by the HHI calculated within the same ZIP code and NAICS industry, results
in additional four percentage points reduction in customer visits. Similarly, we find that
a larger number of alternative firms at the same location is associated with a significantly
larger reduction in customer visits, while in the extreme cases with only one competing firm
there is no observable reduction in customer visits. We also find that firms are more likely
to close outlets following filings of class action lawsuits, and that the effect is stronger when
there is more competition. These results are consistent with our prediction that competition
facilitates retail customers’ disciplining of firms.
Next, we study different dimensions of competition. The levels of competition within the
same six-digit and four-digit NAICS industries both matter, but competition at the same
two-digit NAICS industries does not have any incremental explanatory power over those
two. This suggests that competition matters primarily between firms whose products are
firm-level revenue. Hence, declines in shop visits strongly affect company-wide revenues.
3close substitutes. We find similar results when looking at competition at different geographic
aggregation levels. Competition measured at the ZIP code level has the strongest effect on
the reduction in customer visits following a lawsuit. Adding county-level competition does
not have incremental explanatory power, but state-level competition seems to matter as
well. In other words, it appears that there are both a very local and a broad, state-level,
component of market power.
Finally, we find that the negative effect of lawsuits is larger in areas with more religious
populations, areas with stronger social norms, measured by the social capital index of Lin and
Pursiainen (2020), and in more Republican-voting counties. These demographic differences
are likely to be proxies for customers’ willingness to punish firms for wrongdoing and to
vote with their feet. They also suggest that the customer reactions we observe are at least
partly driven by moral considerations and not by concerns about product or service quality,
as these would likely affect all locations similarly. The same is true of possible broader
concerns about the integrity of the firm.6
One potential concern about our analysis is that the timing of the customer reaction
is somewhat ambiguous. Class action lawsuits are typically preceded by some alleged mis-
conduct by the firm. Using the lawsuit filing date for treatment timing may hence not be
accurate in cases where customers learn about the misconduct before the lawsuit is filed.
To address this issue of timing, we conduct an additional robustness check analysis, similar
to our main analysis of customer visits, where we change the timing of treatment to be the
beginning of the class action period. This approximates the beginning of the actual miscon-
duct by the firm, instead of the filing of the lawsuit. We then repeat our main analysis of
the effects of competition on customer response. The results remain qualitatively similar to
our main results. However, the estimated negative reaction is somewhat larger when using
this methodology. These results show that our conclusions are not sensitive to the definition
of the treatment timing, although the magnitude of the estimates is affected by it.
6
For example, Cline, Walkling, and Yore (2018) find that managers’ personal indiscretions can affect their
firms’ business.
4We then focus on the stock price response to class action lawsuits. In a comprehensive
sample of more than 3,000 class action lawsuits filed since 1996, we find that the filing of a
class action lawsuit is associated with large negative stock returns. In particular, the aver-
age cumulative abnormal return (CAR) is -10% over a window of ten days prior to one day
after the filing date. This finding is consistent with prior literature (e.g., Gande and Lewis,
2009). Supporting our findings from the sample of outlet visits, we find that competition
is an important determinant of the announcement return. Firms facing more competition
experience significantly more negative abnormal returns around the filings of class action
lawsuits. This finding is robust to using various measures of competition. It is also statis-
tically and economically significant. A one-standard-deviation increase in competition, as
measured by the HHI calculated within the same six-digit NAICS industry, results in one
percentage point lower cumulative abnormal returns.
To confirm that our results on customer visits are not confined to the sample of class
action lawsuits that overlaps with the SafeGraph data, we also perform an analysis of quar-
terly accounting revenues using a sample of around 3,800 class action lawsuits filed since
1996. For every firm that is a target of a lawsuit, we use a control group consisting of all
other firms in the same six-digit NAICS industry. Relative to the control firms, targets
of class action lawsuits experience a 9-10% reduction in revenue in the year following the
filing of the lawsuit. As with outlet visits and abnormal returns around lawsuit filings, the
effect is dependent on competition, with significantly larger reductions in revenue observed
at firms in more competitive industries. A one-standard-deviation increase in competition,
as measured by the HHI calculated within the same six-digit NAICS industry, is associated
with two percentage points in additional revenue losses.
Generally, our results suggest that retail customers reduce their visits in the outlets of
firms targeted in class action lawsuits. To do so, they need to be aware of either the lawsuit
or the misconduct that led to the lawsuit. We study two possible information channels that
may increase the salience of lawsuits to consumers: media coverage and stock investments.
5First, using data from Factiva, we find that media attention increases substantially from
the month before until one month after the filing and then decreases to levels similar to or
below the months preceding the lawsuit. Second, we study stock holdings as an alternative
channel through which retail customers might learn of lawsuits or the events leading up to
them. Keloharju, Knüpfer, and Linnainmaa (2012) show that retail investors’ investment
decisions are influenced by their product market choices. As retail investors have strong
incentives to monitor the companies they own or consider investing in, they may learn of a
lawsuit or the misconduct that caused it through their company screening as investors and
then react both as consumers and as investors. Consistently, using data from Robinhood, a
large retail brokerage house, we find a substantial reduction in the number of retail investor
accounts holding stocks of firms targeted by class action lawsuits around the filing date.
These significant shifts in media coverage and retail investor holdings suggest that class
action lawsuits are salient events for retail customers.
Taken together, we uncover strong and consistent evidence that the ability of customers
to discipline firms in case of misconduct strongly depends on the competitive environment.
Using different methodologies and across different samples, we find the same patterns of a
negative average effect of the filing of class action lawsuits and this effect depending on the
level of competition.
Our findings provide important new insights into the importance of competition for the
proper functioning of the legal system. As a large part of the effective punishment from
lawsuits comes in the form of reputational damage (e.g., Karpoff and Lott, 1993), our results
suggest that lack of competition may render the legal system ineffective in deterring corpo-
rate misconduct. This might suggest that legal punitive damages need to increase substan-
tially with an increase in market power to maintain the intended deterrent effect. Concerns
over excessive market power are mounting as industries have grown more concentrated and
profitable, both in the U.S. (Covarrubias, Gutiérrez, and Philippon, 2019; Grullon, Larkin,
and Michaely, 2019) and globally (De Loecker and Eeckhout, 2018; Bae, Bailey, and Kang,
62021).7 Recent concerns about the abuse of monopolistic market power, in particular, by
shareholders (e.g., Azar, Schmalz, and Tecu, 2018) and tech firms (e.g., Shapiro, 2019), also
led to a surge in antitrust investigations in the U.S. as well as in Europe.8
Our results on the differential effects of competition measured at various levels may also
have important implications in other contexts. We show that competition measured at the
micro level appears significantly more important than competition measured at a broader
level, both in terms geography and industry definitions. This suggests that research on
competition benefits from studying settings in which market structures can be observed at
granular levels.
Our study is also closely related to the literature on shareholders’ ability to influence
firms through exit (see, e.g., Admati and Pfleiderer, 2009; Bharath, Jayaraman, and Nagar,
2013).9 Broccardo, Hart, and Zingales (2020) show theoretically that the exit options of
investors and consumers – two important stakeholder groups – share similarities as they
represent an effective means of pressuring firms. In a related study of customers punishing
firms, Homanen (2018) finds evidence of depositors disciplining banks by withdrawing their
deposits.
We also make several contributions to the literature on the reputational effects of class
action lawsuits and corporate misconduct more broadly. First, our outlet-level analysis
provides the most direct evidence to date of customers’ decision to discipline firms following
a lawsuit. Prior studies focus either on returns (e.g., Bizjak and Coles, 1995; Gande and
Lewis, 2009) or accounting performance (e.g., Murphy et al., 2009; Johnson et al., 2014)
around lawsuit filings. Hence, they suffer from potential alternative explanations, such as
increases in bankruptcy costs, which makes it difficult to measure the impact of customer
7
Kahle and Stulz (2017) report some stylized facts. In the U.S., there were 25% more public corporations
in 1975 than there were in 2015. In 1975, the top 109 firms earned 50 percent of the total earnings of all U.S.
public firms; in 2015, half of the total earnings were generated by just 30 firms. Similarly, 94 firms owned
half of the total assets of all U.S. public firms in 1975, but only 35 did so in 2015.
8
See also “Common ownership of shares faces regulatory scrutiny”, Financial Times, January 22, 2019;
“Justice Department Hits Google With Antitrust Lawsuit”, Wall Street Journal, October 20, 2020.
9
See Edmans (2014) for an overview of this literature.
7response in a clean fashion. We are able to measure customer visits directly at the outlet
level, thus avoiding these problems. Second, our finding that the competitive environment
of the target firm in a lawsuit is a key determinant of the reputational losses is novel and
has important implications for identifying reputational effects in other contexts as well.
2 Relevant literature
2.1 Competition and market power
Competition is important for many aspects of functioning markets. Economic theory suggests
that market power increases prices, reduces output, and decreases general social welfare
(see, for instance, Tirole, 1988). Several empirical studies suggest a positive relationship
between concentration and prices in various industries, including healthcare (Dafny et al.,
2012), airlines (Kim and Singal, 1994; Borenstein and Rose, 1994), life insurance (Brown
and Goolsbee, 2002), and many others. Matsa (2011) provides evidence that competition
increases quality in the supermarket industry, with the risk that customers will switch stores
providing competitors with a strong incentive to invest in product quality.
Competition affects firms in various ways. Product market competition can reduce man-
agerial slack (Hart, 1983), thereby substituting good corporate governance (Giroud and
Mueller, 2010, 2011). Aghion, Bloom, Blundell, Griffith, and Howitt (2005) show that com-
petition affects innovation. Raith (2003), Gaspar and Massa (2006), and Irvine and Pontiff
(2009) document that higher competition is correlated with higher risk, while Hou and
Robinson (2006) show that firms in more concentrated industries earn lower returns. Valta
(2012) reports that competition increases the cost of debt. Jung and Subramanian (2017)
develop a structural industry equilibrium model and show that CEO talent matters more in
more competitive markets. Chod and Lyandres (2011) theoretically show that the strate-
gic benefit from being public is larger in more competitive markets and provide empirical
8support for their model predictions. Evidence by Nickell (1996) indicates that stronger com-
petition is associated with a higher rate of total factor productivity growth. Ashenfelter and
Hannan (1986) show that competition limits firms’ ability to discriminate employees based
on gender.
The consequences of reduced competition have come to the fore recently as U.S. industries
have grown more concentrated and profitable (Covarrubias et al., 2019; Grullon et al., 2019).
Similarly, De Loecker and Eeckhout (2018) document an increase in market power globally
from 1980 to 2016, with markups having risen most in North America and Europe, and
least in Latin America and Asia. Increases in market power are known to be followed by
decreases in economic growth, capital allocation efficiency, and innovation activity (Bae et al.,
2021). Recent concerns about the abuse of monopolistic power, in particular, by shareholders
influencing entire industries (e.g., Azar et al., 2018) and tech firms (e.g., Shapiro, 2019), led
to a surge in antitrust investigations in the U.S. as well as in Europe.
2.2 The reputational costs of corporate misconduct
A large literature studies the role of reputation in disciplining firms (see, e.g., Karpoff (2012),
for an overview). Karpoff and Lott (1993) argue that the reputational cost constitutes most
of the cost incurred by firms accused of fraud. Karpoff and Lott (1999) find that punitive
lawsuits decrease the values of defendant equity market value by amounts that exceed settle-
ment or jury verdict amounts, indicating that punitive lawsuits impose reputational costs on
defendants and their shareholders. Alexander (1999) shows that offenses harming only pri-
vate parties and not government tend to be addressed largely through civil or market-based
and not criminal sanctions.
A number of studies focus on the share price impact of the filing of lawsuits. Bhagat et al.
(1994) study inter-firm litigation and find that the target firm experiences a negative average
return of around 1%, while the plaintiff experiences no corresponding gains. Similarly, Bizjak
9and Coles (1995) find that inter-firm antitrust litigation results in aggregate wealth losses,
partly explained by financial distress, behavioral constraints, and follow-on suits. Gande
and Lewis (2009) show that shareholders capitalize part of the losses from shareholder class
action lawsuits prior to the lawsuit filing date, and hence, that studies focusing on the
filing day underestimate the losses incurred. Bhagat, Bizjak, and Coles (1998) find that
the characteristics of the lawsuit, such as the legal issue and type of opponent, as well as
firm characteristics, such as firm size and proximity to bankruptcy, explain cross-sectional
variation in the wealth effects of corporate lawsuits.
The evidence on the effect of litigation on firms’ financial performance is more limited.
Murphy et al. (2009) find evidence of decreases in earnings and increases in risk following
allegations of corporate misconduct, although their results appear sensitive to the metric
used. Johnson et al. (2014) find that reputational damages for fraud result in a decline in
the firm’s operating performance through increased selling costs and that reputational losses
estimated from an announcement return approach reflect the actual decrease in the revenue
of a fraudulent firm.
Karpoff, Lee, and Martin (2008) find that individuals identified as responsible parties for
all Securities and Exchange Commission (SEC) and Department of Justice (DOJ) enforce-
ment actions for financial misrepresentation are very likely to lose their jobs and many face
criminal charges and penalties. Similarly, Desai, Hogan, and Wilkins (2006) show evidence
of reputational penalties to managers of firms announcing earnings restatements in the form
of management turnover and subsequent employment prospects. Fich and Shivdasani (2007)
find that, following a financial fraud lawsuit, outside directors do not face abnormal turnover
on the board of the sued firm but experience a significant decline in the number of other
board seats held. Brochet and Srinivasan (2014) show that independent directors who are
named as defendants when investors sue firms for securities fraud obtain more negative votes
and are more likely to leave the sued firm. In contrast, Helland (2006) finds limited evidence
of a negative effect on officers or directors of a company associated with allegations of fraud.
10While litigation can be an important disciplining mechanism, it can also have unintended
real consequences. For example, Arena and Julio (2015) find that the risk of securities class
action litigation alters corporate savings and investment policy, with firms having greater
exposure to securities litigation holding significantly more cash in anticipation of future
settlements and other related costs. Kempf and Spalt (2020) show that securities class
action lawsuits can constitute an obstacle to valuable corporate innovation. This is because
valuable innovation output makes firms particularly vulnerable to costly low-quality class
action litigation. Litigation risk affects the value and number of patents filed, suggesting
that firms take into account that risk in their innovation decisions. Lin, Liu, and Manso
(2020) find that the external pressure imposed by shareholder litigation discourages managers
from engaging in explorative innovation activities.
3 Data and methodology
3.1 Class action lawsuits
We begin our sample construction by retrieving all securities class action lawsuits from the
Securities Class Action Clearinghouse (SCAC) database maintained by Stanford Law School.
The database covers all securities class actions filed in federal court after the Private Secu-
rities Litigation Reform Act of 1995 came into effect. Our initial sample contains 5,883
lawsuits filed between 1996 and late 2020. From this sample, we drop lawsuits involving
financial firms and lawsuits involving firms headquartered outside of the U.S. For the dif-
ferent empirical analyses that we conduct in this study, we merge this sample with different
datasets.
113.2 Retail customer response to class action lawsuits
We examine the customer response to class action lawsuit filings using aggregated mobile
phone data from SafeGraph. SafeGraph is a company that produces anonymized mobile
phone location statistics. SafeGraph tracks 18.75 million devices, which represents approxi-
mately 5.6% of the entire U.S. population and about 10% of all U.S. mobile devices. Based
on SafeGraph’s analysis of its user base, it posits that its customers are representative of
the general U.S. population with regard to income, age, and other demographics. The data
are used in studies of social distancing during the SARS-CoV-2 pandemic (see, e.g., Bizjak,
Kalpathy, Mihov, and Ren, 2020; Charoenwong, Kwan, and Pursiainen, 2020; Weill, Stigler,
Deschenes, and Springborn, 2020), and more recently also to measure consumer responses to
firm’s actions (see, e.g., Painter, 2020; Gurun, Nickerson, and Solomon, 2020). The data in-
clude monthly number of visits and visitors at the outlet level. The coverage of SafeGraph’s
outlet-level data starts in January 2018.
We identify outlets of firms involved in class action lawsuits by manually searching the
SafeGraph database for outlets of firms involved in a class action lawsuit in the SCAC
database. We restrict the sample to lawsuits filed on or after March 1, 2018. This enables us
to maintain at least two monthly pre-treatment observations for all lawsuits. Moreover, we
disregard lawsuits filed after February 29, 2020. This avoids an impact of the SARS-CoV-2
pandemic on our results.10 Finally, we retain only outlets of firms involved in class action
lawsuits for which we can match control outlets as described below. Overall, this results in a
treatment sample comprising 25,155 distinct outlets associated with 29 class action lawsuits.
We construct the control sample by selecting all monthly observations of outlets in the
same ZIP code and six-digit NAICS industry as the treated outlets. This yields a matched
control sample comprising 123,129 distinct outlets. Table A.3 in the appendix reports the
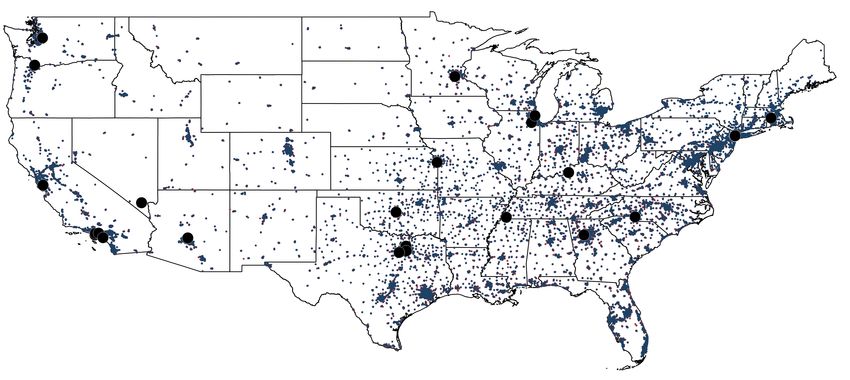
number of treated and control outlets for each class action lawsuit. Figure A.1 shows the
10
The first death attributed to the SARS-CoV-2 pandemic was reported in the U.S. on February 29, 2020.
12spatial distribution of outlets across the U.S.
We compute several measures of competition and concentration at the outlet level. As
our main measure, we calculate the HHI based on the percentage number of outlets each
firm has in the filing year, ZIP code, and six-digit NAICS industry as the treated outlet.11
We also vary the calculation of the HHI along two dimensions to study different dimensions
of competition. To analyze different levels of competition at the industry level, we compute
the HHI within the filing year and ZIP code but at the four-digit NAICS industry and two-
digit NAICS industry. To analyze different levels of geographic competition, we estimate the
HHI within the filing year and six-digit NAICS industry but at the county and state level.
Finally, we calculate the total number of firms with stores in the filing year, six-digit NAICS
industry, and ZIP code as an alternative measure of competition.
3.3 Stock market response to class action lawsuits
We analyze changes in shareholder value around filings of class action lawsuits using stock
price data from the Center for Research in Security Prices (CRSP). We do so for the entire
sample of class action lawsuits as provided by the SCAC. In this analysis, we additionally
drop lawsuits whose outcome are unknown at the time of writing (“ongoing”) and lawsuits
that are remanded to another court.
We estimate changes in shareholder value around the filing date by employing standard
event study methodology. To this end, we augment the sample of class action lawsuits
from the SCAC database with security and firm identifiers from CRSP. For each class action
lawsuit, we compute CARs as the sum of daily abnormal returns from ten trading days before
the event date to one trading day after the event date where the filing date of a security
class action lawsuit marks the event date. This event window follows prior literature, in
particular Gande and Lewis (2009). Daily abnormal returns are calculated as the observed
11
We rely on the North America Industry Classification System (NAICS) rather than the Standard Indus-
try Classification (SIC) system because SafeGraph only provides NAICS industry codes.
13return less a predicted return. The latter is the predicted return of a market model regression
in which daily returns are regressed on daily value-weighted index returns provided by CRSP
over a 250-day estimation window that ends eleven trading days prior to the event date.12
We require non-missing stock return observations in the event window and at least 90 non-
missing return observations in the estimation window to run the market model regression.
This results in a sample of 3,322 class action lawsuits. To mute the impact of outliers, we
winsorize all abnormal return measures at the 1st and 99th percentiles.
As in the outlet analysis, we use different measures for a firm’s competitive environment.
First, as a measure of industry concentration, we compute the HHI for a firm’s six-digit
NAICS industry in the fiscal quarter that precedes the filing date based on positive quarterly
revenue. Second, we count the number of distinct competing firms in a firm’s six-digit NAICS
industry with positive revenue. Third, we set a dummy equal to one for firms with the lowest
possible industry concentration, i.e., for firms with no competing firm in its six-digit NAICS
industry.
3.4 Revenue response to class action lawsuits
We estimate the response of the operating performance to class action lawsuit filings by
studying quarterly revenues from Compustat. Again, we utilize the entire sample of class
action lawsuits as provided by the SCAC. As in the analysis of stock returns, we also drop
lawsuits whose outcomes are unknown at the time of writing (“ongoing”) and lawsuits that
are remanded to another court. This results in a sample comprising 2,828 distinct treated
firms being the target of at least one securities class action lawsuit.
Consistent with the construction of the matched control sample in the outlet-level anal-
ysis, we match each quarterly lawsuit-firm observation with all quarterly observations of
12
Our results are very similar if we use CRSP’s equally-weighted market return as a market return proxy,
if we use a Fama and French (1993) three or Carhart (1997) four-factor model, or if we use a market-adjusted
model instead of a market model.
14firms active in the same six-digit NAICS industry.13 This yields a matched control sample
comprising 10,786 distinct firms.
The measures of competition that we employ in this analysis are the same as those used in
the analysis of changes in shareholder value around filings of class action lawsuits described
above.
4 Competition and retail customer response to class
action lawsuits
This section contains our empirical analysis of the retail customer response to class action
lawsuits. First, we describe the matched sample of outlets used in this analysis. Next, we
analyze the response of retail customers to class action lawsuits. Third, we study the impact
of local competition on retail customers’ ability to hold firms accountable for corporate
misbehavior. Finally, we turn our attention to other outlet characteristics that influence
retail customers’ response to class action lawsuits.
4.1 Descriptive statistics
Table 1 reports descriptive statistics for the monthly outlet panel. On average, close to 270
distinct customers pay around 400 visits to each outlet in our sample per calendar month.14
An outlet in our sample on average has around 13 other competing firms (defined based on
brand identifiers in SafeGraph) in the same six-digit NAICS industry, ZIP code, and month.
The average HHI for the outlets in our sample is 0.14. As measured by different HHIs,
industries become less concentrated if measured at less granular industry definitions (mean
13
In contrast to the outlet-level analysis, we only match based on six-digit NAICS industries and not based
on ZIP codes because the sample of potential control firms is not sufficiently populated to match on both
six-digit NAICS industries and ZIP codes.
14
Note that this is the number of visits and visitors tracked by SafeGraph, not the total number of visits
and visitors.
15of 0.10 and 0.07 for the four-digit and two-digit NAICS industries, respectively) or at larger
geographic units (mean of 0.11 and 0.10 at the county and state level, respectively).
4.2 Results
To analyze how retail customers respond to class action lawsuits, we study monthly customer
visits to outlets belonging to a firm that is the target of a class action lawsuit. As control
group, we use outlets in the same industry and ZIP code. We first perform a monthly
regression analysis specified as:
ln(V isits)i,s,t = βt × T reatmenti,s × Event monthi,t + αi,s + αs,j,k,t + i,s,t , (1)
where i indexes an outlet, s a lawsuit, t a month, j an industry, and k a ZIP code. Visits
is the monthly number of visits of an outlet. Treatment is a dummy indicating whether
an outlet belongs to a firm that is the target of a lawsuit. Event month are dummies
indicating months relative to the filing month. We include interacted lawsuit and outlet
fixed effects as well as interacted lawsuit, industry, ZIP code, and month fixed effects. These
fixed effects ensure that we compare within outlet changes in visits to treated outlets with
changes of visits to control outlets in the same month that are active in the same industry
and location. Therefore, these fixed effects control for a range of characteristics, including
the time trend, industry shocks coinciding with the filing of the lawsuit, and time-varying
ZIP code characteristics. Moreover, they absorb the stand-alone Treatment dummy as well
as the stand-alone Post dummy.
Panel A of Figure 1 shows the estimated monthly regression coefficients for the interacted
treatment-month dummies, relative to the month preceding the filing month of a lawsuit
(omitted in the regression). Generally, customer visits of firms targeted in class action
lawsuits tend to start falling already before the announcement, although this drop is not
statistically significant. This is not surprising as we cannot directly observe instances of
16misconduct, but use filings of a class action lawsuit a proxy for misconduct. In some cases,
information related to firms’ wrongdoing may transmit into the market before a lawsuit is
filed.
To address this issue of timing, in Panel B of Figure 1, we change the timing of treatment
to be the beginning of the class action period. This approximates the beginning of the actual
misconduct by the firm, instead of the filing of the lawsuit. We see that i) there is no longer a
negative pre-trend ahead of the treatment, and ii) the estimated decrease in customer visits
is larger. These observations suggest that, at least in some cases, this may better capture
the timing of the customer reaction to the misconduct. At the same time, it reduces the
sample size as some lawsuits move outside the period when we have data. For this reason,
and to maintain comparability with prior studies of class action lawsuits, we use filing date
as our main treatment timing. However, in Table 5, discussed below, we also perform the
main analyses using the class action period beginning date instead.
To facilitate further cross-sectional analysis of heterogeneity in the reputational effect
across treated stores, we define an indicator variable that equals one for the filing month and
the five months after (Post) and perform an analysis of the interaction term of this dummy
with the Treatment dummy. This analysis is specified as:
ln(V isits)i,s,t = β1 × T reatmenti,s × P osti,t + β2 × P osti,t + αi,s + i,s,t . (2)
The results are reported in Table 2. In Column 1, the coefficient on the interaction
term shows that outlets belonging to a firm that is the target in a class action lawsuit
experience a reduction in visits of -5.4% in the filing month and the five months following
the filing month of the lawsuit. With -6.6% and -3.8%, estimates remain economically
meaningful and statistically significant if we add month fixed effects, as in Column 2, as
well as interacted lawsuit, ZIP code, six-digit NAICS industry, and month fixed effects, as
in Column 3. Moreover, the positive and significant coefficient on the dummy variable Post,
17which is equal to one for the filing month and the five months after, is consistent with
positive spillovers to competitors. In Column 2, which includes month fixed effects, we find
that the sample of matched control outlets experiences an increase in shop visits of about
1.8%, while treated outlets suffer a decline in visits of -6.6% relative to control outlets, or
-4.8% overall. Taken together, these results provide strong evidence of reputational costs of
corporate misbehavior.
To analyze the impact of local competition on store visits, we augment the regression
from Column 3 of Table 2 with a triple interaction term, obtained by multiplying the existing
interaction term between the Treatment and the Post dummy with different measures of local
competition. These additional interaction terms allow us to gauge the incremental impact
of customers’ local ability to substitute visits of outlets belonging to the same firm targeted
in the same class action lawsuit with visits of outlets of a competing firm.
The results are reported in Table 3. In Column 1, we use a very granular form of the
HHI, estimated at the six-digit NAICS industry and ZIP code level, as a proxy for local
concentration. We continue to find a negative reputational effect following filings of class
action lawsuits on store visits, as indicated by the significantly negative coefficient on the
interaction term between the Treatment dummy and the Post dummy. Consistent with the
conjecture that lower competition mutes the disciplining effect of class action lawsuits, the
coefficient on the triple interaction term is positive and highly significant. Economically, this
result has sizeable implications: A one-standard-deviation increase in local competition, as
measured by the HHI, results in an additional four percentage points reduction in customer
visits compared to stores in the same month that belong to the same firm targeted in the
same lawsuit. This result implies that customers’ ability to punish firms for wrongdoing
critically hinges on the availability of outlets of firms that compete locally.
Next, we study whether different levels of competition matter differently. To do so, we
vary the industry granularity at which we measure competition to the four-digit and two-
digit NAICS industries. Results in Columns 2 and 3 show that less competition within
18the same four-digit and two-digit NAICS industries both reduce the ability of customers to
substitute visits of outlets of firms accused of wrongdoing with visits of outlets of competing
firms. However, when competition measures at all three levels of industry granularity are
included jointly as explanatory variables, as in Column 4, we obtain coefficients that are
monotonically decreasing the less granular the industry measures are, with competition at
the two-digit NAICS industry level having no incremental explanatory power beyond the two
more granular measures of industry competition. This implies that the ability of customers
to substitute visits of outlets of firms accused of wrongdoing is facilitated if the offerings of
competing outlets are more similar. In the Internet Appendix, we show that these results
are robust to using the number of unique visitors as the outcome variable, instead of number
of visits.
We also vary the geographic dimension of competition. To this end, we compute the
HHI based on six-digit NAICS industries at the county level and state level. The results
show that higher competition at the ZIP code level (Column 1), county level (Column 5),
and state level (Column 6) intensifies the reduction in store visits following filings of class
action lawsuits. However, when all three measures of competition are included jointly, as
in Column 7, we find that competition measured at the most granular (ZIP code) level has
the strongest effect on the reduction in customer visits, followed by competition measured
at the least granular (state) level. In contrast, adding county-level competition does not
have incremental explanatory power. Hence, there is both a local (i.e., ZIP code-level) and
a broader (i.e., state-level) component of market power.
Next, we analyze alternative measures of competition at the ZIP code level. First, we
count the number of other brands within the same six-digit NAICS industry and ZIP code.
If added to the regression model in the form of a triple interaction term, as in Column 8,
we find that a larger number of alternative brands at the same location is associated with a
significantly larger reduction in customer visits.15 As a second alternative measure of local
15
The coefficient on the triple interaction term between the Treatment dummy, the Post dummy, and the
19competition, we construct a dummy that is equal to one for outlets with only one competing
brand being active in the same six-digit NAICS industry and ZIP code, which corresponds
to the weakest form of local competition possible in our setting.16 Results in Column 9 show
that in such a concentrated market, the baseline reputational effect of a decline in outlet
visits of 5.6% is completely offset (the coefficient on the triple interaction term is 6.8%).
Taken together, these results using alternative measures of competition at the ZIP code level
underscore that competition is a necessary condition for the ability of customers to discipline
firms.
An alternative explanation for our findings is that customers do not stay away from
stores of companies facing a class action lawsuit for moral reasons, but because of a general
concern about product and service quality of these firms. Indeed, a company indicted for
corporate wrongdoing may be suspected of dishonest business practices even though the
wrongdoing addressed by the class action lawsuits in our sample are generally unrelated to
product and service quality. To distinguish between these two alternative interpretations,
we test whether the negative effect of lawsuits is larger in areas with a higher share of the
population known to have higher moral standards and a higher propensity to hold individuals
and firms accountable for deviations from these high moral standards. In contrast, concerns
about product and service quality and, more generally, concerns about the integrity of the
firm are expected to affect all locations similarly. We test this empirically by interacting the
Treatment dummy and the Post dummy with county demographic characteristics that are
likely to be correlated with customers’ willingness to punish firms for wrongdoing, controlling
number of competing brands remains negative and significant if we take the logarithm of the number of the
number of competing brands.
16
The reason why we cannot estimate the effect of having no competitor – in reality the most extreme case
of (monopolistic) market power – is due to the high-dimensional fixed effects that we employ. In particular,
we match control outlets to treated outlets based on month, six-digit NAICS industry, and ZIP code, so
including Lawsuit × ZIP code × six-digit NAICS industry × Month FEs leaves no variation in the treatment
variable within a lawsuit, ZIP code, six-digit NAICS industry, and month. The fact that we cannot estimate
the effect of having no competitor in the same lawsuit, ZIP code, six-digit NAICS industry, and month is
also the reason why we find a positive and significant coefficient on the two-way interaction between the
Treatment dummy and the Post dummy in Column 8. Technically, this coefficient captures the baseline effect
of having no competitor, but since this effect cannot be estimated econometrically, the coefficient estimate
is misspecified.
20for the impact of competition. As a first proxy for customers’ willingness to punish firms
for wrongdoing, we study religiousness in an outlet’s county. Prior literature shows that
religion affects various economic outcomes, including risk aversion (Noussair, Trautmann,
van de Kuilen, and Vellekoop, 2013), stock market participation (Hong, Kubik, and Stein,
2004), the propensity to gamble (Kumar, Page, and Spalt, 2011), and firm behavior (Hilary
and Hui, 2009). Results in Column 1 of Table 4 suggest that, controlling for the level of
competition, the adverse reputational effect of corporate misbehavior is larger in areas with
a more religious population. This finding implies that religiousness leads customers to hold
firms accountable to higher moral standards.
As another proxy for customers’ willingness to punish firms for wrongdoing, we study
counties’ social norms, as measured by the social capital index of Lin and Pursiainen (2020).17
The results are reported in Column 2. We find that stores located in counties with stronger
social norms experience a stronger reduction in customer visits. This finding is in line with
existing research arguing that high social capital imposes behavioral norms on managers
(Hasan et al., 2017; Hoi et al., 2019) as well as communities more generally (e.g., Buonanno,
Montolio, and Vanin, 2009), driven by a higher willingness to punish those who do not live
by the norms of the community (e.g., Bowles and Gintis, 2002).
As a final proxy for customers’ willingness to punish firms for wrongdoing, we consider
counties’ political orientation, as measured by the Republican vote share in the 2016 Presi-
dential election. Results in Column 3 show that stores located in counties that lean towards
the Republican party are more likely to be punished for wrongdoing. This result is con-
sistent with the notion that the Republican ideology favors individual accountability and
market discipline to punish corporate wrongdoing, while Democrats believe in government
intervention to manage corporate crime (e.g., Hutton, Jiang, and Kumar, 2015).
17
The index is based on principal component analysis of counties’ association density, regulated charitable
organization density, and voter turnout rate, following the methodology of Rupasingha, Goetz, and Fresh-
water (2006) and similar to the index used, for instance, in Hasan, Hoi, Wu, and Zhang (2017) and Hoi, Wu,
and Zhang (2019).
21As discussed above, the treatment timing in class action lawsuits is, by definition, some-
what noisy. To further address this issue, we conduct an additional robustness check analysis,
similar to Panel B of Figure 1, where we change the timing of treatment to be the beginning
of the class action period. This approximates the beginning of the actual misconduct by the
firm, instead of the filing of the lawsuit. We then repeat our main analysis of the effects of
competition on customer response.
The results shown in Table 5, are all qualitatively similar to our main results. However,
Column 1 shows that the average negative reaction, 9.7%, is somewhat larger using this
treatment timing than the filing date. Columns 2-4 show that the interactions with various
measures of competition look similar in this analysis as in our main results. The negative
reaction is significantly larger when the outlet faces more competition. These results show
that our conclusions are not sensitive to the definition of the treatment timing, although the
magnitude of the estimates is affected by it.
Taken together, the results in this section provide outlet-level evidence that customers
punish firms for corporate wrongdoing. This effect is strongly dependent on competition.
Outlets facing more competition experience significantly larger negative effects. Hence, the
ability of customers to punish firms for their wrongdoing critically hinges on the availability
of alternatives for customers. The effect of competition differs across geographic and industry
proximity, with more narrowly defined competition mattering more. It also robust to using
unique visitors or store closures, rather than visits, as the dependent variable. Moreover, the
effect varies across demographic characteristics of counties in which the outlets are located
and is more pronounced in counties with stronger social norms and values, as proxied with
religion, social capital, and political orientation. This suggests that the customer reactions
we observe are at least partly driven by moral considerations and not by concerns about
product or service quality, as these would likely affect all locations similarly.
225 Competition and stock market response to class ac-
tion lawsuits
In the previous section, we have shown – in a very granular outlet-level setting – that
customer’s ability to punish firms for misbehavior depends on the competitive environment.
We would therefore expect competition to also be a main driver of the stock market response
to filings of class action lawsuits. This section is dedicated to this conjecture. First, we
describe the sample used in this analysis. Next, we analyze the response of retail customers
to class action lawsuits. Third, we study the impact of competition on the shareholder value
response to class action lawsuits.
5.1 Descriptive statistics
Panel A of Table 6 reports descriptive statistics for the announcement return sample. The
sample of class action lawsuits underlying this analysis comprises 3,322 cases. A target
in a class action lawsuit on average competes with around 100 other firms within the same
six-digit NAICS industry in the quarter before the filing of the lawsuit. The average revenue-
based HHI calculated at the six-digit NAICS industry level for the firms in this sample is
0.3. Twelve-day CARs, computed from ten days before to one day after the filing of a class
action lawsuit, are highly negative, with a mean of -9.9% and a median of -3.8%. Prior
studies document similar, if not even more negative, stock price responses to filings of class
action lawsuits.18 Gande and Lewis (2009), for instance, find an average response of -14.5%
over the same twelve-day window using a sample of lawsuits filed between 1996 and 2003.
18
We follow Gande and Lewis (2009) and use an asymmetric twelve-day event window that covers ten
trading days before the filing date, the filing date, and the trading day after the filing date.
235.2 Results
To test whether the stock market response to filings of class action lawsuits are related to
the competitive environment of firms targeted by the lawsuits, we regress the twelve-day
CARs on various measures of competition. For each competition measure, we first estimate
a univariate regression and then rerun the regression augmented with a set of covariates
capturing lawsuit and firm characteristics as well as year fixed effects.19
The results are reported in Panel B of Table 6. As our first measure of competition, we
use a revenue-based HHI computed at the six-digit NAICS level. Results in Column 1 show
that firms active in a less competitive market have significantly higher (i.e., less negative)
abnormal returns around the filing of a class action lawsuit. Specifically, an increase in the
HHI by one standard deviation results in one percentage point lower cumulative abnormal
returns. Results reported in Column 2 suggest that adding control variables leaves the
coefficient and significance level almost unchanged. As a second measure of competition, we
use the number of other firms active in the same six-digit NAICS industry. The results are
reported in Columns 3 and 4 and show that the more competition a targeted firm faces, the
more negative the market reacts to the filing of a class action lawsuit.20 The third measure of
competition is a dummy variable that is equal to one for firms without any competitor in the
six-digit NAICS industry, implying monopolistic market power. Results in Columns 5 and 6
show a positive and significant coefficient on the dummy variable indicating no competition.
The coefficient estimates suggest that returns around filings of class action lawsuits are 4.8%
or 4.2% higher (i.e., less negative, as the constant is -10.0% and -8.8%, respectively) for firms
without a competitor.
The control variables added to the specifications reported in the even columns obtain
loadings as expected from prior research. The dummy variable indicating whether class
19
Table A.4 presents the number of filings by calendar year and month.
20
The coefficient on the number of competing firms remains negative and significant if we do a log-
transformation of this variable.
24action lawsuit turns out to the be settled obtains a negative and highly significant coefficient.
The coefficient estimate suggests that settled cases, on average, have -7.2% lower returns
around the filing date as do cases that will be dismissed. This suggests that investors are
able to gauge the merit of lawsuits at the filing date (Griffin, Grundfest, and Perino, 2004;
Kempf and Spalt, 2020). Firms with higher market-to-book ratios, a proxy for growth
opportunities, and firms with less property plant and equipment as a fraction of total assets,
a proxy for the asset intensity, also have significantly more negative abnormal returns. This
is consistent with a growing literature showing that firms with valuable innovation output
are particularly vulnerable to class action litigation (Lin et al., 2020; Kempf and Spalt, 2020).
Results in this section show that competition in firms’ product markets is a key deter-
minant of the stock market response to filings of class action lawsuits. Hence, the results
in this section support our previous results from the outlet-level analysis, suggesting that
competition is an important component in customers’ ability to discipline firms for misbe-
havior. Moreover, these results imply that the stock market reaction reflects the benefits of
a concentrated market structure in impeding customers’ ability to discipline a firm when a
class action lawsuit is filed. This suggests that investors consider the effects of concentration
when assessing the value impact of lawsuits.
6 Competition and revenue response to class action
lawsuits
Our analysis in Section 4, based on very granular outlet-level data, is restricted to 29 class
action lawsuits filed after February 2018. To confirm that our results on customer visits are
not confined to the sample of class action lawsuits that overlaps with the SafeGraph data,
we perform an analysis of quarterly accounting revenues using a comprehensive sample of
class action lawsuits filed since 1996. In this section, we first describe the sample used in
this analysis. Next, we analyze the change in quarterly accounting revenues, our proxy for
25You can also read