Comparison of Neural Network Methods for Classification of Banana Varieties (Musa Paradiasaca)
←
→
Page content transcription
If your browser does not render page correctly, please read the page content below

Jurnal Rekayasa Elektrika Vol. 17, No. 2, Juni 2021, hal. 123-128                                                          123
ISSN. 1412-4785; e-ISSN. 2252-620X, Terakreditasi RISTEKDIKTI No. 30/E/KPT/2018
DOI: 10.17529/jre.v17i2.20806

           Comparison of Neural Network Methods
            for Classification of Banana Varieties
                     (Musa Paradiasaca)
        Zilvanhisna Emka Fitri1, Wildan Bakti Nugroho1, Abdul Madjid2 and Arizal Mujibtamala Nanda Imron3
                     1
                       Teknik Informatika, Jurusan Teknologi Informasi, Politeknik Negeri Jember
               2
                Budidaya Tanaman Perkebunan, Jurusan Produksi Pertanian, Politeknik Negeri Jember
                                         Jl. Mastrip PO.BOX 164 Jember, 68121
                              3
                                Teknik Elektro, Jurusan Teknik Elektro,Universitas Jember
                                Jl. Kalimantan No. 37, Kampus Tegalboto, Jember, 68121
                                             e-mail: zilvanhisnaef@polije.ac.id

     Abstract—Every region in Indonesia has a massive diversity of banana species, but no system records information
     about the characteristics of banana varieties. This research aims to make an encyclopedia of banana types that can
     be used for learning by classifying banana varieties using banana images. This banana variety classification system
     uses image processing techniques and artificial neural network methods as classification methods. The varieties of
     bananas used are Merah bananas, Mas Kirana bananas, Klutuk bananas, Raja bananas and Cavendis bananas.
     The parameters used are color features (Red, Green, and Blue) and shape features (area, perimeter, diameter,
     and fruit length). The intelligent system used is the backpropagation method and the radial basis function neural
     network. The results showed that both approaches could classify banana varieties with an accuracy rate of 98% for
     Backpropagation and 100% for the radial basis function neural network.

     Keywords: banana varieties, digital image processing, backpropagation, radial basis function neural network

     Abstrak—Setiap daerah di Indonesia memiliki keanekaragaman jenis pisang yang sangat banyak, namun belum
     ada sistem yang mencatat informasi tentang ciri-ciri varietas pisang. Tujuan dari penelitian ini adalah membuat
     ensiklopedia jenis pisang yang dapat digunakan untuk pembelajaran dengan cara mengklasifikasikan varietas
     pisang menggunakan citra pisang. Sistem klasifikasi varietas pisang ini menggunakan teknik pengolahan citra dan
     metode jaringan saraf tiruan sebagai metode klasifikasi. Jenis pisang yang digunakan adalah pisang merah, pisang
     Mas Kirana, pisang Klutuk, pisang Raja dan pisang Cavendis. Parameter yang digunakan adalah fitur warna (Red,
     Green dan Blue) dan fitur bentuk (luas area, perimeter, diameter dan panjang buah). Sistem cerdas yang digunakan
     adalah metode backpropagation dan radial basis function neural network. Hasil penelitian menunjukkan bahwa
     kedua metode tersebut mampu mengklasifikasikan varietas pisang dengan tingkat akurasi sebesar 98% untuk
     Backpropagation dan 100% untuk radial basis function neural network.

     Kata kunci: varietas pisang, pengolahan citra digital, backpropagation, radial basis fuction neural network

                   I.    Introduction                             nagka bananas, tanduk bananas and kapok bananas; 3)
                                                                  banana seeds, namely M. brachycarpa which in Indonesia
   Banana (Musaa spp.) is an herbaceous fruit plant that          is used for its leaves, for example batu bananas and klutuk
is easy to find, there are many varieties and the price is        bananas; 4) bananas are taken for fiber, for example manila
very affordable and comes from regions in Southeast               bananas [2]. According to Badan Pusat Statistik (BPS)
Asia including Indonesia [1]. Bananas are divided into            data, there has been an increase in banana production in
four groups based on the types of varieties and their uses,       East Java Province from 2015 to 2019. Total production
namely: 1) bananas that are eaten without cooking, namely         in 2015 was 1,629,437 tons and total production increased
M. paradisiaca var sapientum, M. nana or also known as            by 2,116,974 tons in 2019, with a percentage growth of
M. cavendishii, M. sinensis, for example ambon bananas,           2.77% in 2018-2019 [3].
susu bananas, raja bananas, cavendis bananas, barangan               Every region in Indonesia has many varieties of bananas,
bananas and mas bananas; 2) bananas that are eaten after          giving rise to diversity of banana varieties. However,
the fruit is cooked, namely M. paradisiaca forma typica           there is no system that records information regarding the
or also known as M. paradisiaca normalis, for example             characteristics of banana varieties. The purpose of this

Received 20 April 2021; Revised 25 May 2021 ; Accepted 03 June S2021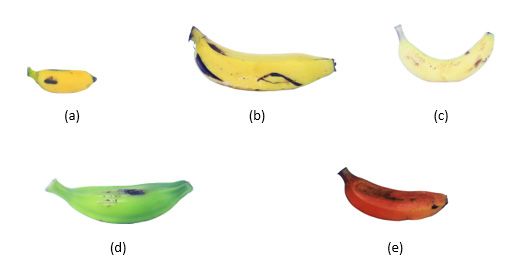
124                                                                         Jurnal Rekayasa Elektrika Vol. 17, No. 2, Juni 2021

research is to make an encyclopedia about the kinds of          namely the cropping process which functions to speed up
banana varieties that can be used for learning about the        the computation process. Second, the process of solving
types of bananas through their pictures. This encyclopedia      RGB colors is carried out, this is because the RGB color
can classify types of bananas through photos of banana          image is difficult to segment [10], [11]. The RGB color
fruit, it is hoped that people who do not understand the        space consists of three color components, namely red,
types of bananas can be helped. Besides bringing up             green and blue components, each of these components has
the classification of banana types, there is also a brief       a value range of 8 bits so that the RGB color space has
explanation of their characteristics, both in terms of taste,   a value of 24 bits and this value is very large [12] and
size and others.                                                of course makes the computational load high, so that the
   Research related to bananas has been carried out, the        image with the RGB color space should be converted to
topics that are mostly researched are identification of the     another color space before the segmentation process is
level of maturity and identification of the type of banana.     carried out. After the preprocessing stage, the stages are
The focus of this research is on the classification of types    divided into two, namely the extraction of the RGB color
or varieties of bananas, so here are some references that       features and the color conversion process to the HSV color
we use in this study. First, Ten classes of bananas were        space (third stage). The fourth stage is after the conversion
classified, namely Mas bananas, Barangan bananas,               process of the color to the HSV color space is carried out,
Merah bananas, Susu bananas, Tanduk bananas, Kepok              then the image segmentation process is carried out which
bananas, Batu bananas, Awak bananas, Raja bananas and           aims to separate the object and the background. Fifth,
Ambon bananas with a system accuracy rate of 80% using          we get the parameters which will be carried out by the
the K - Nearest Neighbor (KNN) method [4]. Second, the          morphological feature extraction. Sixth, a classification
KNN method is still used in this study but the HSV color        process is carried out using the backpropagation method
parameter in classifying five types of bananas (Ijo bananas,    to classify banana varieties into five classes based on color
Sobo Pipit bananas, Tandes bananas, Raja Uli bananas and        and morphological features, this stage is shown in Figure
Raja bananas) with an accuracy rate of 82% [5]. Third, the      1.
identification system for Muli bananas, Ambon bananas,
and Kepok bananas with features used, namely weight,
volume, area, roundness, Red (R), Green (G), Blue (B)
and diameter with a system accuracy level of 100% using
a neural network model (backpropagation) [6]. Fourth,
the backpropagation method is also used to identify Lilin
bananas, Mas Kirana bananas and Raja Sereh bananas
with an accuracy level of 100% of the training results, and
testing of 80% of training data of 50 banana images and
test data of 30 banana images .
   Based on the above references, the backpropagation
method is able to classify banana varieties better than the
K-nearest neighbor method so that the researchers use the
backpropagation method to identify other banana varieties
such as Kirana Mas bananas, Raja bananas, Klutuk bananas,
red bananas and Cavendis bananas. In this research using
a different image processing techniques with the previous
research [6], [7] on segmentation and feature extraction
process used. This research also compares the effectiveness
of the backpropagation method with other artificial neural
network methods such as the Radial Basis Neural Network
(RBFNN) for classifying banana varieties. The RBFNN
method was chosen because RBFNN is able to classify
welding defect images with an accuracy rate of 91.67% [8]
and able to classify shallots and onions with an accuracy
rate of 100% on 100 test data images[9].

                      II.   Methods

   In this study, four varieties of bananas were used,
namely Merah bananas, Mas Kirana bananas, Klutuk
bananas, Raja bananas and Cavendis bananas. There are
six stages in classifying varieties of bananas. First, the
banana image sample is carried out a processing process,              Figure 1. The block diagram of the classification system
Zilvanhisna Emka Fitri et. al.: Comparison of Neural Network Methods for Classification of Banana 125
Varieties (Musa Paradiasaca)
The main purpose of the segmentation stage is to
separate the object from its background [13], this process
is also often called the thresholding process. This process
produces a binary image that has two values, “0” for the
black region and “1” for the white region as follows:
0 if f ( x, y ) < T
S ( x, y ) = (1)
1if f ( x, y ) ≥ T
where f (x,y) is the gray value at a pixel coordinate, T is the
threshold value determined from the histogram analysis
Figure 2. Banana varieties (a) Mas Kirana bananas, (b) Raja bananas, (c) and S (x,y) is the binary value of the segments result at a
Cavendis bananas, (d) Klutuk bananas, and (e) Merah bananas pixel coordinate.
A. Sample image of banana F. Feature extraction
In the initial stage, the researchers bought bananas Feature extraction used in this study consists of color
from banana sellers in the fruit market and were randomly feature extraction and morphological feature extraction.
selected without considering the size of the bananas. Then This is because the obtained two characteristics that can
the image is taken using a mini studio box and a DSLR distinguish five varieties of bananas.
camera with a resolution of 18 MP so that the data we use
in this study is the researchers' private dataset. The data G. Classification
used consisted of five classes, Merah bananas, Mas Kirana
bananas, Klutuk bananas, Raja bananas and Cavendis Backpropagation is an artificial neural network method
bananas as shown in Figure 2. which is divided into two stages, namely the training
stage and the testing stage. backpropagation training
B. Image cropping methods including supervised learning [13]. Supervised
learning is a learning model in which the data already
Banana sample image with initial size of 5184 x 3456 has a target, if the classification results do not match the
pixels. The next step is to crop the image to a smaller 612 predetermined target, the weight will be updated in each
x 408 pixels. The cropping process aims to reduce the hidden layer. Updates the weights are expected to improve
computational burden. the accuracy of the system [11], [14]. However, apart from
using the backpropagation method, the researcher also
C. Solving of RGB values made comparisons with other neural network methods,
for example the Radial Basis Function Neural Network
The next stage is the process of solving the RGB (RBFNN).
components, aiming to find the RGB components that best The fundamental difference between the two methods
represent the object under study. The process of solving lies in the activation function of the hidden layer. MLPNN
the RGB components is shown in Figure 3 uses the sigmoid activation function while RBFNN uses
Gaussian activation function as follows:
D. Conversion to the HSV color space h( x) = (
∅ ( x − c ) R −1 ( x − c )
τ
) (2)
The RGB color space is difficult to segment so that the
color conversion process is carried out to another color III. Results and Discussion
space, for example HSV. In addition, the HSV color space
is a color space whose model is close to that of human In this research, image processing techniques
vision. specifically the segmentation process plays an important
role the successful classification of varieties of bananas.
E. Segmentation Before performing the segmentation process, a color
conversion process is carried out from the RGB color
space to the HSV color space. The HSV color space has
a model similar to that of human vision. After the HSV
color conversion process is carried out, then the HSV
component is resolved to determine the component image
that best represents the research object as shown in Figure
4.
(a) (b) (c) (d) Figure 4 shows that the image that best represents
Figure 3. (a) Original image, (b) Red component image, (c) Green banana objects is the saturation component image where
component image and (d) Blue component image the object and the background are clearly visible in color126 Jurnal Rekayasa Elektrika Vol. 17, No. 2, Juni 2021
difference, while the hue component image of the object Table 1. The results of the image segmentation based on the variation in
tends to be darker towards the background. This also the threshold value (T)
applies to the value component image; the object has a
No Threshold Value(T) Image Segmentation Results
value that is close to the background or value 1 (white).
The next process is the segmentation process which 1. 0.1
converts the saturation component image into a binary
image using the equation formula 1. The threshold value
(T) is determined by several values, namely 0.1 to 0.7 and 2. 0.2
the results are shown in Table 1.
Table 1 shows that the 0.1 and 0.2 threshold values of the
segmentation image results are similar but some images do 3. 0.3
not show this so that the best threshold value is 0.1, while
at the threshold value of 0.3 to 0.7 the detected objects are
less and less perfect (intact). This is because some banana 4. 0.4
images have dark areas so that during the segmentation
process the area value is smaller than the threshold value
(T) so that during the segmentation process it will become
a black image (0). 5. 0.5
The next process is the feature extraction process
which aims to take the characteristic value of the object
so that this value becomes the determining parameter
for classifying banana varieties. There are 7 features 6. 0.6
consisting of three-color features (Red, Green and Blue)
The color components Histogram results
7. 0.7
and four morphological features (area, perimeter, length
and diameter). An example of the value of feature
extraction is shown in Table 2.
Based on Table 2, it can be concluded that the perimeter
parameter obtained values that are close to each other
Hue component
between the classes of raja banana, klutuk banana and
merah banana. These parameters are part of the seven
parameters used in the classification, so that 91.42% of
the parameters are not close to each other. Based on this
analysis, to classify banana varieties, it is enough to use
general classification methods such as backpropagation
and Radial Basis Function Neural Network. It is also
different if the parameters of each class are close together,
so it requires an advanced classification method.
The classification method used is backpropagation and
Saturation component radial basis function. The process of selecting training data
and testing data is carried out randomly with the following
Table 2. The results of the feature extraction of banana varieties
Feature Mas Kirana Raja Klutuk Merah Cavendis
Red 251 245 232 235 251
Green 249 237 244 222 250
Blue 243 211 225 219 240
Area 4051 14820 11362 10832 7274
Value component Perimeter 303 589 550 508 439
Length 116 235 218 199 173
Figure 4. The difference in the image results of the HSV component is
based on the results of the image histogram Diameter 39 71 63 60 42Zilvanhisna Emka Fitri et. al.: Comparison of Neural Network Methods for Classification of Banana 127
Varieties (Musa Paradiasaca)
Table 3. The results of system accuracy in the training process based on Table 5. Confusion matrix for the RBFNN training method
variations in the learning rate (α)
Output class
Variation of learning rate Accuracy (%) Target class
a b c d e
0.1 99.76
100 0 0 0 0 a = Klutuk
0.3 100
0 100 0 0 0 b = Mas
0.5 100
0 0 100 0 0 c = Merah
2 0 3 95 0 d = Raja
Table 4. Results of system testing accuracy based on variations in
learning rate (α) 0 0 0 0 20 e = Cavendis
Learning rate Accuracy (%)
Table 6. A comparison of the system accuracy between the
0.1 96 backpropagation method and the radial basis function method.
0.3 88
Training Testing Accuracy
0.5 98 Method
Accuracy (%) (%)
Backpropagation 100 98
conditions: 420 data is used for the training process and 50
Radial Basis Function 98.81 100
data is used for the testing process. In the training process,
the maximum number of iterations (epoch) is used of 500
with an error of 0.00000001. There is no limit regarding IV. Conclusion
the amount of image data and the maximum iteration used
in the training process because the principle of computer Based on the above research results, it can be concluded
vision is that the more image data and iterations used in the that the digital image processing process plays an important
training process, the system will be better at recognizing role in the classification process of banana varieties. There
the pattern of the image. So, it is expected that the system are two very important stages in digital image processing.
will get better at distinguishing images in each class. The first, the image segmentation process which aims to
following are the results of the level of accuracy and the separate the research object from the background so that
number of system training iterations based on the variation it will facilitate the feature extraction process. second, the
of the learning rate (α) as shown in Table 3. The number feature extraction process which aims to extract the unique
of test data is 50 and the accuracy results of system testing characteristics of each banana variety for the classification
are shown in Table 4. process.
Table 4 shows that the test results from the test data To be able to be applied in real terms in the community,
get the highest accuracy of 98%. The data consisted of 50 it is necessary to carry out further research by increasing
banana data divided into 5 classes, each class containing the number of other banana varieties.
10 banana data. The lowest accuracy obtained from the
testing process is 88%.
Reference
In this study, a comparison was made to other neural
network methods such as the Radial Basis Function Neural [1] Suyanti dan A. Supriyadi, Pisang, Budi Daya, Pengolahan, dan
Network. The results of the system testing accuracy Prospek Pasar, XIX. Jakarta: Penebar Swadaya, 2008.
resulting from the RBFNN method are 98.81% based on [2] Kementerian Pertanian, Outlook Komoditas Pertanian Sub Sektor
the confusion matrix calculation shown in Table 5. Hortikultura Pisang. Jakarta: Pusat Data dan Sistem Informasi
Pertanian Kementerian Pertanian, 2016.
Table 5 shows that in the Pisang Raja class, the total
number of training data is 100 data, but during the training [3] Badan Pusat Statistik dan D. J. Hortikultura, “Produksi Pisang
process the class was recognized as a pisang raja class Menurut Provinsi , Tahun 2015-2019,” Jakarta, 2019.
with as many as 95 data and incorrectly recognized as [4] C. P. Iklima dan M. Nasir, “Klasifikasi jenis pisang menggunakan
a pisang Merah class with 3 data and 2 data as a pisang metode k- nearest neighbor (KNN),” J. Teknologi Rekayasa
Informasi dan Komputer., vol. 1, no. 1, hal. 11–14, 2017.
Klutuk class. The accuracy of the system in the process of
testing of 100%. [5] Z. D. Lestari, “Sistem Klasifikasi Jenis Pisang Berdasarkan Ciri
Warna HSV Menggunakan Metode K-NN,” Seminar Nasional
The difference between the accuracy of the system in Teknologi Informasi dan Komunikasi., hal. 11–15, 2019.
the process of training and testing can occur, because
there is a difference of data on the training and testing [6] R. A. Pangestu, “Identifikasi Buah Pisang Berdasarkan
Karakteristik Morfologi Buah dengan Metode Jaringan Syaraf
process. Based on Table 2, several parameters in the Tiruan,” thesis, Universitas Lampung, 2019.
pisang raja, pisang Merah and pisang Klutuk classes have
[7] L. R. Krisnadi, “Identifikasi Pisang Lilin, Mas Kirana dan Raja
close ranges of values, so it is possible for the system to Sereh Menggunakan Jaringan Syaraf Tiruan,” thesis, Universitas
misclassify the pisang raja class into another class. Table Panca Marga Probolinggo, 2019.
6 shows a comparison of the system accuracy between
[8] N. Rinanto, M. T. Wahyudi, dan A. Khumaidi, “Radial basis
the backpropagation method and the radial basis function function neural network sebagai pengklasifikasi citra cacat
method. pengelasan,” Rekayasa, vol. 11, no. 2, hal. 118, 2018, doi:128 Jurnal Rekayasa Elektrika Vol. 17, No. 2, Juni 2021
10.21107/rekayasa.v11i2.4418. 10.1088/1742-6596/1201/1/012049.
[9] Agusriandi, Elihami, dan W. Widiawati, “Identifikasi bawang [12] Z. E. Fitri, U. Nuhanatika, A. Madjid, dan A. M. N. Imron,
merah dan bombay dengan pendekatan radial basis function “Penentuan tingkat kematangan cabe rawit (capsicum frutescens
neural network (RBFNN),” J. Media Informatika Budidarma, vol. L.) berdasarkan gray level co-occurrence matrix,” J. Teknol.
4, hal. 1043–1050, 2020, doi: 10.30865/mib.v4i4.2334. Inf. dan Terap., vol. 7, no. 1, hal. 1–5, 2020, doi: 10.25047/jtit.
v7i1.121.
[10] Z. E. Fitri, I. K. E. Purnama, E. Pramunanto, dan M. H. Purnomo,
“A comparison of platelets classification from digitalization [13] Z. E. Fitri, R. Rizkiyah, A. Madjid, dan A. M. N. Imron,
microscopic peripheral blood smear,” 2017 Int. Semin. Intell. “Penerapan neural network untuk klasifkasi kerusakan mutu
Technol. Its Appl. Strength. Link Between Univ. Res. Ind. to Support tomat,” J. Rekayasa Elektr., vol. 16, no. 1, hal. 44–49, 2020, doi:
ASEAN Energy Sect. ISITIA 2017 - Proceeding, vol. 2017-Janua, 10.17529/jre.v16i1.15535.
hal. 356–361, 2017, doi: 10.1109/ISITIA.2017.8124109.
[14] Z. E. Fitri, A. Baskara, M. Silvia, A. Madjid, dan A. M. N. Imron,
[11] A. M. Nanda Imron dan Z. E. Fitri, “A classification of platelets “Application of backpropagation method for quality sorting
in peripheral blood smear Image as an early detection of classification system on white dragon fruit ( Hylocereus undatus
myeloproliferative syndrome using gray level co-occurence ),” IOP Conf. Ser. Earth Environ. Sci., vol. 672, no. IT Agriculture,
matrix,” J. Phys. Conf. Ser., vol. 1201, no. 1, 2019, doi: hal. 1–6, 2021, doi: 10.1088/1755-1315/672/1/012085.You can also read