Commerzbank and ODDO BHF German Investment Seminar - K+S Aktiengesellschaft - CEO
←
→
Page content transcription
If your browser does not render page correctly, please read the page content below

January 11, 2022

K+S Aktiengesellschaft
Commerzbank and ODDO BHF
German Investment Seminar

Dr. Burkhard Lohr        Julia Bock, CFA
CEO                      Head of Investor Relations
Disclaimer
    No reliance may be placed for any purpose whatsoever on the information or opinions contained in the Presentation or on its completeness, accuracy of
    fairness. No representation or warranty, express or implied, is made or given by or on behalf of the Company or any of its respective directors, officers,
    employees, agents or advisers as to the accuracy, completeness or fairness of the information or opinions contained in the Presentation and no
    responsibility or liability is accepted by any of them for any such information or opinions. In particular, no representation or warranty, express or implied,
    is given as to the achievement or reasonableness of, and no reliance should be placed on any projections, targets, ambitions, estimates or forecasts
    contained in this Presentation and nothing in this Presentation is or should be relied on as a promise or representation as to the future.

    This presentation contains facts and forecasts that relate to the future development of the K+S Group and its companies. The forecasts are estimates
    that we have made on the basis of all the information available to us at this moment in time. Should the assumptions underlying these forecasts prove
    not to be correct or should certain risks – such as those referred to in the Annual Report – materialize, actual developments and events may deviate
    from current expectations. Given these risks, uncertainties and other factors, recipients of this document are cautioned not to place undue reliance on
    these forecasts.

    This Presentation is subject to change. In particular, certain financial results presented herein are unaudited, and may still be undergoing review by the
    Company’s accountants. The Company may not notify you of changes and disclaims any obligation to update or revise any statements, in particular
    forward-looking statements, to reflect future events or developments, save for the making of such disclosures as are required by the provisions of statue.
    Thus statements contained in this Presentation should not be unduly relied upon and past events or performance should not be taken as a guarantee or
    indication of future events or performance.

    This presentation has been prepared for information purposes only. It does not constitute an offer, an invitation or a recommendation to purchase or sell
    securities issued by K+S Aktiengesellschaft or any company of the K+S Group in any jurisdiction.

2
What happened 2021?

          Strong increase in potash                                                                 New strategy announced
                                                         Grow the core
          prices                                                              10%
                                                                                                    ▪    Potash and magnesium is core
                                                Optimize the        20%
          ▪   MOP gran. BR more than            existing                     New business           ▪    ROCE>WACC over cycle of 5 years
              tripled from 250$/t to                      70%                areas
              800 $/t in 2021                                                                       ▪    EBITDA margin of > 20% over cycle
          ▪   MOP gran. Europe rose
                                                                          Climate strategy          ▪    Positive FCF from 2023 even in the
              from 230 €/t to 600 €/t                                                                    event of low potash prices
                                                                         Sustainability goals
          ▪   EBITDA and FCF outlook                                                                ▪    Bethune and Zielitz with cost leader-
              increased 3 times                                                                          ship focus, Werra and Neuhof spe-
                                                                                                         ciality sites with optimized portfolio

          Sale of the Americas                                                                  Closing of REKS joint venture
          operating unit                                                                        ▪       Closing completed on Dec. 22
          ▪   Closing completed on April 30                                                     ▪       one-off gain
          ▪   Net proceeds ~ €2.6 billion                                                               (+ ~ €200m EBITDA)
          ▪   Book gain ~ €742 million                                                          ▪       cash inflow
                                                                                                        (+ ~ €90m before taxes)
          ▪   Financial debt reduced
              significantly by ~ €2.1 billion

3
Rapid Debt Reduction and Value Generation

                           Sale of the Americas operating unit
                           ▪ Closing completed on April 30
                           ▪ Net proceeds ~ €2.6 billion
                           ▪ Book gain ~ €742 million

                           Financial debt reduced significantly by
                           ~ €2.1 billion
                           ▪ > €1 billion credit facilities, promissory notes,
                              commercial papers
                           ▪ Successful buy-back of bonds ~ €560 million
                           ▪ Regular bond repayment ~ €450 million
                           ▪ KfW facility terminated (has never been drawn)

                           Balance Sheet streamlined
                           ▪ Net Financial Debt / EBITDA 2.0x
                           ▪ Equity Ratio ~ 48%

4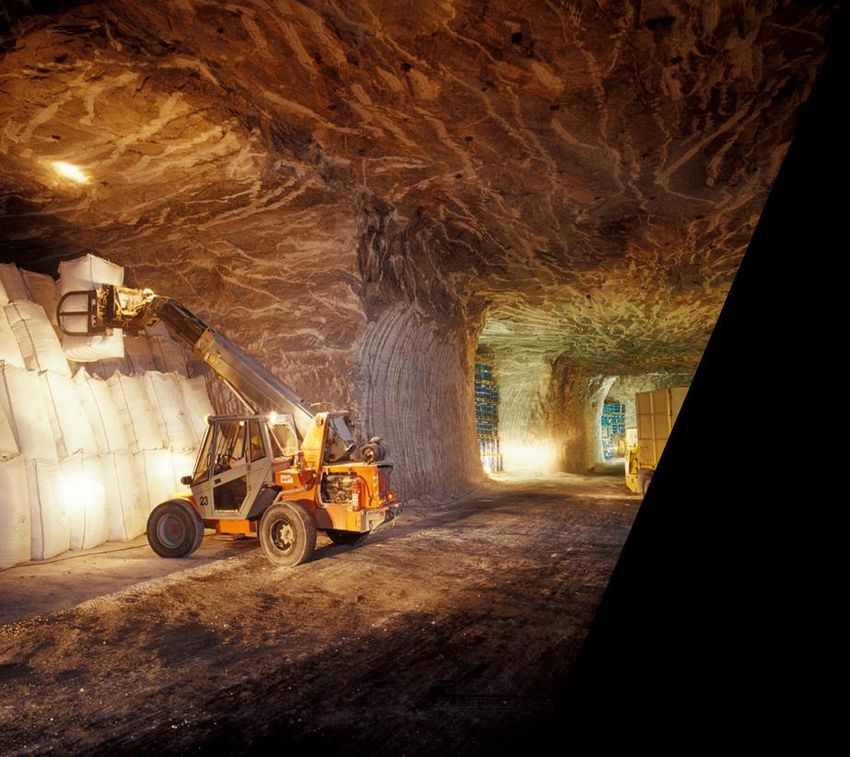
REKS – transaction successfully completed in 2021

                          ▪   On December 1, 2021, the German
                              Federal Cartel Office (“Bundeskartellamt“)
                              granted clearance for REKS joint venture.
                          ▪   Closing of the transaction between K+S
                              and REMEX took place on December 22,
                              2021:
                              ✓ one-off gain (+ ~ €200m EBITDA) and
                              ✓ cash inflow (+ ~ €90m before taxes)
                                generated in 2021.

5
EBITDA more than quadrupled in Q3 2021
Continuing operations

          Revenues Q3                                         EBITDA Q3                            Agriculture
             - in € million -                                  - in € million -                    ▪ ASP: 300 €/tonne (Q3/20: 238 €/tonne)
                                                                                                   ▪ Sales volume: 1.76 mt (Q3/20: 1.66 mt)

                  +31%                                             +382%
                                                                                                   Industry+
                           746                                                                     ▪ Normalized demand
                                                                            121                    ▪ Good early fills season with
           566                                                                                       de-icing salt
                                                                                                   ▪ Sales volume: 1.73 mt (Q3/20: 1.35 mt)

                                                              25
                                                                                                   Free cash flow
                                                                                                   ▪ € -69 million (Q3/20: € -42 million)
          Q3/20           Q3/21                           Q3/20*            Q3/21

6   * benefitted from positive non-cash, one-off effect of € 56 million related to the preparation of the REKS transaction
Q3/21 EBITDA more than quadrupled YoY
    Highlights                                                                                        Financials (continuing operations)
▪ Q3/21 EBITDA increased to €121m (Q3/20: €25m, excluding
     positive non-cash, one-off effect of € 56 million)                                               € million                      Q3/2020   Q3/2021   %

▪ COVID-19: Minor efficiency losses on the previous year’s Q3 level                                   Revenues                          566        746       +32

▪ Adj. net profit positive at €1.285m (Q3/20: €-1,757m); thereof                                        t/o Agriculture                 373        529       +42
     €1,420m (Q3/20: €-1,792m) related to value fluctuations in PPE                                     t/o Industry+                   193        217       +12
                                                                                                      D&A                                87         74       -15
    EBITDA in €m                                                                                      EBITDA                             25*       121   +384
                                                             -7
                                          28                                                          Adj. net profit                 -1,757     1,285        −

                                      +Higher                                 -57                       t/o reversal of impairment
                                                                                                                                      -1,792     1,420        −
                                       potash and                                                       losses on assets
                                       de-icing                                                       Adj. EPS (€)                     -9.18      6.71        −
                                       sales                            - Higher costs:
                                       volumes                            (freight, energy,             t/o reversal of impairment
                       132                                                raw material)                 losses on assets
                                                                                                                                       -9.35      7.42        −
                                                                        + Cost discipline

       56
                                                                        + Restructuring
                                                                          headquarters
                                                                                              121     Operating cash flow                58         14       -24

                                                                                                      Adj. FCF                           -42       -69       -64
                   + Mainly pricing                                                                   Capex                              114        88       -23
       25*          Agriculture
       Q3/20           Pricing          Volume               FX              Others           Q3/21   NFD/EBITDA (LTM)*                 5.7x      2.0x        −

           * excluding positive non-cash, one-off gain of €56 million
7
Affordability concerns? Farm economics still attractive!
Futures, indexed, Bloomberg, as of 4 November 2021                    U.S. Corn Farmer Profitability Outlook per acre*
    300%

    275%

    250%

    225%

    200%

    175%

    150%

    125%
                                                                       U.S. Soybean Farmer Profitability Outlook per acre*
    100%

    75%

    50%

            Wheat           Soybean                  Corn   Palmoil

    → While farmer profitability is expected to decline in 2022 after the post-record level of 2021, mainly due
      to higher input costs, it should still be at an attractive level compared to recent years.
8     *Source: Scotiabank
New potash capacities necessary to meet rising demand
    thousand tonnes

    120,000

    100,000
                                                                                                                                                           +3.0% (Upside scenario)

                                                                                                                                                           +1.6% (IFA prognosis)
     80,000

     60,000

     40,000

     20,000

          ,0
               '00                        '05                         '10                          '15                         '20   '25e           '30e

                               Nameplate capacity                                                  New capacities                    Short supply

                              Global sales volume                                                  Production

9      Source: IFA, K+S; including potassium sulfate and potash varieties with a lower K 2O content of about 5 million tonnes eff.
Agriculture customer segment in Q3/21
                                                                                                         Q3/2021
USD/t                                                                                            EUR/t
                                                                                                         • Price hike in Brazil continued
                                                                                                           on the back of very strong
850                                                                                                800
800
                                                                                                           demand
750                                                                                                700   • Concerns about supply due to
700              Potassium                                                                                 US sanctions against Belarus
650               Sulfate                                         Potassium
                                                                                                   600
600
                   (SOP)                                           Chloride                              • Positively influenced European
                  Europe                                         (MOP) Brazil
550                                                                                                        and specialty market
                                                                                                   500
500
450
                                                                                                   400
                                                                                                         Outlook 2021
400
350
                                                                Potassium
                                                                 Chloride
                                                                                                         • World potash sales incl.
300
                                                              (MOP) Europe                         300     5 mt specialties meanwhile
250                                                                                                        expected slightly above last
200                                                                                                200     year’s record level (2020:
                                                                                                           about 76 mt), further growth
               MOP gran. Brazil USD/t, cfr (left scale)
                                                           SOP Europe EUR/t, cfr (right scale)             limited by supply
               MOP gran. Europe EUR/t, cfr (right scale)                                                 • FY ASP expected tangibly
                                                                                                           higher than 9M/21
      Source: FMB Argus Potash
 10
Q3 trading update: Industry+
De-icing salt business
▪ Strong performance in Q3
▪ Good early-fills business
Pharmaceutical industry
▪ Increase after COVID-19-related declines in previous year
Food service
▪ Still burdened by COVID-19-effects
Chemical industry
▪ Increase after COVID-19-related declines in previous year, higher prices for industrial potash
Consumer products
▪ Normalization after strong prior quarter benefitting from increased home consumption
112021 EBITDA outlook raised to €830 million
▪ Significantly higher average price in
EBITDA in €m
continuing operations ~830 Agriculture product portfolio
+ REKS
(~200) ▪ Sales volume in the Agriculture
customer segment expected to be
- Higher freight
costs >7.5 million tonnes
- Higher energy
costs (2020: 7.3 million tonnes)
267* - Others
~630
+SG&A
restructuring ▪ Sales volumes in de-icing salt
250 business: >2.6 million tonnes
expected (2020: 0.9 million tonnes;
2020 Pricing Volume De-icing Costs, FX, 2021e normal year: 2-2.5 million tonnes)
Agriculture Agriculture business others
FCF including cash-in from sale of the OU Americas
expected significantly above €2 billion;
excluding this, FCF now expected slightly positive in
2021 (2020: €-109.9 million)
* without one-off effects
12Sneak preview 2022
Cost inflation included:
− freight rates, especially containers
▪ EBITDA of €1 billion in reach − gas prices/energy costs
− price of raw materials, e.g. for pallets,
▪ Significantly positive FCF packaging or maintenance material, also
influencing capex
− personnel costs
13Our new dividend policy
Current situation: Discretionary
premium
▪ Still high environmental expenditures upon balance
sheet structure,
▪ K+S still in restructuring phase
outlook etc.
Considerations:
▪ Shareholders should participate in K+S’s success through attractive dividend
▪ Strategic measures aimed at increasing total shareholder return
▪ The dividend policy is intended to: Base
dividend:
... provide continuity for shareholders
0.15 € / share
... be easy to understand and clearly communicable
... adequately signal and take into account the future years of ongoing restructuring
... demonstrate a disciplined capital deployment policy
14Strategic financial targets
MOP gran. bulk CFR Brazil price development
USD/t
1200
1000 1. ROCE: above cost of capital
through the cycle (WACC
800
2020: 9.4%)
600
400 2. EBITDA margin: at minimum
200 20% through the cycle
0
3. Free cash flow: positive free
cash flow even with
Key figures through cycles (low to low, calculated in full years) since 2004 temporarily low potash prices
Cycle 2004-2006 2007-2010 2011-2013 2014-2016 2017-2020 and green winters as of 2023
Ø ROCE (%) 18.5 27.4 20.1 9.4 2.7
Ø WACC (%) 6.5 10.1 8.5 8.3 8.7 Base for the financial targets is
Δ ROCE-WACC 12.0 17.3 11.6 1.1 -6.0 a solid balance sheet / solid
Ø EBITDA margin (%) 13.6 18.6 26.0 21.2 14.7 leverage ratio
Ø FCF adj. (million €) -51 231 155 -573 -125
15Guiding principles of strategy and management focus
New business areas
Grow the core
10%
Optimize the 20% REKS
existing
Circular economy
Fertigation
70% Digitalization
Micronutrients Automation
Operations excellence Biostimulants
Carbon footprint
Bethune ramp-up Soil health
Werra 2060 Climate strategy
Sustainability goals
Financial ▪ ROCE>WACC over a cycle of 5 years
▪ At the same time, an EBITDA margin of more than 20% is targeted over this cycle
ambition
16 ▪ Positive free cash flow from 2023 even in the event of low potash pricesStrategic classification of salt business
Global market position of the continuing K+S salt business
▪ After sale of OU Americas, reduced global relevance and reach
▪ Risk of new competitors entering the market (e.g., Ciech, Varnitsa)
▪ Continued high dependence on de-icing salt business with simultaneous global warming
▪ Financial and management capacities still scarce:
Focus on business areas with a better opportunity/risk ratio and greater
importance for the overall portfolio
• Focus on operational and tactical improvements, e.g., portfolio, costs, efficiency
• Major strategic considerations (market consolidation, opening up new markets, e.g.,
Asia) are no longer in focus
17Bethune: 70%
Commodity site with cost leadership
▪ Growth on the way to 4mt pa is achieved through
secondary mining & cooling pond technology
▪ Improvements in efficiency through automation, start
of secondary mining and reduction of energy input per
tonne of end product
➢ Reduction of energy and water consumption
(introduction of technologies with low greenhouse
gas emissions).
➢ Increased brine concentration
➢ Improvement of plant components in factory
and loading operations
➢ Improve plant performance, availability, and
capacity utilization (OEE)
➢ Reduction of costs per cavern
18Bethune
Ramp-up to 4mtpa
4mtpa
4mtpa
Next Target: Stage >=1
FEL 0
3mtpa
Capacity 2024 Next Target: Stage >=2 FEL 1
2.3mtpa
FEL 0 FEL 2
Next Target: Stage >=4
FEL 1 FEL 3
2mtpa FEL 0
FEL 2 FEL 4
Timing: This project Completed
represents a continuous FEL 1 Engineering completed by % of value
FEL 3
capacity ramp-up. Site Bethune
Since K+S is still cash
FEL 2
Operating at 2mtpa FEL 4
constraint, we are Continuing to ramp FEL 3
managing the project up towards 4mtpa Engineering completed by % of value
from a cash constraint target capacity FEL 4
budget with flexibility on
completion time. Only 3 Engineering completed by % of value Defined Underlying Base Capex:
Base Capex represents the minimum average annual spend
years forward (MTP
cycle) are budget grade
2021
19Site costs (at mine gate) in comparison
Further ramp-up
USD/t of Bethune to 4mt
will bring Bethune -30%
into the first
quintile
Best-in-class
*
K+S Bethune K+S Bethune K+S Zielitz
1st Quintile of lowest cost (mid-term) (today) (purely MOP)
production volume
* column width =
Source: CRU Report 2019, K+S production capability in million tonnes
Continuous ramp-up of Bethune increasingly improves our cash costs
and thus our competitive position
20Zielitz: 70%
Clear focus on potash products
▪ Focus on innovative strategic future projects
and concepts:
➢ Operations Exellence (cash cost reduction)
➢ Autonomous mining and process control systems
➢ Renewable energy, H2 and CO2 infrastructure
▪ Expansion of KCl 99 to become the industry
leader in this specialty
▪ Feasibility studies for expansion into other
specialties, such as pharma KCl, SOP, NOP
21Werra: 70%
World's largest potash, magnesium and sulphur specialties plant
1. Optimize portfolio
➢ Maximize CMS (Epsom Salt)
➢ Increase granulated products
➢ Increase of SOP production
➢ New specialties, incl. green fertilizers
2. Future proof
➢ Increase extraction rate
➢ Reduce process water
➢ Reduce solid by-products
➢ Reduce energy consumption
➢ Reduce CO2 emissions
3. Licence to operate
➢ Improvement of the permit situation
➢ Tailings pile coverage
22Neuhof: 70%
Specialties plant for the European market
Increase plant lifetime
1. Efficiency
➢ Increase extraction rate
➢ Reduction in chemical consumption
➢ Increase own power generation
➢ Reduce energy usage
2. Optimize portfolio
➢ Increase kieserite production
➢ Increase granulated products
3. Future proof
➢ Improvement CO2 footprint
➢ Tailings pile coverage
2370%
Strategic direction of the potash primary sites
Commodity alignment Cost
leadership, ramp up
Profitability *
Commodity alignment
Specialties alignment Highly efficient potash site
Expansion of product portfolio
Neuhof
high
Zielitz
Turn-around
Winters- Hattorf
hall
low Unter-
breizbach Bethune
Werra
Future prospects
low high (deposit / inventories, permit situation)
* based on 2020 results
2470%
Centers of excellence for focus topics
Bethune Zielitz Neuhof Werra
Increase extraction rates X
Autonomous mining X
Process automation X
Energy efficiency and CO2 footprint
X
reduction
New business models
e.g., CO2, H2, energy X
2570%
Optimization of K+S salt sites
Generally
• Focus on cost optimization; manage capex at base level; maintenance and operational
improvement measures with ROI ≤ 3 years
Shaping concepts for commodity vs. specialty sites
• Concentration of de-icing salt volumes at low-cost sites
• Optimization logistic concept including reduction of warehouses/network
• Focus on industrial salt at Frisia Zout
Ashburton:
• K+S Salt Australia is currently working on the final feasibility study for the project. The report should be available shortly.
• We also expect the environmental and mining permits for the project by the end of this year.
• Consensus estimates that the potential annual salt production of the Ashburton project would be around 4.5mt p.a. with
USD 400mn project costs to complete.
• After having the permits and results of the feasibility study, management will decide according to the strategic
classification of the salt business: invest or sell the project at a premium.
2670%
Operations Excellence at K+S:
Sales, Marketing and Supply Chain
• Improve net backs (e.g. pricing, product allocation)
Digitalization throughout the value chain • Production planning (margin optimized production portfolio )
Application and use of cloud data and AI-based algorithms
• Sales and service Platforms for agriculture (e.g. roll out MY K+S)
• Grow industrial potash, e.g. KCl 99, Epsom salt, Pharma KCl
Product Offering and Portfolio • Value-adding product variations based on the existing portfolio,
Portfolio expansion with higher value specialties for both
e.g. green potash, improved applicability, water-soluble
Agriculture and Industry
fertilizers, value-adding blends
Regional Expansion
Establish local sales offices in selected regions, increased gras • Getting closer to the customer in selected markets
root activities, agronomical services
• Optimization of our logistics and supply chain network, e.g.
Supply Chain Excellence warehouse optimization
Efficiency gains in supply chain and logistics • Working capital improvements though planning and supply
chain optimization
27
2770%
Share of additional EBITDA contribution by 2023
Plants Market Supply Chain Other
2820%
Grow the core: Contribution of the product groups
Product groups (top line potential by 2030)
Fertigation (>€ 200 million)
Time
Share of
Micronutrients (>€ 200 million)
EBITDA
contribution
Biostimulants (>€ 50 million)
Half of the potential can be realized by 2025
Further inorganic growth potential, if financial situation is adequate
29K+S Climate Strategy
80% reduction of GHG emissions (1990 – 2020) Short-term goal:
already achieved by a change of fuels, increase of
Introduction of a “K+S climate protection
energy efficiency and closing of sites
fund” from 2022 to reduce our CO2 emissions.
Values in Germany
million t CO2 K+S -79%
K+S Mid-term goal:
DE -40%
% Reduction of our CO2 emissions by 10%
1,248 4.7
100 by 2030 compared to 2020.
Long-term goal:
80
K+S supports the goals of the "Paris
739 Agreement": Climate neutrality in 2050
60
can be achieved with a supportive
regulatory framework.
40 K+S therefore calls for a worldwide level
playing field (until then carbon leakage
1.0 protection is required), strong energy
20
infrastructure, transitional funding and
affordable renewable energies.
0
1990 2020 (Note: The Paris Agreement sets out a global framework to avoid dangerous
climate change by limiting global warming to well below 2°C and pursuing efforts
Germany compared to K+S (German potash production, scope 1) to limit it to 1.5°C.)
30Housekeeping items / Financial calendar Additional information on 2021 FY outlook – continuing operations ▪ Tax rate: 30% ▪ Financial result: on the level of last year (2020: €-106m) ▪ CapEx: < €400m (2020: €428m) ▪ D&A: ~€300m Financial calendar Kepler Cheuvreux German Corporate Conference (virtual) – CFO January 18, 2022 2021 Annual Report March 10, 2022 31
Investor Relations Contacts

                            Nathalie Frost                Julia Bock, CFA                   Esther Beuermann
                      Investor Relations Manager       Head of Investor Relations       Investor Relations Manager

                      Phone: + 49 561 / 9301-1403     Phone: + 49 561 / 9301-1009       Phone: + 49 561 / 9301-1679
                     Fax:     + 49 561 / 9301-2425   Fax:      + 49 561 / 9301-2425    Fax:     + 49 561 / 9301-2425
                      nathalie.frost@k-plus-s.com       julia.bock@k-plus-s.com       esther.beuermann@k-plus-s.com

     K+S Aktiengesellschaft, Bertha-von-Suttner-Str. 7, 34131 Kassel (Germany)

     ▪ Email: investor-relations@k-plus-s.com                        ▪ IR-Website: www.kpluss.com/ir
     ▪ Website: www.kpluss.com                                       ▪ Newsletter: www.kpluss.com/newsletter

32
You can also read