CIPP payslip statistics comparison report 2008 - 2021 Lora Murphy ACIPP, policy and research officer, CIPP
←
→
Page content transcription
If your browser does not render page correctly, please read the page content below

CIPP payslip statistics
                    comparison report
                        2008 – 2021
                                  Compiled and edited by
                    Lora Murphy ACIPP, policy and research officer, CIPP

S po nso re d by
This annual research
  looks at the number of
  people being paid, the
   frequency with which
they are paid, the method
  by which they are paid
 and how the payslips are
         distributed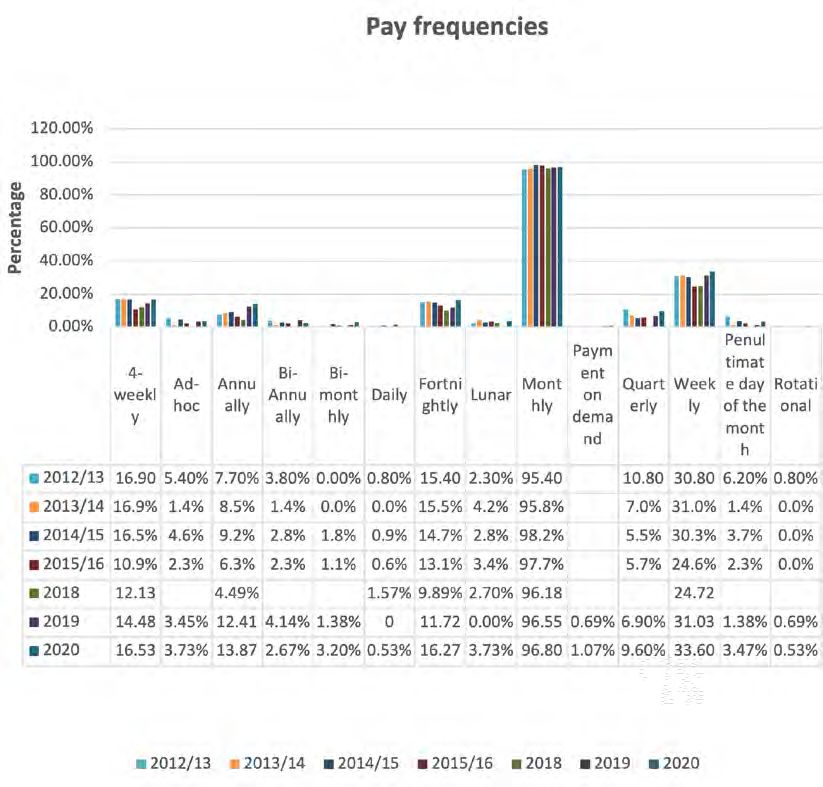
Contents
Datagraphic foreword                                                                        4
Executive summary                                                                            5
  Key findings                                                                               5

  New for this year’s survey                                                                 6

Summary of results                                                                           7
  Year on year payslip trends                                                                7
     Number of employees / pensioners paid                                                   7
     Number of payrolls processed                                                            8
     Payroll frequencies operated                                                            9
     Change of pay frequency                                                                10
     Most popular pay days / dates                                                          10
     Personal Information included on payslips                                              12
     Additional information shown on payslips                                               13
     Responsibility for processing payroll                                                  13
     Method of distributing payslips                                                        14
     Complaints regarding the distribution of payslips                                      15
     Other complaints                                                                       15
     Payment methods                                                                        16

New for 2021                                                                                17
  Changes to legislation                                                                    17
     Awareness of changes to the calculation of holiday pay from 6 April 2020               17
     Impacts of the changes to the calculation of holiday pay from 6 April 2020             18
     How is holiday pay displayed on payslips within businesses?                            19
     Awareness of changes to mandatory payslip information                                  19
  Impacts of increased information on payslips                                              20
     Did the changes to payslips in 2019 have any fundamental impacts on businesses?        20
  The Coronavirus Job Retention Scheme (CJRS) and furlough                                  21
     How many businesses placed staff on furlough?                                          21
     Did you top up furlough pay?                                                           22
     Displaying CJRS payments on payslips                                                   23
     CJRS queries                                                                           23

Core demographics                                                                           24
     In-house versus payroll service provider                                               24
     Industry sector                                                                        24
     Main business location                                                                 24

       C IP P PO L I CY AN D R ES EARC H T EAM PAYSLI P STATI STI CS COMPARI SON 2008-2021        3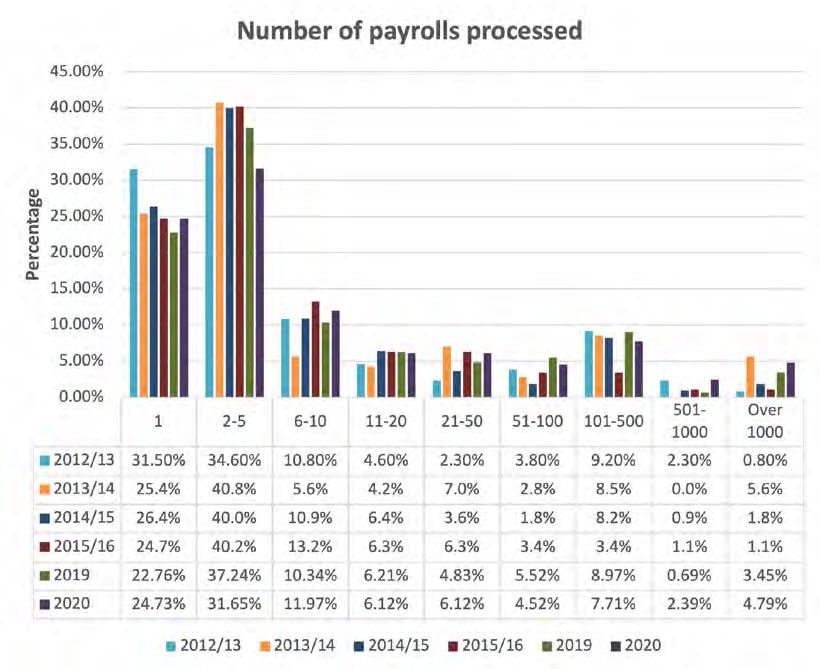
Datagraphic foreword

                             Glyn king
                             Group managing director,
                             Datagraphic

Datagraphic is pleased to support the Chartered Institute of Payroll Professionals (CIPP) Payslip Statistics Comparison
Report. We’ve been an advocate for the CIPP and their research on payroll, specifically payslip distribution, for many
years.

There’s no doubt over the last year, payroll teams have faced unprecedented challenges, but as this report confirms,
you’ve once again stepped up and proven to be key workers throughout the COVID-19 pandemic. Working long hours to
understand the constantly changing legislation and making sure employees are paid accurately and on time.

I’ve seen first-hand the impact the pandemic has had on payroll teams and the change in the way you work, and it appears
many of the changes are here to stay. For example, payroll teams wanting to move to a more digital way of working have
found the pandemic has been the catalyst to force the change into action, and this has been highlighted in the report. 22%
of respondents have changed how they distribute payslips: moving to online delivery or posting to home addresses.

However, those that have moved to online delivery may have chosen a ‘quick fix’ solution due to the pressures of the
pandemic. But, it’s so important to keep data protection at the forefront of your mind. This is why it’s still surprising to see
30% of respondents said they email payslips. It’s well known that emailing payslips is not a secure way, and even password
protected emails can’t protect personal and financial employee information. It seems home working, or at least hybrid
working, will continue after organisations start to reopen their places of work, so perhaps it’s time for those who are emailing
payslips to look at longer-term solutions that are more secure and engaging.

What is good to see from the report is that organisations are using the payslip distribution process as an opportunity to
communicate other information. 28% of respondents to the survey say they use it to communicate early pay dates, general
company messages, internal newsletters and messages of support during COVID. Hopefully, more payroll teams will take
advantage of this opportunity. Secure online portals, like Datagraphic’s Epay, are a great way of communicating more than pay
information. It can be an employee’s communication and resource hub where they can access not only documents that are
personal to them but also company-wide documents such as policies and handbooks. Employees are engaged and want to
see their pay information, so why not use it to communicate other important messages.

It will be interesting to see in the year ahead whether payroll teams continue to progress with the use of digital technology to
help them distribute payslips and other pay documents in more secure and engaging ways.

To the CIPP and all those who contributed to this report, thank you. I hope you find the results thought-provoking.

 4                      C I PP POL I CY AN D R ES EARC H T EA M PAYSLI P STATI STI CS COM PARI SON 2008-2021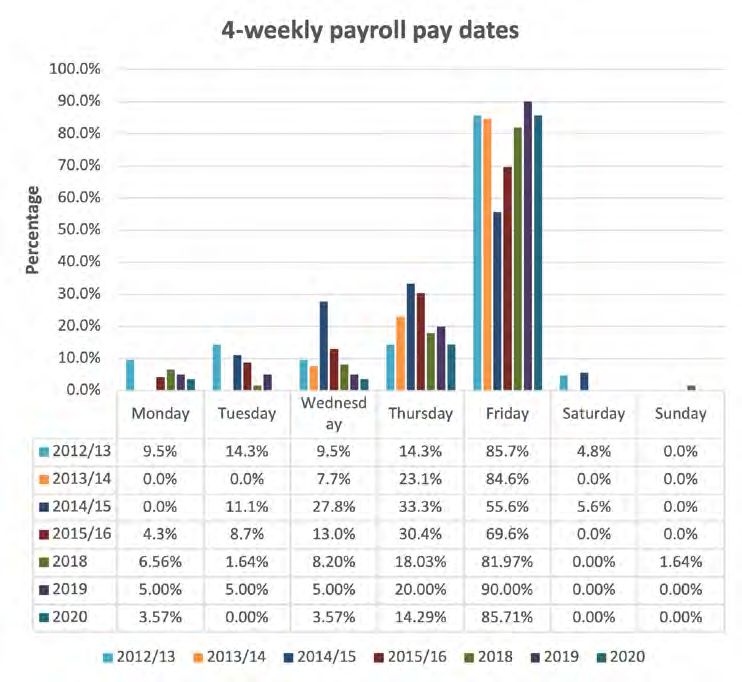
Executive summary

The CIPP’s flagship survey which explores trends impacting payroll processes and payslips has been running since 2008.

The policy and research team would like to take this opportunity to thank all those who took the time to respond to the
survey, and who fed into this valuable research. We most certainly could not carry out tasks such as this without these
contributions.

The research seeks to explore how many people are being paid, at what frequency, through which method and how payslips
are provided to staff.

Each year, a selection of questions are included which centre on subjects currently impacting payroll professionals, and in
this particular survey, there is a focus on changes to holiday pay legislation and amendments to rules surrounding what
information needs to be displayed on payslips.

Additionally, the survey investigates the impacts of coronavirus, and specifically the Coronavirus Job Retention Scheme
(CJRS).

KEY FINDINGS
● Unsurprisingly, the most common pay frequency remains unchanged, and is monthly – over 96% of respondents
  confirmed that they operate at least one payroll at this frequency within their organisation
● The largest number of responses came from those within the accountancy sector (14.36%), followed by respondents in
  the retail sector (14.10%) and then those from a manufacturing background (11.79%)
● There is consistency in the percentage of payroll service providers or agents acting on behalf of their client base that have
  replied to the survey when comparing this year’s results with those from last year- this continues to sit at approximately
  25%. Previous years showed that responses from this population made up approximately 15-18% of the total results
● This survey includes a ‘payment on demand’ question, which was first introduced last year in recognition of the constantly
  shifting landscape of payment methods. In 2019, 0.7% of respondents confirmed that they used this method of pay in
  their businesses, and this has increased to 1.07% in the space of a year. This may not seem to be a significant increase,
  but when the duration of time is considered, it cannot be ignored, and suggests that ‘payment on demand’ is becoming
  more popular
● Whilst on the topic of ‘payment on demand’, last year’s results indicated that 7% of businesses had received requests from
  employees to be paid in this manner, as opposed to receiving their wages on their standard pay day. This has reduced
  to just over 4% in the current year, which potentially reflects the fact that more businesses now offer this payment type,
  meaning that less employees feel the need to make requests of this nature
● Just shy of 3% of respondents confirmed that there had been an amendment to the pay frequency within their business
  over the course of the past two years – the comments suggest that the majority of these changes relate to businesses
  changing from weekly to monthly payroll. Nearly 7% of responses highlighted the fact that employees had requested
  their pay frequency to be changed. The main reason for this centred around easier financial planning and budgeting for
  members of staff, which ties in with financial awareness, which is a pertinent topic at present, given the impacts of the
  pandemic

                 C IP P PO L I CY AN D R ES EARC H T EAM PAYSLI P STATI STI CS COMPARI SON 2008-2021                          5
● There is no change to the number of respondents who pay staff members early in December, to account for Christmas,
  and this figure remains at roughly 68%
● It will come as no surprise that the most common pay day for weekly, fortnightly and four-weekly payrolls is Friday
● The last day of the month is the most popular pay day for monthly payrolls (40.96%), followed by the 25th (25.42%)
  and then the 28th (24.58%). This confirms that the widespread practice of paying employees on the last available
  working day of the month continues in contemporary society and seems to suit most people’s lives
● The majority of employers distribute payslips to employees using digital methods - 47% of respondents confirmed they
  distribute employee payslips via an online portal, 33% provide an online self-service facility, 31% circulate e-payslips and
  30% utilise an email facility
● There could not be a survey of 2020 and 2021 trends without mention of coronavirus – and a staggering 78% of
  respondents confirmed the method by which payslips were distributed within their business throughout the duration of the
  pandemic did not change, whilst 22% stated that coronavirus had led to a change to the process by which payslips were
  distributed
● Echoing results from previous years, the reason cited for the most frequent complaint (53%) received in the payroll
  department related to the issue of overtime or additional hours not being paid
● The most popular payment method, irrespective of pay frequency was via BACS – this is something that has not changed
  since the Payslip Statistics Survey was introduced back in 2008

NEW FOR THIS YEAR’S SURVEY
● 88% of respondents confirmed they were aware of the changes to the calculation of holiday pay that came into effect
  from 6 April 2020
● The extension from 12 weeks to 52 weeks for the reference pay period relating to holiday pay has not impacted 62% of
  businesses. Additionally, the requirement to display the number of hours worked for those whose pay varies because of
  this has not had affected 88% of businesses
● 71% of businesses had to place staff on furlough at some point during in the pandemic, and 60% of those topped up
  employee pay, rather than only paying at the government-subsidised amount

 6                      C I PP POL I CY AN D R ES EARC H T EA M PAYSLI P STATI STI CS COM PARI SON 2008-2021
Summary of results

YEAR ON YEAR PAYSLIP TRENDS

Number of employees / pensioners paid
This is a key question included within each edition of the Payslip Statistics Survey and requires respondents from an in-
house payroll environment to calculate how many employees there are in total across the payrolls that they operate. If the
respondent originates from a bureau background, then they will need to add up the total number of employees spanning all
their clients’ payrolls.

In the period between the 2015-16 and the 2018 reports, there was a significant increase to the numbers of employers
paying up to and including 50 staff. Those businesses employing between 51 and 1,000 staff decreased during this time.
In 2019, the increased practice of businesses paying up to 50 staff appeared to stop, with figures more aligned to those
witnessed between 2012 and 2014. For the current year, however, it is evident there has been a slight increase in the levels
of companies paying less than 50 staff (as seen in 2018) and a slight decrease to the figures for those paying between 51
and 1,000 employees and similarly, to those paying between 1,0001 and 10,000 employees. The number of organisations
paying over 100,000 staff sits more in line with 2018 figures, and there has arguably been an increase in this practice
between the 2019 and 2020 reports.

It could be plausible to state that the impacts of coronavirus may have played a key role in the number of employees
companies paid over the duration of 2020.

                 C IP P PO L I CY AN D R ES EARC H T EAM PAYSLI P STATI STI CS COMPARI SON 2008-2021                      7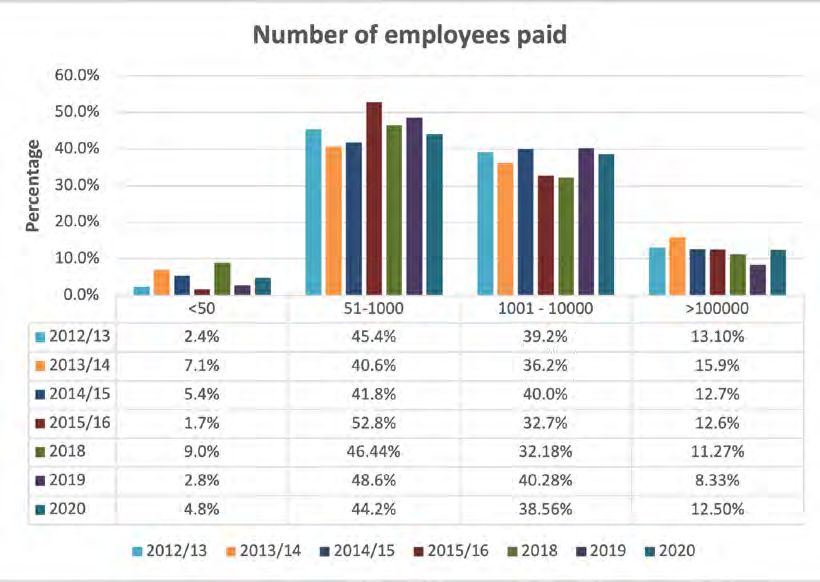
Number of payrolls processed
As the title suggests, this question centres around how many payrolls employers and payroll service providers are responsible
for processing. Historically, the results have indicated the majority of respondents process between two and five payrolls.
As you can see from the chart below, this year is no different. The second most common response came from those who
process just one payroll.

This question was not included in the 2018 survey.

 8                      C I PP POL I CY AN D R ES EARC H T EA M PAYSLI P STATI STI CS COM PARI SON 2008-2021
Payroll frequencies operated
Since the introduction of the Payslip Statistics Survey back in 2008, the most commonly operated pay frequency has been
monthly, and that trend continued into 2020. The second most popular pay frequency continues to be weekly. Last year, pay
on demand was introduced as a pay frequency response option, and collected 0.7% of responses.

In the space of just a year, this has increased to 1.07%. Whilst this is still a relatively small proportion of respondents, the
amount that its use has grown over such a small period indicates this could be something that more and more employers
choose to offer, particularly given the increased emphasis on financial awareness, exacerbated by the turbulence posed by
the pandemic.

4% of respondents stated that employees within their business had actually submitted requests to be paid on demand, but
the majority of 96% confirmed that no such requests had been made within their company.

                  C IP P PO L I CY AN D R ES EARC H T EAM PAYSLI P STATI STI CS COMPARI SON 2008-2021                              9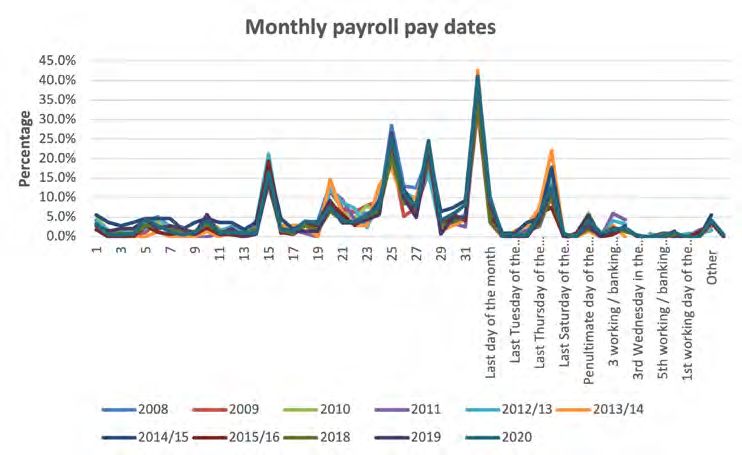
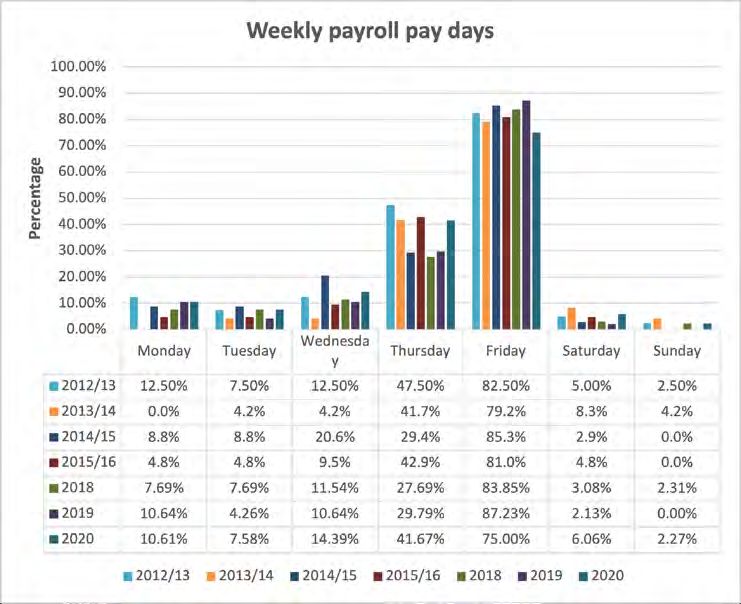
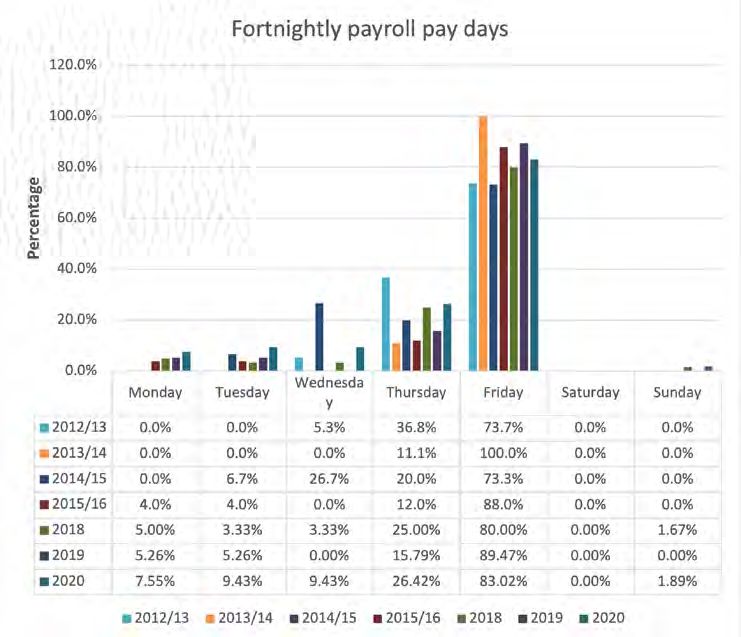
Change of pay frequency
A question was introduced in last year’s survey relating to whether businesses have changed the pay frequency they operate
over the course of the last two years. Unsurprisingly, the overwhelming response was for no, with only 3% of respondents
confirming they had indeed witnessed and / or administered a change to pay frequency within the past two years.

In addition to this, the report queried whether employees had requested their pay frequency be changed. Only 7% of
responses stated that yes, employees had requested a change to their pay date. Some of the qualitative responses confirm
this is due to the way in which the universal credit assessment period falls, and this is something that further research will
need to conducted. There also seems to be a preference for weekly pay cycles as opposed to monthly in some sectors.

Many companies are reluctant to amend pay frequencies due to the upheaval it can cause, and the subsequent impacts on
employees’ cash flow, but it appears that change could be imminent anyway. The Office of Tax Simplification (OTS) recently
published a scoping paper, which explores the potential of shifting the tax year end date from the current 5 April to either 31
March or 31 December. This is something the CIPP is particularly interested in due to the massive implications it will have on
the work of payroll professionals.

Many companies opt to pay early in December, to provide employees with sufficient money to account for Christmas. Payroll
departments must ensure that, where they do pay staff on a date that is earlier than normal in December, they still record
the contractual pay date on the Full Payment Submission (FPS). 50% of respondents confirmed that they do exactly this, but
worryingly, 19% include the date employees were actually paid on the FPS, and 2% admit they do not know which pay date
has been used. This indicates further education is needed in this area to ensure widespread compliance. Employers need to
be sure that they follow the correct process as recording the wrong payment date can impact things such as an employee’s
entitlement to Universal Credit. 29% of respondents confirmed they do not actually pay earlier than the contractual pay date
in December.

Most popular pay days / dates
Predictably, Friday continues to be the most popular pay date across weekly, fortnightly and four-weekly payrolls, commanding
75%, 83% and 86% of results respectively. This has been the case for all recent years in which the research has been
conducted. Thursday was the second most common pay day, collecting 42% of responses for weekly payrolls, 27% for
fortnightly payrolls and 14% for four-weekly payrolls. Again, this trend does not appear to have shifted in recent years.

 10                     C I PP POL I CY AN D R ES EARC H T EA M PAYSLI P STATI STI CS COM PARI SON 2008-2021
Where payrolls are operated on a monthly basis, the last working day of the month continues to be the most frequently used
pay date, and this has remained unchanged since the Payslip Statistics Survey was first introduced over a decade ago. This
accounted for 41% of responses in the 2020 research.

                 C IP P PO L I CY AN D R ES EARC H T EAM PAYSLI P STATI STI CS COMPARI SON 2008-2021                   11
Personal Information included on payslips The survey asked respondents to confirm which personal information was displayed on payslips. 98% of responses confirmed that payslips show employee tax codes, whilst 97% include employee names, and 95% detail employee payroll numbers. At the other end of the spectrum, only 1% show the employee’s bank details if requested, and 2% include the employee’s date of birth. This is presumably due to the security implications of including such personal information on 12 C I PP POL I CY AN D R ES EARC H T EA M PAYSLI P STATI STI CS COM PARI SON 2008-2021
a document that shows pay, and because neither of these elements are mandatory. When the current year’s results are
compared to prior years, there does not appear to have been many changes to what personal information is included on
employee payslips.

Additional information shown on payslips
The additional information shown on payslips varies widely from business to business, but the most frequently recorded
elements, with response rates exceeding 90% are as follows:

●   Tax (98%)
●   Tax paid to date (96%)
●   Employee pension contributions (96%)
●   Statutory Maternity Pay (SMP) (95%)
●   Net Pay (95%)
●   Employee NI (95%)
●   Student loan deductions (94%)
●   Statutory Paternity Pay (SPP) (92%)
●   Statutory Sick Pay (SSP) (91%)
●   Employee NI to date (91%)

The CIPP recommends that, where possible, as much information relating to pay is included on payslips as this will ensure
that workers understand how the net figure they have received has been established, which will, in turn, reduce the number
of queries into the payroll department, leaving payroll professionals more time to deal with more strategic tasks.

Indicating that more businesses now operate the payrolling of benefits, as opposed to what HMRC now deems as the
‘legacy’ P11D process, 34% of respondents confirmed this was one of the details included on employee payslips. Although
this is a decrease from the 40% recorded in 2019, this is still a significant increase on the 20% collected in 2015-16.

Responsibility for processing payroll
Approximately 85% of respondents report the responsibility for processing payroll lies solely in-house, and that no element
of payroll processing is outsourced. This figure consists of those that offer different methods of payslip distribution – printed,
online and a combination of both. This remains unchanged from the figures observed in 2019’s report, which increased from
72% the previous year.

There are, however, companies that combine both in-house and outsourced payroll processing, and may process the payroll
in-house but outsource the payslip printing and distribution duties (8%), and there are also those that outsource the payroll
processing functions but deal with payslips in-house (also 8%). This is a sharp decrease from figures witnessed in 2019’s
report, which highlighted that 35% of respondents partially outsourced their payroll, and from 2018’s report which showed
that 22% dealt with their payroll in this way.

There are also those companies that outsource all elements of their payroll, and this makes up 26% of responses in this
year’s research.

                  C IP P PO L I CY AN D R ES EARC H T EAM PAYSLI P STATI STI CS COMPARI SON 2008-2021                         13
Method of distributing payslips This is always an area of interest for the CIPP’s Policy team, and it has been impressive to see how the payroll function has moved with the times and adapted to modern society, as more and more companies have opted to provide payslips in some kind of digital format since the research was first introduced back in 2008. In 2020, a whopping 47% of respondents confirmed that payslips were provided via an online portal, 33% stated that payslips were accessed via self-service, 31% used e-payslips and another 30% utilised an email facility. This represents a decrease to the number of companies offering payslips via self-service online, which made up 60% of responses in 2019, but this could be due to the increased popularity in the use of online portals. When the research began, back in 2008, 67% of respondents confirmed they sent paper payslips directly to departments for distribution, and in 2020, that percentage has dropped to a minuscule 5%. It is amazing how technology has impacted payroll and its processes over the course of just over a decade. An additional question was included within the 2020 research to ask whether coronavirus, and the shift to working remotely, had meant that companies had to change their method of payroll distribution. 78% of respondents confirmed that no changes were made, but 22% stated they were required to amend the process by which payslips were sent out. It would be plausible to state that those companies circulating payslips on a digital basis would be relatively unaffected by the move to working from home, but those providing paper payslips for distribution by departments, in particular, would have been forced to change the method for distributing payslips due to the pandemic. 14 C I PP POL I CY AN D R ES EARC H T EA M PAYSLI P STATI STI CS COM PARI SON 2008-2021
Complaints regarding the distribution of payslips
2021’s research highlighted the fact that the majority (64%) of workforces have not complained about the distribution of
payslips. The main complaints centre on the method of distribution and the fact that employees want to receive their payslips
at their home addresses.

The least frequently reported complaints related to self-service security concerns and the internal mail system.

Other complaints

Payroll professionals will be all too aware that complaints submitted to the payroll department do not just focus on how
payslips are distributed.

The most frequently reported grumble from employees relates to overtime or additional hours not being paid in a timely
fashion, which accounted for 53% of responses to the question on the topic of complaints. This is understandable as
employees are entitled to access the funds they have worked for, but this is often due to miscommunication from other
departments, or the absence of any communication at all. This is not a newly observed trend, as research highlights that, in
2019, this made up 51% of complaints received by the payroll department.

The other most frequently reported complaints related to underpayment due to an incorrect tax code (15%) and
underpayment due to another reason (10%).

                 C IP P PO L I CY AN D R ES EARC H T EAM PAYSLI P STATI STI CS COMPARI SON 2008-2021                       15
Payment methods Bacs remains the payment method of choice, regardless of the frequency of the payroll being operated. Faster payments remain the second most popular payment type, but payroll professionals will be aware that they, along with CHAPS payments, are regularly used where there is a shortfall in an employee’s payment and they need to be paid correctly, and in a very short space of time. It is highly unlikely that this would be a business’s primary pay method due to the associated costs per transaction. The practice of paying employees by cash seems to be dwindling, as even less respondents than those recorded in 2019 confirm that this is a method their organisation uses to pay its staff. 16 C I PP POL I CY AN D R ES EARC H T EA M PAYSLI P STATI STI CS COM PARI SON 2008-2021
New for 2021

CHANGES TO LEGISLATION

Awareness of changes to the calculation of holiday pay from 6 April 2020
6 April 2020 heralded huge changes to the fundamentals of how holiday pay is calculated for workers that have variable
hours and / or pay. The pay reference period for use within the calculation was extended substantially from the previously
observed 12 weeks up to a full 52 weeks.

In addition to this, employers were now only able to count back over a period of 104 weeks or less to achieve 52 weeks’
worth of pay data, whereas historically, they could count back as far as they needed to gather 12 weeks’ worth of data.

The CIPP wanted to assess how extensive knowledge of the change to the calculation of holiday pay is, and whether this has
had significant impacts on businesses.

88% of respondents confirmed they were indeed aware of the changes, but this still leaves 12% who were not.

It is important that businesses familiarise themselves with the current rules surrounding the calculation of holiday pay to
ensure that they are compliant, and therefore paying their workers correctly. It will also dramatically increase the likelihood of
employees raising grievances or taking their employers to Tribunal.

                  C IP P PO L I CY AN D R ES EARC H T EAM PAYSLI P STATI STI CS COMPARI SON 2008-2021                           17
Some of the comments associated with this question indicate that employers and agents who process payroll on behalf of their clients are reluctant to adopt the 52-week calculation as it is too complex to apply. They instead use the 12.07% calculation. The CIPP strongly advises against utilising the 12.07% method as this has been removed from all guidance due to the outcomes of various tribunal cases on the topic of holiday pay. It is no longer a valid calculation for the purposes of holiday pay. Impacts of the changes to the calculation of holiday pay from 6 April 2020 In terms of the impact on businesses of the changes to the calculation of holiday pay, the majority of respondents state that it has had no effect within their business, with 62% adopting this stance. 38%, however, confirm this has impacted their business. Businesses that have not been impacted may be those that predominantly pay staff on a fixed basis, where their pay does not fluctuate from pay period to pay period. Some of the anecdotal comments provided, suggest the reason the impacts have been small for many is because some businesses were already utilising a 52-week reference period and because the amended calculation is not applicable in Northern Ireland. As expected, others confirm that they pay staff mostly static pay, so the changes to the calculation for holiday pay for those with variable pay and / or hours has not affected them. Those that have been affected by the changes state that the calculations have made establishing holiday pay amounts more challenging and that it has increased costs for the business – both in the payment and the administration of holiday pay. It has been highlighted, however, that some businesses have seen a positive impact because of the changes, as it has stopped the practice of employees working additional overtime directly before their annual leave to increase the rates of holiday pay they receive. 18 C I PP POL I CY AN D R ES EARC H T EA M PAYSLI P STATI STI CS COM PARI SON 2008-2021
How is holiday pay displayed on payslips within businesses?

Due to the amendments to the calculation of holiday pay, it felt appropriate to explore how holiday pay is displayed on
employee payslips.

The responses drawn from this question show the majority of payroll departments do not split holiday pay out, and it is
simply included within the salary element on employee payslips. This suggests, in line with previous responses, that many
companies do not pay staff with either variable pay or hours and that they instead receive a fixed figure each period.

Where businesses opt to display holiday pay separately, 30% include it as an hourly rate, while 15% show it as a daily rate.

Where respondents originate from a bureau background, they confirm how holiday pay is calculated and subsequently,
itemised, on payslips will be wholly dependent on the client that they are processing payroll for.

There are also a significant number of comments suggesting that payroll professionals encounter a mix of all three methods
of displaying holiday pay, based on the nature of the employment of individuals, as businesses often employ a wide variety of
staff, who work and receive pay in a variety of different ways.

Awareness of changes to mandatory payslip information
From April 2019, additional information had to be displayed on payslips provided to workers whose pay would vary based on
the basis of the number of hours they work.

                 C IP P PO L I CY AN D R ES EARC H T EAM PAYSLI P STATI STI CS COMPARI SON 2008-2021                        19
Although this change was implemented a while ago, the CIPP wanted to gauge if this is commonly understood. The majority of 85% confirmed they were aware of the changes, but the remaining 15% need to familiarise themselves with the rules. This, along with awareness of the holiday pay calculations, is crucial to ensuring compliance, and will prevent fines being issued and any associated tribunals. IMPACTS OF INCREASED INFORMATION ON PAYSLIPS Did the changes to payslips in 2019 have any fundamental impacts on businesses? 20 C I PP POL I CY AN D R ES EARC H T EA M PAYSLI P STATI STI CS COM PARI SON 2008-2021
The overwhelming majority of 88% of respondents stated this did not have an impact on their business, meaning only 12%
confirmed that it did actually have an effect.

The comments associated with the question highlight the fact that many businesses were already observing this practice and
showing this information on payslips prior to it being made mandatory.

THE CORONAVIRUS JOB RETENTION SCHEME (CJRS) AND FURLOUGH
It would be plausible to state that nobody who lived through 2020 could refer back to the year without mentioning the
phrases ‘coronavirus’ or ‘pandemic’. It impacted every aspect of daily human life, and payment was just one of those.

The Coronavirus Job Retention Scheme (CJRS) threw a lifeline to many employers and individuals impacted by the economic
turbulence posed my COVID-19, and the CIPP could not have completed a Payslip Statistics Survey for 2021 without
reference to the scheme and to furlough.

How many businesses placed staff on furlough?
Although there are frequently updated statistics published by HMRC, the CIPP wanted to see how many respondents to the
survey had to place staff on furlough at any point over the duration of the pandemic.

71% of responses were collected from those businesses that did place staff on furlough, whilst the remaining 29% did not.
This shows how extensive use of the scheme has been, which, at the time of writing, is still open, and is due to close at the
end of September 2021.

                 C IP P PO L I CY AN D R ES EARC H T EAM PAYSLI P STATI STI CS COMPARI SON 2008-2021                       21
Did you top up furlough pay? The highest level of support offered by the Government through the CJRS sat at 80% of an employee’s usual wages, up to a maximum of £2,500 per month. This fluctuated from month to month and will reduce to 60% during the final months of the scheme’s operation. Employers, however, have still been required to ensure staff receive the equivalent of 80% of their standard salary, regardless of the level of Government support they can claim, so have had to fund a proportion of the employee’s pay themselves. Since the introduction of the scheme back in March 2020, however, employers have had the option of topping the pay amount up beyond that 80%, so, for example, they could claim for 80% of an employee’s wages through the CJRS but still pay them 100% of their pay, as long as they paid for that additional 20% themselves. The CIPP wanted to establish how widespread this practice was. Results show that the majority (60%) of respondents topped employee pay up to the normal amount. The additional comments highlight the fact that lots of businesses did not fall strictly into one category or the other, as they may have topped up pay for several months and then opted to pay at the Government-funded rate only for another period of time. Qualitative data also suggests that employers topped up the pay for some staff, but not others. Again, respondents from bureau environments confirmed that how pay was administered throughout the pandemic depended completely on their clients. 22 C I PP POL I CY AN D R ES EARC H T EA M PAYSLI P STATI STI CS COM PARI SON 2008-2021
Displaying CJRS payments on payslips
As the survey centres on payslips and what they show, the CIPP wanted to ask in businesses that did opt to top up pay, how
was this detailed on payslips.

Were the furlough and top-up elements split out, or was it just shown as normal pay?

The responses show that the majority of businesses chose to separate furlough and top-up pay out, but there were also a
large number who simply displayed it as normal pay.

Anecdotal evidence from the survey suggests a trend for displaying pay as normal pay where full furlough applied, but for
splitting the pay elements out once flexible furlough was introduced.

CJRS queries
On a more general level, and out of genuine curiosity, the CIPP wanted to establish if, along with the CJRS and furlough,
came a flurry of questions for payroll professionals. Payroll professionals were responsible for business as usual items, and for
paying employees both accurately and on time, but also had to administer a brand new scheme and answer any queries that
were received in relation to it.

This was asked as an open-ended question and responses varied from staunch ‘No’s’ to those who admitted to feeling
completely overwhelmed with the volume of CJRS queries. The main theme of those questions seemed to relate to how
figures had been established, due to a general lack of understanding of the associated calculations. The arrival of flexible
furlough seemed to bring with it an influx of additional queries for payroll teams.

                  C IP P PO L I CY AN D R ES EARC H T EAM PAYSLI P STATI STI CS COMPARI SON 2008-2021                          23
Core demographics
In-house versus payroll service provider
The 2019 and 2020 reports heralded the rise of the payroll bureaux.
In previous years, the number of respondents confirming they were
responding as a payroll service provider or agent acting on behalf of
75%
their client base remained relatively stable, ranging from 15-18%. In
2019, however, this leapt significantly to 25%, with the results remaining
unchanged in 2020. It would be interesting to see which factors led
to the extended use of bureaux. Sources do report, however, that the
In-house 25%
utilisation of bureaux became a more prevalent practice in 2020 as Service
employers could not efficiently run payrolls in-house whilst dealing with provider
coronavirus-related absences in payroll teams or, similarly, the increased
administrative pressures associated with the introduction of the CJRS and
the queries relating to the scheme.
Industry sector
Last year’s report indicated that respondents from the retail sector increased dramatically in 2019, moving from an average
of 4-5% between the periods of 2016 and 2018 up to 12% that year. The trend has continued into 2020, and even
more responses have been provided by those from a retail background, equating to 14% of the total responses collected.
The most answers came from individuals within the accountancy sector, forming 14%. This was followed by those from a
manufacturing background, who accounted for 12% of responses, which is a sizeable decrease from the 16% collected
from individuals in manufacturing in 2019. The 2020 report collected no responses from people working within the mining/
quarrying or Ministry of Defence sectors.
14% 14% 12%
Retail Accounting Manufacturing
Main business location
The majority of respondents came from those working in a business throughout the UK, making up 42% of all responses.
This has increased from last year, in which 35% of respondents came from individuals working throughout businesses within
the UK.
Those operating within the UK and overseas made up 12.5% of responses, and this could potentially be due to the ongoing
impacts of Brexit.
Responses from businesses operating on a smaller scale within the UK came most frequently from the South East of
England, accounting for 9% of responses, which is a decrease from the previously observed amount of 13% of respondents
in 2019’s research.
24 C I PP POL I CY AN D R ES EARC H T EA M PAYSLI P STATI STI CS COM PARI SON 2008-2021Payroll automation reduces payslip
distribution processes by
98%
Download your free guide
to start your successful
payroll automation
project today:
bit.ly/RPAinPayroll
Powered by
payslipreport2021_v1_210623You can also read