Views on policy and politics on the eve of the 2022 Federal Election ANU Centre for Social Research and Methods
←
→
Page content transcription
If your browser does not render page correctly, please read the page content below
Views on policy and politics on the eve of the 2022 Federal Election

 Views on policy and politics on the eve of
        the 2022 Federal Election

       ANU Centre for Social Research and
                   Methods
Professor Nicholas Biddle,1 and Professor Matthew Gray,1

   1 ANU Centre for Social Research and Methods

Australian National University

6th May 2022

                                                                       i
The ANU Centre for Social Research and Methods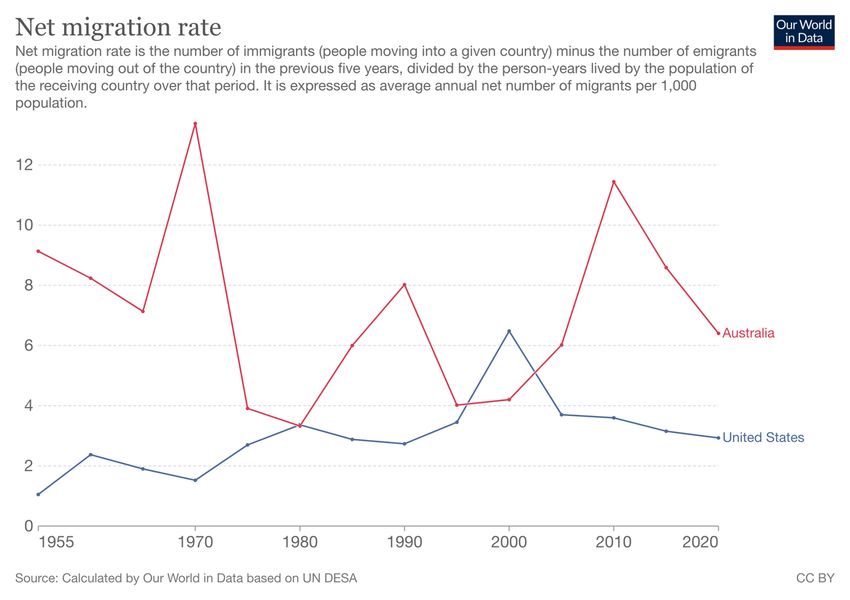
Views on policy and politics on the eve of the 2022 Federal Election

Acknowledgements
The survey data is available for download through the Australian Data Archive
(doi:10.26193/AXQPSE).

Abstract
This paper focuses on the views of Australians on politics and policy, just as the 2022 federal
election campaign got underway. We use data from the April 2022 ANUpoll which collected
data from 3,587 Australians aged 18 years and over. The data collection occurred between the
11th and 26th of April 2022. The survey asked voters what the next government’s priorities
should be across more than 20 policy areas. Almost two-thirds of Australians (64.7 per cent)
say reducing the cost of living should be the next federal government’s top priority. The survey
found the second highest priority was fixing the aged care system, with 60.1 per cent of voters
highlighting this as a key issue. The other top five priorities among voters included
strengthening the nation’s economy (54.4 per cent), reducing the cost of health care (53.5 per
cent), and dealing with global climate change (52.8 per cent) and. The policy area considered
least important was dealing with issues of immigration, which was only of concern to 22.3 per
cent of voters. Only 27.2 per cent of voters thought fixing the budget was a top priority. The
April 2022 ANUpoll also outlined Australians’ voting intentions. There wasn’t any significant
change in the number of people who said they would vote for the Coalition – 31.2 per cent in
April compared to 31.7 per cent in January. There was a small drop in the number of people
who said they’d vote for Labor, with 34.3 per cent saying they would in April compared to 36.3
per cent in January. This was counterbalanced by the slight increase in support for the Greens,
increasing from 14.2 per cent of voters giving the party their vote in January to 16.2 per cent
in April.

                                                                                              ii
The ANU Centre for Social Research and Methods
Views on policy and politics on the eve of the 2022 Federal Election
1 Introduction and overview
On the 10th of April 2022, the Australian Prime Minister Scott Morrison set the date of the next
Federal Election to be the 21st of May 2022. This is almost exactly three years after the previous
Federal Election.
The day after the election was called, the Social Research Centre on behalf of the ANU Centre
for Social Research and Methods began collection of the 50th ANUpoll, a long running survey
dating back to 2008. In addition to collecting information on a range of health, wellbeing, and
economic measures (including a number of COVID-19 specific measures to be released in
future publications), the survey asked a representative sample of adult Australians on their
voting intentions if an election was held on the day of the interview, as well as views on a range
of broader policy areas.
At the time of the survey, in addition to significant numbers of COVID-19 infections and prices
for non-discretionary goods and services had been increasing at a much higher rate than wages
resulting in falls in the real incomes of many Australians.
The April 2022 survey collected data from 3,587 Australians aged 18 years and over. The data
collection occurred between the 11th and 26th of April 2022, with 56.7 per cent of the eventual
sample completing the survey between the 12th and 14th of April. The vast majority (96.6 per
cent) of interviews were completed online, with 3.4 per cent being completed over the phone.
More details on the survey are available in Appendix 1. The survey data is available for
download through the Australian Data Archive1.
Surveys have also been conducted with the same group of respondents since January and
February 2020, just before the COVID-19 pandemic started in Australia. Combined, data from
these surveys allows us to track how outcomes have changed for the same group of individuals
from just prior to COVID-19 impacting Australia, as well as during the most impactful times for
the country. Of the April 2022 sample, 2,424 respondents (67.6 per cent) had completed the
January 2022 survey.
Unlike other Australian political polling, the ANUpoll series of surveys is collected on a
probability-based, longitudinal panel (Life in AustraliaTM). By using probability-based recruiting
(predominantly telephone-based) the unknown and unquantifiable biases inherent in opt-in
(non-probability) panels are minimised. Furthermore, it is possible to quantify the uncertainty
around the estimates due to sampling error using standard statistical techniques, which is not
possible with non-probability surveys. The longitudinal aspect of the survey also means that it
is possible to compare responses in April 2022 with responses to previous surveys for the same
individual, allowing for a more detailed analysis of changes through time.
In this paper, we focus on the views of Australians on politics and policy, just as the 2022
federal election campaign got underway. We begin by extending our time series from just prior
and during the COVID-19 pandemic on satisfaction with the direction of the country and
confidence in institutions. We then look at reflections on vaccine policy and whether it has
gone well or gone fairly. In Section 4 we look at voter preference based on type of candidate,
whereas in Section 5 we look at policy prioritisation. In the final section of results, we look at
the political party that a respondent would have voted for if an election was held in April,
including an analysis of the relationship between voter preference and other measures
presented in the paper. Section 7 concludes.
3
The ANU Centre for Social Research and MethodsViews on policy and politics on the eve of the 2022 Federal Election
2 Views on direction of the country and institutions
This section extends our earlier analysis of Australian’s views about the direction of the country
and level of confidence in key institutions to include the data collected in April 2022.
Figure 1 shows the per cent of Australians who say they were satisfied or very satisfied in
response to the question ‘Firstly, a general question about your views on living in Australia. All
things considered, are you satisfied or dissatisfied with the way the country is heading?’ There
is little change in views between January and April 2022.
Between October 2019, just prior to the 2019/20 Black Summer bushfires, and January 2020
there was a slight decline in satisfaction with the direction of the country with the proportion
of the population satisfied or very satisfied with the direction of the country being 59.5 per
cent at our last data collection pre-COVID. At this point, satisfaction with the direction of the
country was at its lowest over the period October 2019 to April 2022. Satisfaction substantially
increased during the initial COVID-19 period, but has declined since November 2020 to April
2022, when 62.4 per cent of Australians were satisfied with the direction, only slightly higher
than it was in January 2020.
Figure 1 Per cent of Australians satisfied or very satisfied with the direction of the
country – October 2019 to April 2022
90.0
80.0
70.0
60.0
50.0
40.0
30.0
20.0
10.0
0.0
October January 2020 April 2020 May 2020 August 2020 November January 2021 April 2021 August 2021 October January 2022 April 2022
2019 2020 2021
Note: The “whiskers” on the lines indicate the 95 per cent confidence intervals for the estimate.
Source: ANUpoll: October 2019; January, April, May, August, and November 2020; January, April, August
and October 2021; and January and April 2022
Confidence in key institutions rose sharply peaks during the initial COVID-19 period, but have
since that time declined. For example, the proportion of the population with confidence in the
Federal Government in Canberra fell from 60.6 per cent in May 2020 to 35.6 per cent in April
2022, only a little higher than in January 2020 (Figure 2a).
The levels of confidence in the state/territory government in which the respondent lives and
the public service are higher than confidence in the Federal Government, there has been a
similar pattern with substantial increases in levels of confidence during the initial COVID-19
4
The ANU Centre for Social Research and MethodsViews on policy and politics on the eve of the 2022 Federal Election
period followed by declines since May 2020 for the public service and November 2020 for
state/territory governments and January 2021.
Of the three institutions the only one that experienced a statistically significant decline
between January and April 2022 was the public service with 54.5 per cent of Australians having
confidence in April 2022 compared to 57.6 per cent in January (Figure 2c).
Figure 2a Per cent of Australians who have a great deal or quite a lot of confidence in
the Federal Government in Canberra
80
70
60
50
40
30
20
10
0
January 2020 April 2020 May 2020 August 2020 November January 2021 April 2021 August 2021 October 2021 January 2022 April 2022
2020
Figure 2b Per cent of Australians who have a great deal or quite a lot of confidence in
relevant state/territory government
80
70
60
50
40
30
20
10
0
January 2020 April 2020 May 2020 August 2020 November January 2021 April 2021 August 2021 October 2021 January 2022 April 2022
2020
Note: The “whiskers” on the lines indicate the 95 per cent confidence intervals for the estimate.
Source: ANUpoll: January, April, May, August, and November 2020; January, April, August and October
2021; and January and April 2022
5
The ANU Centre for Social Research and MethodsViews on policy and politics on the eve of the 2022 Federal Election
Figure 2c Per cent of Australians who have a great deal or quite a lot of confidence in
the public service
80
70
60
50
40
30
20
10
0
January 2020 April 2020 May 2020 August 2020 November January 2021 April 2021 August 2021 October 2021 January 2022 April 2022
2020
3 Views on vaccine policy
One of the key responsibilities of government over the last 12-18 months has been ensuring
availability and widespread uptake of COVID-19 vaccines. The Australian Government linked
the achievement of very high vaccination rates with the easing or lifting the various public
health restrictions including the ‘opening’ of internal and external borders. Initially, Australia
lagged other comparable countries in vaccine availability (and hence vaccinations), including
but not limited to countries like the USA and the UK where vaccines were being manufactured.
However, by late 2021/early 2022 Australia had one of the highest rates of vaccination in the
world.
The delays in the vaccine roll-out undoubtedly delayed the easing or lifting of restrictions and
some people may have caught COVID-19 when they otherwise wouldn’t have, or may have
experienced worse symptoms. In the April 2021, August 2022, and April 2022 surveys,
respondents were asked ‘Do you think the process for individuals getting COVID-19 vaccines in
Australia is …’ with half of the respondents asked whether the process is going well and the
other half asked whether the process has been fair.
Figure 3a shows the responses for the question on whether the process has gone well, and
Figure 3b shows responses for whether the process has been fair. In both surveys in 2021, it
was estimated that more than one-in-five survey Australians thought the process was going
‘not at all well’ with less than five per cent of Australians estimated to be saying that it was
going very well. This distribution had been almost completely reversed by April 2022 when only
6.6 per cent of Australians were estimated to think the process had been going not at all well
compared to 23.7 per cent who thought it was going very well.
6
The ANU Centre for Social Research and MethodsViews on policy and politics on the eve of the 2022 Federal Election
Figure 3a Views on how well the vaccine process was going – April 2021 to April 2022
6.6
April 2022 14.4 55.3 23.7
21.5
August 2021 43.2 32.0 3.3
21.2
April 2021 42.5 32.7 3.6
0.0 10.0 20.0 30.0 40.0 50.0 60.0 70.0 80.0 90.0 100.0
Not at all well Not too well Somewhat well Very well
Source: ANUpoll: April and August 2021; and April 2022
During 2021, Australians were more inclined to think that the vaccine process was fair than to
think the process was going well. In April 2022, this was even more so the case. By this time,
43.0 per cent of respondents who were asked that question thought the process was very fair,
with a further 39.8 per cent who thought it was somewhat fair. This leaves only 8.5 per cent
who thought that the process was not too fair and 8.8 per cent who thought it was not at all
fair. This later percentage is somewhat higher than the similar figure in April 2021 (3.2 per
cent), but was lower than in August 2021 (12.4 per cent) during the third wave of extended
lockdowns that were then taking place in the south-east of the country.
7
The ANU Centre for Social Research and MethodsViews on policy and politics on the eve of the 2022 Federal Election
Figure 3b Views on how fair the vaccine process was going – April 2021 to April 2022
8.8
April 2022 8.5 39.8 43.0
12.4
August 2021 20.2 47.3 20.2
3.2
April 2021 11.1 53.3 32.4
0.0 10.0 20.0 30.0 40.0 50.0 60.0 70.0 80.0 90.0 100.0
Not at all fai r Not too fair Somewhat fair Very fair
Source: ANUpoll: April and August 2021; and April 2022
4 The impact of candidate qualifications and characteristics on
voting intentions
In a parliamentary system like Australia’s, people do not vote for parties or party leaders, but
rather the ordering of the candidates running in their particular electorate (of which there
were 151 as of the 2021 election). While it is not possible in a survey like ANUpoll with under
four thousand respondents to test voting intentions for each particular electorate let alone
each individual candidate, it is possible to measure people’s stated views on their willingness
to vote for candidates with particular characteristics.
Utilising and adapting a standard survey question (from Gallup2), the April 2022 ANUpoll posed
the following question to respondents (with bold as indicated in the online version):
Between now and the 2022 Federal election, there will be discussion about the qualifications
and characteristics of political candidates – their education, age, religion, race and so on.
If the party you would normally vote for nominated a generally well-qualified person who
happened to have the following characteristics, how likely would you be to vote for that
person?
The characteristics asked about are:
a) A woman
b) A man
8
The ANU Centre for Social Research and MethodsViews on policy and politics on the eve of the 2022 Federal Election
c) Born in Australia
d) Born overseas
e) An Aboriginal or Torres Strait Islander
f) Gay or lesbian
g) Under the age of 40
h) Over the age of 70
i) A Muslim
j) An Atheist
k) An Evangelical Christian
The response options are very likely, somewhat likely, not very likely, and not at all likely. Figure
4 shows the per cent of respondents who said they would be very likely to vote for a candidate
with the particular characteristic (grey bars) as well as the per cent who said they would be
either not very likely or not at all likely (hollow bars). The characteristics are ordered by the
proportion of respondents who say they would be very likely to vote for a candidate with that
characteristic, though it should be noted that the order the characteristics was presented was
randomised in the survey.
In interpreting the data it is important to bear in mind that there may be some social
desirability bias in some of the responses and that the impact of candidate characteristics on
the likelihood of the respondent voting for a candidate with this characteristic may differ to
their response to the survey question.
The candidate characteristic that has the greatest positive support (and lowest negative
support) is being born in Australia with 53.6 per cent of respondents saying they would vote
for a candidate with those characteristics (all else being equal) and only 4.0 per cent saying
they would be not very or not at all likely to. By comparison, only 33.3 per cent of respondents
said they would be very likely to vote for a person born overseas, with 19.4 per cent saying
they would be not very or not at all likely to.
The sex of the candidate also appears to matter. There is a significantly higher per cent of
respondents who say they would be very likely to vote for a woman (52.8 per cent) than a man
(43.4 per cent). While there may be some effect of social desirability, the self-complete nature
of the survey is likely to reduce this. The survey results give strong support for the notion that,
despite making up less than half of parliamentarians, women candidates are as outwardly
supported as men, and perhaps even more so.
Aboriginal and Torres Strait Islander Australians are under-represented in parliament and have
slightly lower support. Gay or lesbian candidates can often experience discrimination and also
have slightly lower support according to the ANUpoll survey results.3 However, there is still
quite high support for Aboriginal and Torres Strait Islander Australians and gay or lesbian
candidates with 42.0 per cent and 40.4 per cent of respondents saying they would be very
likely to vote accordingly. A nuance to the finding for a gay and lesbian candidate is the higher
per cent of Australians who said they would be not likely to not at all likely to vote for a
candidate with those characteristics (18.0 per cent). So, while most respondents are
supportive of a gay or lesbian candidate, there is still a sizable minority that may be resistant.
If ethnicity and sexuality does not appear to matter that much for candidate choice, age
certainly appears to. There is lower support for a candidate under the age of 40 (37.9 per cent
very likely and 12.5 not very or not at all likely) compared to a generic male or female
9
The ANU Centre for Social Research and MethodsViews on policy and politics on the eve of the 2022 Federal Election
candidate. However, the lowest level of support amongst all the characteristics in the survey
was for a candidate over the age of 70. Only 14.6 per cent of respondents said they would vote
for a candidate of that age, compared to 49.2 per cent who said they would be not very or not
at all likely.
Finally, there are large differences by the religion of the hypothetical candidate. Of the three
religious identifications considered, there was the greatest support for an Atheist, with 39.2
per cent of respondents saying they would be very likely to vote for an Atheist candidate and
18.6 per cent saying they would be not very or not at all likely. Only a little over one-quarter
(27.1 per cent) of respondents said that they would be very likely to vote for a Muslim
candidate, with the lowest level (18.0 per cent) being for an Evangelical Christian. Interestingly,
this ordering is completely reversed in the US survey that we based our questions on, with the
greatest level of support for an Evangelical Christian and the lowest support for an Atheist (and
a Muslim candidate somewhere in between).
Figure 4 Support for hypothetical candidate according to their characteristics, April 2022
Very likely Not very li kely/Not at all likely
Born in Australia 53.6
4.0
A woman 52.8
4.5
A man 43.4
6.2
An Aboriginal or Torres Strait Islander 42.0
12.5
Gay or lesbian 40.4
18.0
An Atheist 39.2
18.6
Under the age of 40 37.9
12.5
Born overseas 33.3
19.4
A Muslim 27.1
33.3
An Evangelical Christian 18.0
46.5
Over the age of 70 14.6
49.2
0.0 10.0 20.0 30.0 40.0 50.0 60.0
Note: The “whiskers” on the bars indicate the 95 per cent confidence intervals for the estimate.
Source: ANUpoll: April 2022
4.1 Factors associated with candidate support
This section reports the results of a regression analysis of the association between the
characteristics of respondents and how likely they said they would be to vote for a hypothetical
candidate with the different characteristics as about. For each hypothetical candidate asked
about the factors associated with how likely the respondent said they would be to vote for a
10
The ANU Centre for Social Research and MethodsViews on policy and politics on the eve of the 2022 Federal Election
candidate with this characteristic is estimated. Because the dependent variable takes one of
four values (very likely, likely, not very likely or not at all likely an ordered probit model is
estimated. The explanatory variables include demographic and socioeconomic characteristics
of the respondent. In the regression model higher values for the dependent variable
representing a higher self-reported likelihood for a candidate with the particular characteristic
being asked about.
The results of the regression model are reported in Table 1. For the most part people are more
likely to vote for candidates that are like themselves. However, the strength of this association
differs across the different characteristics, and there is also an association with seemingly
unrelated characteristics.
Reading across Table 1, females are more likely to say they would vote for a female candidate.
Females were not, however, any more or less likely to say that they would vote for a male
candidate. The respondent’s sex is also associated with the likelihood of voting for a person
with a range of other characteristics, with females more likely than a man to say they would
vote for a candidate born in Australia or overseas, an Aboriginal or Torres Strait Islander, a gay
or lesbian candidate, and a Muslim candidate.
For the most part, older Australians report a greater willingness than younger Australian’s to
vote for hypothetical candidates with the characteristics considered in the survey. This includes
a greater willingness to vote for a woman, someone born overseas, a Muslim an Atheist and
an Evangelical Christian. Older Australians are also significantly more likely to say that they
would vote for someone over the age of 70. Younger Australians, particularly those aged 18 to
24, are less likely to say that they will vote for someone over the age of 70 but, apart from
being more likely to vote for a Muslim candidate, are not that different from respondents in
the middle part of the age distribution.
Aboriginal and Torres Strait Islander Australians are more likely to say that they would vote for
an Aboriginal and Torres Strait Islander candidate, as one might expect. However, there was
also an association between the Indigenous status of respondents and their voting preferences
with regards to some other characteristics. Aboriginal and Torres Strait Islanders are less likely
to say they would vote for someone born overseas (compared to non-Indigenous
respondents).
There does not appear to be much a difference in preference for particular candidates
between those who were born in Australia and those who were born overseas in an English-
speaking country with the (not surprising) exception of being more likely to say they would
vote for a person born overseas. There are, however, large differences in voting preferences
between those who were born overseas in a non-English speaking country and those other
two groups. Specifically, those born overseas in a non-English speaking country are less likely
to say they would vote someone born in Australia or a gay or lesbian candidate, but more likely
to say they would vote for an Evangelical Christian.
Language spoken at home also matters, with those who speak a language other than English
being less likely to vote for a woman or a man, someone born in Australia, an Aboriginal or
Torres Strait Islander candidate, a gay or lesbian candidate, someone under the age of 40, or
an Atheist.
A candidate’s education level is also predictive of some aspects of voting choice. Those with
low levels of education (that is, have not completed Year 12) are less likely to say they would
11
The ANU Centre for Social Research and MethodsViews on policy and politics on the eve of the 2022 Federal Election
vote for someone born overseas, an Aboriginal or Torres Strait Islander candidate, a gay or
lesbian candidate, a Muslim or an Atheist. They are, however, more likely to say they would
vote for an Evangelical Christian. Degree qualifications also have an impact with a positive
association with willingness to vote for a woman, someone born overseas, or an Aboriginal or
Torres Strait Islander candidate.
Interestingly, someone with a trade qualification (Certificate III or IV) is more likely to say they
would vote for an Evangelical Christian compared with someone with no qualifications at all.
The area in which a person lives does not appear to have a consistent association with
candidate preference. Living outside of a capital city (which tends to be more rural) does not
have any association with preference for the particular candidate types. There is also no
association with the socioeconomic characteristics of the area. Of course, there may be
different voting preferences across areas because of the distribution of the other
characteristics in the model (for example, respondents born overseas being more likely to live
in capital cities). However, there does not appear to be a direct association with location,
controlling for these characteristics.
The characteristics discussed already are all questions asked as part of the profiling for the Life
in AustraliaTM panel, and have been used extensively as explanatory variables for our COVID-
19 Impact Monitoring series. The last three variables in the model, on the other hand, were
asked specifically in the April 2022 survey. Specifically, we asked respondents ‘Do you currently
identify as LGBTQIA+?, with further information given that ‘This term refers to a person who
identifies as lesbian, gay, bisexual, transgender, queer / questioning, intersex, asexual, or other
terms (such as pansexual).’ We estimate that 9.7 per cent of adult Australians identify as
LGBTQIA+.4
We also asked respondents ‘Do you consider yourself as belonging to any particular religion or
denomination?’ with 35.5 per cent of respondents saying that they did. Finally, we asked
respondents ‘Regardless of whether you belong to a particular religion, how religious would
you say you are?’ Respondents were asked ‘Please answer using a scale from 0 to 10 where 0
means not at all religious and 10 means very religious’ with an average value of 3.20, a median
value of 2, and the modal response (given by 34.9 per cent of Australians) being 0.
These variables appear to have a significant association with candidate preference. Those who
identify as LGBTQIA+ are more likely to say that they would vote for a gay or lesbian candidate,
but they are also more likely to say they would vote for a woman, someone born overseas, an
Aboriginal and Torres Strait Islander candidate, someone under the age of 40, a Muslim and
an Atheist, but less likely to say they would vote for an Evangelical Christian candidate.
Belonging to a particular religion appears to have less of an association than self-reported
religiosity, though those who do belong to a particular religion are less likely to say they would
vote for an Atheist and more likely to say they would vote for an Evangelical Christian. Self-
reported religiosity is quite predictive of voting preferences, with high religiosity associated
with a lower likelihood of voting for a woman (and a man, but with a smaller coefficient),
someone born in Australia but even more so someone born overseas, an Aboriginal or Torres
Strait Islander candidate, a gay or lesbian candidate, someone under the age of 40, a Muslim
and an Atheist. Higher religiosity was associated, however, with a higher probability of voting
for an Evangelical Christian.
12
The ANU Centre for Social Research and MethodsViews on policy and politics on the eve of the 2022 Federal Election
5 Views on policy priorities
There are a range of policy areas that a national government could focus on. However, it is not
possible for all areas to take on equal importance and receive the same amount of policy
attention. Trade-offs need to be made. The April 2022 ANUpoll asked respondents ‘How much
of a priority should each of these following be for the Federal government to address this
year?’ across 22 policy areas (see Figure 5) with four response options:
• Top priority
• Important but lower priority
• Not too important
• Should not be done
This question is very similar to a question asked in the United States (US) in January 2022 by
the Pew Research Center.5
5.1 Top policy priorities for Australians
The order in which the policy areas were presented was randomised, and Figure 5 shows the
estimated proportion of adult Australian’s who think that particular policy areas was a ‘top
priority’, ordered from the highest to lowest priorities. The policy area that the highest
proportion of Australians see as being a top priority is ‘reducing the cost of living’ (64.7 per
cent of Australians). The only other area which has more than 60 per cent support as a top
priority is ‘fixing the aged care system’ (60.1 per cent), There are four other areas that have
more than half the population supporting as being a top priority ‘Strengthening the nation’s
economy’ (54.4 per cent), ‘Reducing health care costs’ (53.5 per cent), ‘Dealing with global
climate change’ (52.8 per cent), and ‘Improving the educational system’ (51.6 per cent).
There are a number of areas of public policy which are not seen by the Australian public as
being of high priority. The lowest two are seen by less than a quarter of the Australian
population as being of top priority – ‘Dealing with the issue of immigration’ (22.3 per cent) and
‘Addressing issues around race in this country’ (24.8 per cent). Drug addiction is also seen as
being of low priority (26.6 per cent), with only a small proportion of Australians (27.2 per cent)
seeing reducing the budget deficit as being a top priority, despite the Federal Budget for
2022/23 being announced very close to data collection and having very large deficits by
historical standards.
Interestingly, only about a third (36.5 per cent) of Australian’s think that dealing with the
Coronavirus outbreak should be a top priority for government.
Two areas of public policy that make an interesting contrast are aged care and child care. We
asked respondents how high a priority it was to increase wages in both these systems, with the
results turning out quite differently. 43.2 per cent of Australians thought it a top priority to
increase wages in aged care, whereas only 29.8 per cent said the same regarding child care
wages. This is despite both having similar average hourly wages and qualification
requirements. The difference in support for a wage increase may reflect the recent policy
attention on aged care due to the Royal Commission and deaths due to COVID-19 outbreaks,
and a recognition of the generally very difficult working conditions in aged care.
The final policy area that has low prioritisation (under one-third support) is ‘Strengthening the
Australian military’, with only 28.9 per cent of Australians identifying this area as a top priority.
This low level of support is despite the ongoing war in Ukraine, as well as the significant defence
spending announced prior to and within the 2022/23 Federal Budget.
13
The ANU Centre for Social Research and MethodsViews on policy and politics on the eve of the 2022 Federal Election
Figure 5 Per cent of Australians who reported policy areas as a ‘top priority’ – April 2022
Reducing the cost of living 64.7
Fixing the aged care system 60.1
Strengthening the nation’s economy 54.4
Reducing health care costs 53.5
Dealing with global climate change 52.8
Improving the educational system 51.6
Increasing wages within the aged care system 43.2
Dealing with the problems of poor people 42.2
Improving disaster relief 40.2
Reducing crime 40.0
Improving the job situation 39.6
Improving the way the political system works in Australia 38.8
Dealing with the coronav irus outbreak 36.5
Defending the country from future terrorist attacks 36.1
Addressing issues within the criminal justice system 35.2
Dealing with global trade issues 33.9
Increasing wages within the child care system 29.8
Strengthening the Australian mili tary 28.9
Reducing the budget deficit 27.2
Dealing with drug addiction 26.6
Addressing issues around race i n this country 24.8
Dealing with the issue of immigration 22.3
0.0 10.0 20.0 30.0 40.0 50.0 60.0 70.0 80.0
Note: The “whiskers” on the bars indicate the 95 per cent confidence intervals for the estimate.
Source: ANUpoll: April 2022
5.2 Comparisons with the USA
Of the 18 policy areas asked about in the US survey conducted in January 2022, 17 were
included in the April 2022 ANUpoll.6 Figure 6 gives the Australian and US figures alongside each
other, ordered by the difference between the two countries (higher priority in the US at the
top, higher priority in Australia at the bottom).
There was only one policy area that Australians saw as being a significantly higher priority than
their American counterparts – Dealing with global climate change (53 per cent compared to
42 per cent respectively). This is despite, or perhaps because of, the US administration making
climate change a point of difference between it and the Republican opposition, whereas the
Australian Opposition and the Greens party highlighting the perceived lack of action on climate
change by the Australian government. There are two other areas where support is not
significantly different across the two countries (‘Dealing with the problems of poor people’ and
‘Dealing with global trade issues’).
14
The ANU Centre for Social Research and MethodsViews on policy and politics on the eve of the 2022 Federal Election
For all other policy areas, American adults saw the policy area as a higher priority than
Australian adults. The area with the greatest difference between the US and Australia is
‘Dealing with the issue of immigration’ with almost half (49 per cent) of American adults saying
that it was a top priority compared to less than a quarter (22 per cent) of Australians saying it
was. Although the US receives a much greater absolute number of migrants in a given year, as
a share of the resident population Australia had a much higher net migration rate in most of
the years leading up to the Coronavirus pandemic (Figure 7). It may be that the slowdown in
migration during the COVID-19 pandemic (which was greater in Australia compared to the US)
lessened immigration as an issue of salience in Australia. However, it is perhaps more likely
that the greater control and selection of migrants in Australia means that immigration is seen
as less of an issue.
There was also a big difference in views about whether dealing with the Coronavirus is a top
priority with 60 per cent of Americans thinking it is a top priority compared to 36 per cent of
Australians. This perhaps reflects the higher vaccination rate in Australian, stronger social
safety net and public health system.
15
The ANU Centre for Social Research and MethodsViews on policy and politics on the eve of the 2022 Federal Election
Figure 6 Per cent of Australians and Americans who reported policy areas as a ‘top
priority’ – April 2022 and January 2022 respectively
Australia (April 2022) US (January 2022)
Dealing with the issue of immigration 22
49
Dealing with the coronav irus outbreak 36
60
Defending the country from future terrorist attacks 36
55
Reducing the budget deficit 27
45
Strengthening the nation’s economy 54
71
Improving the way the political system works in Australia 39
52
Improving the job situation 40
52
Addressing issues around race i n this country 25
37
Reducing crime 40
52
Addressing issues within the criminal justice system 35
45
Strengthening the Australian mili tary 29
37
Reducing health care costs 53
61
Improving the educational system 52
58
Dealing with drug addiction 27
31
Dealing with the problems of poor people 42
44
Dealing with global trade issues 34
35
Dealing with global climate change 53
42
0 10 20 30 40 50 60 70 80
Note: The “whiskers” on the bars for the Australian figures indicate the 95 per cent confidence
intervals for the estimate.
Source: ANUpoll: April 2022; Pew Research Center American Trends Panel: January 2022
16
The ANU Centre for Social Research and MethodsViews on policy and politics on the eve of the 2022 Federal Election
Figure 7 Net migration rate – Australian and the USA, 1955 to 2020
6 Voting intentions
After answering the question about satisfaction with direction of the country (reported in
Section 2), respondents were asked ‘If a federal election for the House of Representatives was
held today, which one of the following parties would you vote for?’ Figure 8 shows the per
cent of Australians who said they would vote for each of the three major parties in January
2022 and April 2022, as well as the per cent of Australians who said they would have voted for
another party (which includes an independent candidate) and the per cent who didn’t know
who they would vote for.
The figure shows a fair degree of stability over the period. In the opening two weeks of the
2022 election campaign, the per cent of Australians who said they would vote for Labor was
significantly higher than the per cent who said they would vote for the Coalition, though the
difference was slightly smaller than in January 2022. Furthermore, neither of the changes
between January 2022 and April 2022 for the two major parties were statistically significant.
There were greater levels of change for the Greens and for ‘other parties’, with a higher per
cent of Australians saying they would vote for them in April 2022 compared to January 2022.
The per cent of our sample who said they would vote for the Greens increased from 14.2 per
cent to 16.2 per cent and the per cent who said they would vote for another party increasing
slightly (but not significantly) from 10.3 to 11.4 per cent.
Although we do not use ANUpoll to calculate two-party preferred voting or to predict the
outcome of the election, the data suggests greater support for Labor compared to the
17
The ANU Centre for Social Research and MethodsViews on policy and politics on the eve of the 2022 Federal Election
Coalition, and the outcome of the election potentially influenced by where people allocate
their second, third, or other preferences.
Figure 8 Voting intentions in January and April 2022 if an election were held that day
45.0
40.0
35.0
30.0
25.0
20.0
36.3
34.3
15.0 31.5 31.2
10.0
16.2
14.2
5.0 10.3 11.4
5.7 5.6
0.0
Coalition Labor Greens Other party Don't know
(including
independent)
January 2022 April 2022
Note: The “whiskers” on the bars indicate the 95 per cent confidence intervals for the estimate.
Source: ANUpoll: January and April 2022
Figure 9 tells the longer-term story about changes in voting intention with regards the major
two parties. Since January 2020, during the Black Summer bushfire crisis and just prior to the
spread of COVID-19 in Australia, we have asked about voting intentions six times (including the
April 2022 survey). The figure shows that just prior to the pandemic in Australia, a roughly
equal proportion of adult Australians would have voted for the Coalition and Labor if an
election was held on that day. By January 2021, at a time of very few COVID-19 restrictions or
cases in Australia, 39.9 per cent of Australians said that they would vote for the Coalition
compared to 33.4 per cent who said they would vote Labor.
The gap between the two parties narrowed between January and August 2021 (when
vaccination rates lagged well behind other countries), and had essentially disappeared by
October 2021 (as the COVID-19 restrictions in the south-east of the country had only started
to be eased). There was a large increase in voting intentions for Labor between October 2021
and January 2022, with commensurate declines in voting intentions for the Coalition. This is
followed by the slight narrowing up until April 2022 documented and discussed earlier.
18
The ANU Centre for Social Research and MethodsViews on policy and politics on the eve of the 2022 Federal Election
Figure 9 Per cent of adult Australians who would have voted for one of the two major
parties, January 2020 to April 2022
Coalition Labor
45.0
40.0
35.0
30.0
25.0
20.0
15.0
10.0
5.0
0.0
January 2020 January 2021 August 2021 October 2021 January 2021 April 2022
Note: The “whiskers” on the lines indicate the 95 per cent confidence intervals for the estimate.
Source: ANUpoll: January 2020; January, August and October 2021; and January and April 2022
6.1 Flows in voting intentions
There was a fair degree of stability between a person’s stated voting intention in January 2022
and their intention in April 2022 (Figure 10).7 Only 26.0 per cent of respondents said they
would have voted for a different party in April compared to January 2020 (a period of three-
months). By way of comparison, 33.9 per cent of respondents changed who they said they
would vote for between October 2021 and January 2022 (also a period of three- months).
There was a slightly greater degree of stability in voting intentions amongst those who said
they would vote for the Coalition in January 2022 compared to people who intended to vote
for another party. 79.4 per cent of those who said they would vote for the Coalitions in January
2022 also said they would vote for the Coalition in April 2022, compared to 74.6 per cent for
those who said they would vote for Labor in January 2022. There were large flows away from
the don’t know or undecided voters, with only half of those who did not know who they would
vote for when asked in January 2022 saying they did not know who they would vote for when
asked in April 2022.
19
The ANU Centre for Social Research and MethodsViews on policy and politics on the eve of the 2022 Federal Election
Figure 10 Change in voting intentions between January and April 2022
Source: ANUpoll: January and April 2022
6.2 Policy priorities and voting preference
Figure 11 shows that those who intend to vote for the Coalition have quite different policy
priorities than those who intend to vote for Labor. Specifically, the figure shows the proportion
of respondents who think the policy area is a top priority (as is reported in Figure 6) with
percentages reported separately for those who would have voted for the Coalition or Labor.
The areas are ordered by the difference between Coalition and Labor voters with areas at the
top seen as a greater priority by Coalition voters and those at the bottom a greater priority by
Labor voters.
Coalition voters are far more likely to see defence, the economy, and crime as priority issues,
with Labor voters more likely to see climate change, poverty, child care, and disaster relief as
priority issues. What is perhaps as interesting are the areas where there are no significant
differences between voters for the two major parties. This includes drug addiction,
immigration, jobs, and health care costs, all of which have an difference of 5 percentage points
or less.
20
The ANU Centre for Social Research and MethodsViews on policy and politics on the eve of the 2022 Federal Election
Figure 11 Per cent of Australians who reported policy areas as a ‘top priority’ by voting
intention – April 2022
Coalition Labor
Defending the country from future terrorist attacks 53.7
28.2
Strengthening the Australian mili tary 45.2
21.6
Strengthening the nation’s economy 69.9
52.1
Reducing crime 51.5
35.1
Reducing the budget deficit 35.7
22.1
Dealing with global trade issues 44.3
31.7
Addressing issues within the criminal justice system 39.2
31.1
Dealing with drug addiction 30.2
25.4
Dealing with the issue of immigration 24.5
21.7
Improving the job situation 38.5
40.5
Reducing health care costs 51.4
56.1
Improving the educational system 48.3
54.6
Dealing with the coronav irus outbreak 35.1
42.5
Improving the way the political system works in Australia 32.9
40.3
Fixing the aged care system 55.6
63.9
Increasing wages within the aged care system 39.1
47.6
Reducing the cost of living 60.8
69.2
Improving disaster relief 33.5
43.2
Addressing issues around race i n this country 14.8
26.1
Increasing wages within the child care system 21.8
36.1
Dealing with the problems of poor people 31.1
47.2
Dealing with global climate change 30.5
64.6
0.0 10.0 20.0 30.0 40.0 50.0 60.0 70.0 80.0
Note: The “whiskers” on the bars indicate the 95 per cent confidence intervals for the estimate.
Source: ANUpoll: April 2022
21
The ANU Centre for Social Research and MethodsViews on policy and politics on the eve of the 2022 Federal Election
6.3 Candidate characteristics and voter preference
In addition to differences in the policy focus of parties, voters are likely to be influenced by the
characteristics of the local candidates that they actually vote for, as well as senior members of
the party (particularly the leader of the party). Figure 12 looks at support for a hypothetical
candidate based on the party they said they would vote for if an election was held at the time
of the survey. The candidate characteristics are ordered by the difference between Coalition
and Labor voters.
There is only one “type” of candidate that a Coalition voter has a higher probability of saying
they would be very likely to support – an Evangelical Christian. There are three characteristics
where there are no differences – Over the age of 70, Born in Australia and a Man – with the
remaining seven characteristics more likely to be supported by Labor voters compared to
Coalition voters. The two biggest differences are for an Atheist, with 44.5 per cent of Labor
voters saying they are very likely to vote for an Atheist compared to 27.5 per cent of Coalition
voters and for a gay or lesbian candidate with 46.7 per cent of Labor voters saying they are
very likely to vote for a gay or lesbian candidate compared to 28.2 per cent of Coalition voters.
It is interesting to note that 57.9 per cent of Labor voters said they were very likely to vote for
a woman candidate compared to 44.2 per cent of Coalition voters. Indeed Coalition voters are
slightly (though not statistically significantly) more likely to say that they are very likely to vote
for a man compared to a woman, whereas there is a 13.8 percentage point difference (in
favour of a woman candidate) for Labor voters.
In the current Parliament, there are far more Labor members who are female compared to
Coalition members. It is unclear which way the causal direction runs, and whether support is
driven by the candidates on offer or whether the parties chose their candidates based on the
expected support. However, the data clearly shows that, with regards to gender at least, the
preferences for hypothetical candidates correlates very closely across parties with the
distribution of actual candidates.
22
The ANU Centre for Social Research and MethodsViews on policy and politics on the eve of the 2022 Federal Election
Figure 12 Per cent of Australian who say they would be very likely to support a
hypothetical candidate according to the characteristics of the candidate by
voter preference, April 2022
Coalition Labor
An Evangelical Christian 25.0
15.3
Over the age of 70 13.2
14.5
Born in Australia 53.5
56.2
A man 43.3
46.6
Born overseas 26.7
37.2
A Muslim 19.7
31.0
Under the age of 40 30.1
42.6
An Aboriginal or Torres Strait Islander 31.7
45.2
A woman 44.2
57.9
An Atheist 27.5
44.5
Gay or lesbian 28.2
46.7
0.0 10.0 20.0 30.0 40.0 50.0 60.0
Note: The “whiskers” on the bars indicate the 95 per cent confidence intervals for the estimate.
Source: ANUpoll: April 2022
7 Concluding comments
Australian’s satisfaction with the direction of the country and confidence in key institutions is
well down on the peaks observed during the COVID-19 period. The institutions that has
experienced the greatest decline is the Federal Government in Canberra, though confidence
in the public services and state/territory governments is also lower than what it was during
early to mid-2020.
Australians seem more positive about the vaccine roll-out in Australian than they were during
2021, when supply and access issues meant that many people who wanted to get vaccinated
were not able to. By early 2022, almost all Australians who wanted to get vaccinated (or
boosted) were able to with Australia having one of the highest vaccination rates of vaccines
shown to be effective. It is demand, not supply that explains why some people are yet to be
vaccinated in Australia.
While this success with vaccination should be a positive for incumbent governments across
Australia, data presented in this paper show that dealing with the COVID-19 outbreak is now
seen to be less of a priority than it might have been in the last two years, compared to other
countries, and compared to other policy areas. In particular, cost of living pressures, ongoing
23
The ANU Centre for Social Research and MethodsViews on policy and politics on the eve of the 2022 Federal Election
crises in aged care, health care costs, and climate change are seen by more people as being a
top priority. These aren’t policy areas that are traditionally associated with the Coalition
government, explaining in part why the primary vote for the Coalition continues to trail that of
the Labor, and why the Greens party appears to have a much higher level of support than it
has in years.
All of this means that, at the midway point of the 2022 election campaign, the Labor party is in
an election winning position, and voter preference would have to change for the Morrison
government to be re-elected. Another key finding in this paper points to challenges for the
government, in that Australians seem quite willing to vote for women candidates over men,
with the Labor party having a far higher percentage of sitting members who are women.
None of this means that it is guaranteed that Anthony Albanese will be the next Prime Minister,
as what matters in an election is seat by seat voting, preference flows, and the ultimate
decision of undecided voters. However, the data suggests a very challenging few weeks for
Scott Morrison if he is to stay on as Prime Minister.
24
The ANU Centre for Social Research and MethodsViews on policy and politics on the eve of the 2022 Federal Election
Appendix 1 About the survey
Data collection for the April 2022 ANUpoll commenced on the 11th of April 2022 with a pilot
test of telephone respondents. The main data collection commenced on the 12th of April and
concluded on the 26th of April. The final sample size for the survey is 3,587 respondents. 57.1
per cent of the sample had completed the survey by the 14th of April and the average interview
duration was 20.3 minutes.
The Social Research Centre collected data online and through Computer Assisted Telephone
Interviewing (CATI) in order to ensure representation from the offline Australian population.
Around 3.4 per cent of interviews were collected via CATI. The contact methodology adopted
for the online Life in Australia™ members is an initial survey invitation via email and SMS
(where available), followed by multiple email reminders and a reminder SMS. Telephone follow
up of panel members who have not yet completed the survey commenced in the second week
of fieldwork and consisted of reminder calls encouraging completion of the online survey. The
contact methodology for offline Life in Australia™ members was an initial SMS (where
available), followed by an extended call-cycle over a two-week period. A reminder SMS was
also sent in the second week of fieldwork.
A total of 4,364 respondents were invited to take part in the survey, leading to a wave-specific
completion rate of 82.1 per cent. Taking into account recruitment to the panel, the cumulative
response rate for this survey is around 6.8 per cent. Of those who had completed the April
2022 survey, 2,424 respondents (67.6 per cent) had completed the January 2022 survey
Unless otherwise stated, data in the paper is weighted to population benchmarks. For Life in
Australia™, the approach for deriving weights generally consists of the following steps:
1. Compute a base weight for each respondent as the product of two weights:
a. Their enrolment weight, accounting for the initial chances of selection and
subsequent post-stratification to key demographic benchmarks
b. Their response propensity weight, estimated from enrolment information
available for both respondents and non-respondents to the present wave.
2. Adjust the base weights so that they satisfy the latest population benchmarks for
several demographic characteristics.
The ethical aspects of this research have been approved by the ANU Human Research Ethics
Committee (2021/430).
25
The ANU Centre for Social Research and MethodsViews on policy and politics on the eve of the 2022 Federal Election
Appendix 2 Regression Tables
Table 1 Factors associated with preferences for candidate characteristics, April 2022
Candidate characteristics (dependent variables)
Woman Man Born in Australia Born overseas
Explanatory variables Coeff. Signif. Coeff. Signif. Coeff. Signif. Coeff. Signif.
Female 0.304 *** -0.045 0.182 *** 0.100 **
Aged 18 to 24 years 0.141 -0.154 0.020 0.119
Aged 25 to 34 years -0.077 -0.254 *** -0.045 0.066
Aged 45 to 54 years 0.049 -0.041 0.027 0.064
Aged 55 to 64 years 0.088 0.017 0.023 0.235 ***
Aged 65 to 74 years 0.304 *** 0.169 * 0.229 ** 0.374 ***
Aged 75 years plus 0.307 ** 0.172 0.175 0.454 ***
Indigenous -0.212 -0.269 0.073 -0.450 **
Born overseas in a main English-speaking country 0.047 0.073 -0.032 0.263 ***
Born overseas in a non-English speaking country -0.043 0.116 -0.269 *** 0.249 ***
Speaks a language other than English at home -0.344 *** -0.273 *** -0.197 ** -0.130
Has not completed Year 12 or post-school qualification -0.019 0.010 -0.139 -0.215 **
Has a post graduate degree 0.302 *** 0.131 -0.028 0.326 ***
Has an undergraduate degree 0.275 *** 0.119 0.016 0.217 ***
Has a Certificate III/IV, Diploma or Associate Degree 0.087 0.064 -0.038 0.028
Lives in the most disadvantaged areas (1st quintile) -0.036 -0.006 0.047 -0.086
Lives in next most disadvantaged areas (2nd quintile) 0.188 ** 0.095 0.118 0.058
Lives in next most advantaged areas (4th quintile) 0.020 -0.049 -0.036 0.106
Lives in the most advantaged areas (5th quintile) 0.095 0.033 0.030 0.099
Lives in another capital city -0.076 -0.065 -0.021 -0.060
LGBTQIA+ 0.295 *** -0.071 0.158 0.320 ***
Member of a particular religion or denomination 0.130 * 0.143 ** 0.203 *** 0.114 *
Self-reported religiosity -0.054 *** -0.027 ** -0.033 *** -0.045 ***
Cut-point 1 -2.149 -2.306 -2.368 -1.502
Cut-point 2 -1.599 -1.680 -1.811 -0.657
Cut-point 3 0.124 0.074 -0.084 0.695
Sample size 3,373 3,366 3,375 3,375
26
The ANU Centre for Social Research and MethodsViews on policy and politics on the eve of the 2022 Federal Election
Candidate characteristics (dependent variables)
Aboriginal or Torres Strait Islander Gay or lesbian Under the age of 40 Over the age of 70
Explanatory variables Coeff. Signif. Coeff. Signif. Coeff. Signif. Coeff. Signif.
Female 0.269 *** 0.364 *** 0.088 * 0.081 *
Aged 18 to 24 years 0.210 * 0.118 0.155 -0.424 ***
Aged 25 to 34 years 0.016 0.090 0.150 * -0.111
Aged 45 to 54 years 0.045 0.003 0.001 0.069
Aged 55 to 64 years 0.075 -0.003 0.020 0.125
Aged 65 to 74 years 0.180 ** 0.119 0.130 0.193 **
Aged 75 years plus -0.037 0.018 0.077 0.199 *
Indigenous 0.482 ** -0.005 0.010 -0.232
Born overseas in a main English-speaking country -0.017 0.046 0.066 -0.099
Born overseas in a non-English speaking country -0.049 -0.203 ** -0.086 -0.156 *
Speaks a language other than English at home -0.332 *** -0.240 *** -0.276 *** -0.041
Has not completed Year 12 or post-school qualification -0.218 ** -0.194 ** -0.171 * -0.139
Has a post graduate degree 0.084 0.158 0.015 -0.013
Has an undergraduate degree 0.131 * 0.108 0.095 -0.043
Has a Certificate III/IV, Diploma or Associate Degree -0.008 -0.029 -0.085 -0.081
Lives in the most disadvantaged areas (1st quintile) -0.084 -0.136 -0.033 0.029
Lives in next most disadvantaged areas (2nd quintile) 0.146 * 0.007 0.140 * 0.097
Lives in next most advantaged areas (4th quintile) 0.029 -0.020 0.089 -0.026
Lives in the most advantaged areas (5th quintile) 0.130 * 0.034 0.048 -0.023
Lives in another capital city 0.045 -0.008 0.027 -0.023
LGBTQIA+ 0.340 *** 0.710 *** 0.278 *** 0.110
Member of a particular religion or denomination 0.065 -0.103 -0.025 0.004
Self-reported religiosity -0.023 ** -0.069 *** -0.040 *** -0.012
Cut-point 1 -1.699 -1.636 -2.108 -1.254
Cut-point 2 -1.011 -1.072 -1.226 -0.106
Cut-point 3 0.396 0.213 0.287 0.981
Sample size 3,375 3,375 3,370 3,373
27
The ANU Centre for Social Research and MethodsYou can also read