China's Economic Impact on Canada - Trade, Investment, and Immigration
←
→
Page content transcription
If your browser does not render page correctly, please read the page content below

China’s Economic
Impact on Canada
Trade, Investment, and Immigration


Table of
Contents
             Executive Summary...........................................................................................................................1
             Introduction.........................................................................................................................................4
        1.   Bilateral Trade.................................................................................................................................. 6
       1.1   Economic Impact of Exporting to China................................................................................8
      1.2    Employment and Wage Effects of Exporting to China...................................................11
      1.3    Merchandise Trade......................................................................................................................... 13
   1.3.1     Canada China Interdependence...............................................................................................22
   1.3.2     Canadian Use of Chinese Imports/Inputs.............................................................................23
     1.4     “Spin-Off” Economic Impacts of Exporting: Canola Industry....................................25
      1.5    Services Trade.................................................................................................................................. 28
    1.5.1    Education........................................................................................................................................... 29
   1.5.2     Tourism................................................................................................................................................37
      1.6    Trade: Conclusion...........................................................................................................................40
     2.      Immigration.....................................................................................................................................42
     2.1     Notable Demographic and Regional Characteristics..................................................... 42
    2.2      GDP Impacts: Quantitative Analysis.......................................................................................46
   2.2.1     Results..................................................................................................................................................46
      3.     Canadian Investment in China..............................................................................................51
     3.1     Financial Sector................................................................................................................................52
   3.1.1     Insurance Companies....................................................................................................................52
   3.1.2     Public Pension Funds.....................................................................................................................53
    3.2      Retail and Service Industry Investment................................................................................ 56
    3.3      Manufacturing and Supply Chains...........................................................................................57
     4.      Chinese Investment in Canada........................................................................................... 60
    4.1      Indirect and Induced Impacts: Huawei................................................................................. 63
    4.2      Sectoral Characteristics of Chinese Investment in Canada........................................64
    4.3      Regional Breakdown of Chinese Investment.....................................................................66
      5. Conclusion........................................................................................................................................71
             APPENDIX: Trade, Immigration and Investment.............................................................. 74
             Endnotes............................................................................................................................................80

                                                                                                                                                                      i
ii

Executive
Summary
    Canada and China have a strong history of economic connection and, through
    its rise to prominence over recent decades, China has become Canada’s
    second most important national economic partner, after the United States.

    Given the many countries re-evaluating their relationships with China, weighing
    the benefits of engagement and the costs of diversifying or decoupling,
    this report aims to provide a comprehensive account of China’s role in the
    Canadian economy. The relationship between Canada and China is complex
    and nuanced. Some elements are easily quantifiable, while others must be
    explained qualitatively. Our goal is to provide an objective overview of the
    bilateral economic relationship to help policy makers and stakeholders better
    understand this important relationship, with data to aid evidence-based
    assessment and strategy development.

    This report, which focuses primarily on China-Canada trade, immigration, and
    investment, concludes that China has a significant impact on Canadian GDP,
    employment, and overall economic activity. In 2018, for example, the direct
    GDP impact of China-related exports, new immigration, and Canada-bound
    investment totalled $42.6 billion, $6.1 billion, and $9.4 billion, respectively. Given
    the overlaps in these figures, the cumulative GDP effect of measurable
    China-related impacts likely exceeded $55 billion.

    Several other aspects of the Canada-China relationship that also contribute to
    the Canadian economy, however, could not be directly quantified. These include
    access to competitive Chinese imports of consumer and producer (intermediate
    and capital) goods, investment flows from China, Canadian yields from
    investments in China, and the impact of second or higher generation Chinese
    immigrants. Imports from China are critical for many Canadian supply chains,
    particularly in the electrical equipment sector, and provide Canadian consumers
    with access to globally competitive goods and services.

                                                                                        1
In 2019, the total economic impact of exporting to China, a measure
of broad economic activity not accounted for in GDP, was estimated
at $76.9 billion, which is more than double the value of exports. This
translates to income for exporters, their suppliers, their employees, and the
places where that money is subsequently spent. Altogether, we estimate that
China-bound exports supported 365,915 jobs. These jobs were also found
to have a 4.5% wage premium relative to the Canadian average income,
amounting to $18 billion in wages for Canadians.

Similarly, the overall economic impact of Chinese investment in Canada
exceeded its reported $9.4 billion contribution to GDP in 2018. In the
same year, China invested an additional $2.3 billion in Canada, and Chinese
Multinational Enterprises (MNEs) generated $30.4 billion in revenue and $492
million in intellectual property in Canada. In 2018, existing and new Chinese
investments in Canada supported at least 46,295 jobs.

While there is some overlap between the impact of exports and Chinese
investment, due to some exporting by Chinese MNEs in Canada, Canadian
employment supported by Chinese investment and exports to China
likely exceeded 400,000 jobs in 2019. The corresponding wage effect also
exceeded $20 billion. The true number is likely greater, as these estimates
do not include jobs supported by Chinese imports, Chinese immigration, and
Canadian investment in China.

Notably, education exports to mainland China and Hong Kong surpassed
every goods export category tracked by Statistics Canada’s International
Merchandise Trade Database in 2019. Chinese students accounted for 26.2% of
the international student body, spent an estimated $5.72 billion in Canada, and
supported 57,000 jobs in the same year. The impact of Chinese immigration
on the Canadian economy is another important and developing aspect of
the bilateral economic relationship. Since 2011, the annual growth rate of
new Chinese immigrants’ GDP contribution has averaged 9%, far exceeding
Canada’s average annual GDP growth of 1.52% over the same period. The
associated GDP impact totalled $48.95 billion since 2011.

China’s significance to Canadians and Canadian business extends from
coast to coast. In terms of trade, British Columbia and Saskatchewan are
the provinces most reliant on the China market for their exports, while
Nova Scotia and Newfoundland and Labrador rank third and fourth. Alberta
and Ontario, on the other hand, have the highest and third highest stock of
Chinese investment in Canada. These are just two of many examples that
demonstrate China’s importance to every Canadian province and the need for
a comprehensive understanding of China across the country.

                                                                                2
Overall, the story of the Canada-China economic relationship is one of
strong ties and promising opportunities. In trade, for example, Canadian
merchandise exports to China increased by 50% between 2011 and 2020,
more than three times the export growth to all other countries, which
was just 16%. Furthermore, the development and exchange of knowledge,
skills, and cultural experience that occurs as a result of trade, immigration,
and investment can profoundly alter the business and societal landscape,
particularly in a trade-dependent economy like Canada’s. Canada’s and China’s
futures are inextricably linked, so understanding the dynamics and nuances
of this complex bilateral relationship is critical to charting a path forward that
best serves Canada's long-term interests.

                                                                                 3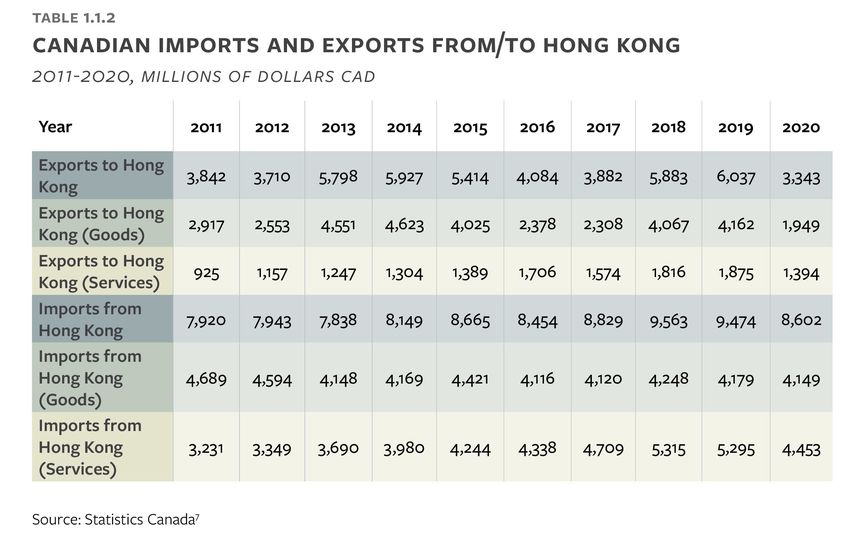
Introduction

    The year 2020 marked 50 years since Canada and China established diplomatic
    relations. While the frigid state of the bilateral relationship, along with the
    COVID-19 pandemic, suppressed the usual celebratory fanfare of such a
    diplomatic milestone, that milestone underscores the deep and long standing
    relationship between the two countries.

    The shared history of Canada and China extends far beyond 1970. The early
    flow of people, goods, and ideas from Canada to China and China to Canada
    predates even Canada’s creation in 1867.

    The Canada-China economic relationship is now well established and
    important. China is Canada’s second largest national trading partner, and third
    largest trading partner when considering the EU as a collective bloc. Billions
    of investment dollars flow across the Pacific between Canada and China and,
    prior to pandemic-related disruptions, hundreds of thousands of Chinese
    students and tourists chose Canada as their study or vacation destination.

    This report China’s Economic Impact on Canada - Trade, Investment, and
    Immigration aims to comprehensively assess the magnitude of the economic
    impact of China on Canada. It identifies and quantifies China’s economic
    impact on Canada at the national, regional, and sectoral levels, bringing
    together the various disparate elements of the economic relationship.

    The first section of this report examines goods and services trade. The second
    section assesses the impacts of immigration using the most recent publicly
    available data from Statistics Canada. The third section looks at investment,
    first at Canadian investments in Mainland China and Hong Kong and then at
    Canada-bound investment. The report utilizes data from the CIUA China-
    Canada Investment Tracker and Statistics Canada to quantify the flow of
    Chinese investment in Canada and assess its cumulative impact.

                                                                                  4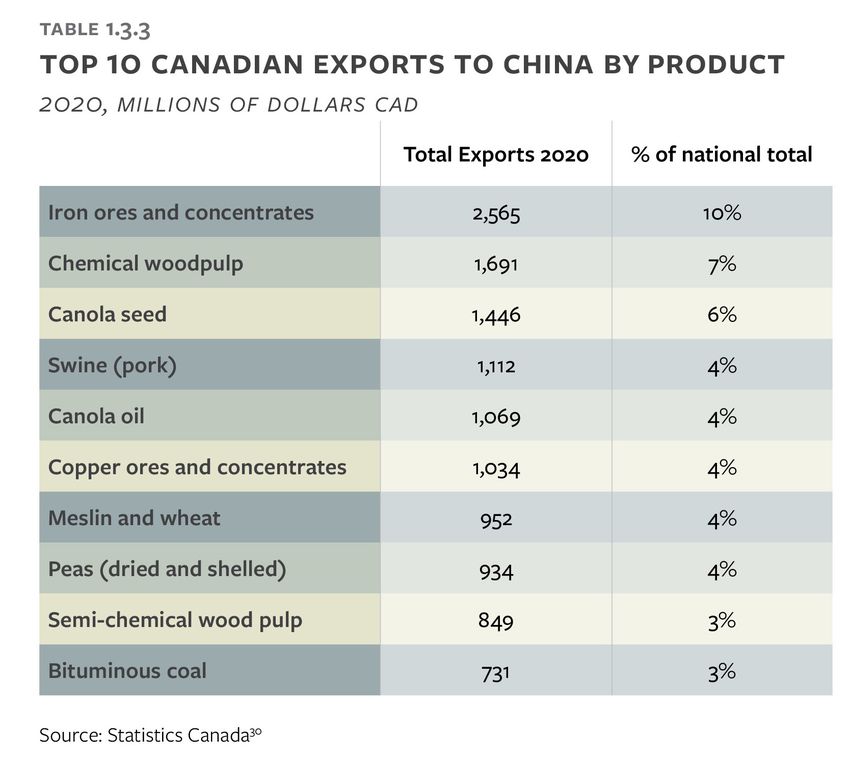
As an addendum to the core report, we will release two sub-reports focused
on Chinese companies operating in Canada and Canada-Hong Kong ties. The
former will be based on our Chinese Company Business Practices and Impacts
Survey and the latter will focus on Canada-Hong Kong economic ties and Hong
Kong’s role between Canada and mainland China.

Note that Statistics Canada reports Hong Kong data separately from mainland
China, which is reflected in many figures within this report.

                                                                          5
1
Bilateral
Trade

              background
              Canada is a country deeply reliant on trade. In 2018, the Canadian trade-to-GDP
              ratio, a metric used to measure the importance of international trade relative to
              the domestic economy, stood at 66%. This trails only Germany (87%) among G7
              economies, and also sits well ahead of Australia (43%) and New Zealand (56%).

              China is Canada’s largest single trading partner outside of the United States
              and the European Union. Bilateral trade with China is perhaps the most visible
              component of the broader Canada-China economic relationship. This, at times,
              has linked trade with political controversies, including when bilateral relations
                                                                            deteriorated in
                       between 2011 and 2020,                               late 2018, which
                                                                            contributed to
Canadian goods exports to China increased by                                trade disputes
 50 percent, while Canadian goods exports to                                involving Canadian
                                                                            canola, pork, and
   all other countries grew by only 16 percent                              beef. However, the
                                                                            key story regarding
              Canada-China trade is growth. Importantly, between 2011 and 2020, Canadian
              goods exports to China increased by 50 percent, while Canadian goods exports
              to all other countries grew by only 16 percent.

              Canadian trade with China consists of both merchandise (goods) and services.
              It is no surprise that China, the world’s “factory,” is a key supplier of goods
              that Canadian firms and consumers need. Canada imports large quantities of
              cell phones and electronics, children’s toys, and, more recently, facemasks and
              personal protective equipment (PPE) from China.2 China, conversely, is a leading
              buyer of Canadian canola, pork, coal, and iron ore, among other key exports.

                                                                                              6
400
350
300
250
200
150
100
50
0
US
A EU in a om pa
n ic o re
a ia
wa
y
ali
a
h d Ja x o In d r tr
dC in g Me hK No us
la n dK ut A
in e So
Ma U nit
400
350
300
250
200
150
100
50
0
US
A EU h in a xic
o
la n
d
pa
n
do
m
na
m
o re
a
on
g
dC Me ze
r Ja g t
hK
K
an it K in Vie ut ng
l Sw d So Ho
M ain nit
e
U
Source: Statistics Canada1
7Though less significant in magnitude than merchandise trade, Canada-China
trade in services is also an essential part of our economic relationship. Services
trade has grown considerably in recent years as inbound tourists and student
numbers swell and Canadian financial institutions expand their business in China.
1.1 economic impact of exporting
to china
We focus our analysis on Canadian exports, as this element of the Canada-
China trade relationship has a more tangible impact on Canadian economic
activity and GDP.3 Canadian imports from China are also presented and
discussed for reference, although the purchase of imported goods and
services does not have a direct impact on GDP.4,5 Imports do, however, have a
substantial impact on Canadian supply chains and consumers.
table 1.1.1
canadian imports and exports from/to mainland china
2011-2020, millions of dollars cad
Year 2011 2012 2013 2014 2015 2016 2017 2018 2019 2020
Exports (Total) 20,680 23,620 26,115 25,239 26,763 28,663 31,899 36,758 32,585 31,662
Exports to China
18,133 20,368 22,031 20,467 21,419 22,346 24,992 29,076 24,489 26,303
(Goods)
Exports to China
2,547 3,252 4,084 4,773 5,344 6,317 6,907 7,682 8,096 5,359
(Services)
Imports (Total) 30,716 33,041 34,090 37,941 41,521 40,289 45,401 49,435 50,206 51,937
Imports from
28,711 30,952 31,944 35,570 38,963 37,661 42,732 46,358 46,862 49,551
China (Goods)
Imports from
2,005 2,089 2,146 2,371 2,558 2,628 2,669 3,077 3,344 2,386
China (Services)
Source: Statistics Canada6
In 2020, the direct impact of goods and services exports to mainland China
and Hong Kong was worth $31.6 billion and $3.3 billion, respectively.8 The
overall direct GDP contribution of Canadian exports to China was $34.9 billion
in 2020. In 2019, the direct impact of total exports to mainland China and Hong
Kong amounted to $32.6 billion and $6.0 billion, respectively. The combined
total direct impact of Canadian exports to China in 2019 was $38.6 billion.9
8The above numbers, however, do not capture the true breadth of China’s
impact on Canada through trade. China’s direct spending on Canadian goods
and services is indirectly supported by Canadian companies within the supply
chain of exported products. The employee compensation derived from
this activity induces further spending within the economy. Therefore, the
total economic effect of trade comprises the direct company earnings on
exports, the earnings of companies that indirectly support export activity,
and the induced spending that occurs as a result of consequent employee
compensation. Together, this is known as the multiplier effect.
Given the diversity of industries and regions involved in Canada-China trade
it is complicated to produce an accurate estimate for the combined direct,
indirect, and induced effects. To calculate the total effects of Canadian
exports to China, we have retrieved Statistics Canada input/output multipliers
and Canada-China export statistics on an industry level.10 The following
subsections will address the total economic impact of Canadian exports to
China, the impact of exports on jobs and wages, the sectoral characteristics
and distribution of exports, the regional characteristics of exports, and various
qualitative issues surrounding exports to China. Finally, a case study on the
exporting canola industry will be presented to illustrate these economic
effects on an industry level.
9Note, this report will often present its findings for both 2019 and 2020.
However, in some cases, 2020 data has been skewed by the pandemic, making
it less representative of regular circumstances. Thus, 2019 numbers are
primarily used for point estimates.
total economic impact
Statistics Canada’s Industry Accounts Division calculates multipliers for
various economic activities as well as an all-encompassing “total industries”
multiplier on an annual basis.11 These multipliers indicate how much of a “spin-
off” (indirect + induced) effect is generated by specific (direct) economic
activities. To illustrate this effect, suppose a local company exports $10,000
of a specialty beverage in which apple juice is an input. To acquire the apple
juice the local company pays the juice manufacturer $5,000, who in turn pays
an orchard $2,000 for the actual apples. Furthermore, employees of all three
enterprises are paid to facilitate these business activities, with a portion of that
pay to the employees used to purchase other products amounting to $3,000.
When the specialty beverage is exported, the trade ledger records $10,000 in
export activity; however, the total economic impact generated by this export
is equal to the sum of all aforementioned transactions, which is $20,000.
Therefore, in this case, the total output multiplier would be equal to 2.
Given the complexity of modern supply chains and products, a complete
analysis of the total economic impact of activity in any sector would require
the application of several multipliers across different stages of the supply
chain. Due to the limited availability of detailed sectoral data and the scope of
this report, our industry level data analysis does not go this far, though it does
provide a detailed case study of the canola industry in Canada.
Instead, we calculate two estimates of the total economic impact of all
exports to China.12The first applies the “total industries” multiplier, which is the
weighted average multiplier for all economic activities in Canada, to the total
Canada-to-China export value. The second method employs an industry export
weighted approach by applying the most relevant available multiplier13 to each
of the twenty-one export categories delineated by the Canadian International
Merchandise Trade Database.14,15
For exports, applying industry specific multipliers to Canadian export
categories to China consistently estimated a total economic effect greater
than did the application of the “total industries” multiplier across all exports.
In 2019, the Canadian International Merchandise Trade Database reported
that Canada’s gross goods exports to mainland China amounted to $23.3
billion.16 Applying the “total industries” multiplier generated an estimated total
economic impact of $45.1 billion; however, the exports by industry approach
10estimated the total economic impact at $47.8 billion. This suggests that
exporting industries to China generate more total economic impact per dollar
of direct impact than does industry in Canada in general. This discrepancy was
observed for merchandise and services exports to both mainland China and
Hong Kong.
The “total industries” multiplier approach estimated that the total economic
impact of all goods and services exports to China over 2019 was $72.14 billion.
Likewise, the total economic impact estimated by the “sectoral multipliers”
approach yielded $76.90 billion. The latter estimate is likely more accurate
as it accounts for the
the total economic impact estimated particular composition
of industries and
by the “sectoral multipliers” approach activities involved in
yielded $76.90 billion exports to China. Of
this impact, $56.03
billion is embodied in merchandise exports while $20.86 encompasses services
exports. The total economic impact of exports directly to mainland China
amounted to $64.48 billion, while the remaining $12.42 billion was generated
by exporting to Hong Kong, some of which may be ultimately bounded for the
mainland. Altogether, the multiplier effect for exporting activities to mainland
China and Hong Kong is 2.064.
1.2 employment and wage effects
of exporting to china
The Organization for Economic Cooperation and Development (OECD)
estimates that the share of domestic employment embodied in foreign final
demand ranged from 19.4% to 20.5% from 2009 to 2015, which is the most
recently available data.17 Using these numbers, and assuming that the number
of jobs supported by exports to a particular country is proportional to the
share of exports to that country, we calculate that 137,370 Canadian jobs were
supported by Chinese demand in 2015.18 This includes both jobs directly and
indirectly supported by Chinese demand for Canadian exports. Assuming the
same share of domestic employment in subsequent years but using more
recent trade and employment data, we could estimate 149,227 and 176,392 jobs
were embodied in exports to China in 2019 and 2020 respectively.19
A September 2020 Global Affairs Canada trade report, based on 2016 supply
and use data, estimated that the number of jobs linked to exporting to China
was 182,026.20 It notes: “Statistics Canada does not estimate directly the number
of jobs linked to exporting to China; however, they do provide estimates for
11total jobs supported by exporting.”21 It therefore produces this estimate by
assuming that the number of jobs supported by exports to China is proportional
to the share of Canadian exports to China. This source used total jobs numbers
reported in the supply and use tables which exceeds the numbers reported in
the labour Force Characteristics by Industry table.22 From here on we use the
lower number to produce more conservative jobs number estimates.
OECD data suggests that the true jobs number may be much higher. Their
data shows that the share of domestic employment embodied in demand
from the United States is significantly less than is the share of export revenue
from the United States. Consequently, the share of employment associated
with demand from other countries is proportionally larger. While exports
to mainland China grew from 3.11% to 3.86% of total exports from 2009 to
2015, the share of domestic employment supported by Chinese demand
grew from 4% to 7.7%. Using these figures and excluding any assumption of
proportionality between share of exports and share of employment embodied
in exports, we calculate that 274,028 jobs were connected to Chinese demand
for Canadian goods and services in 2015. If we assume that the share of
domestic employment linked to foreign demand remained in the 19.4% to
20.5% range and that China’s share of said demand remained at 7.7%, then we
calculate that 292,378 and 277,188 Canadian jobs were embodied in mainland
Chinese demand in 2019 and 2020, respectively.
Furthermore, the OECD estimates that the share of domestic compensation
of employees embodied in foreign final demand ranges from 20.2% to 21.4%
from 2009 to 2015, implying that the aggregate compensation of those
whose employment is linked to exports exceeds that of the average Canadian
employee.23 In essence, people whose jobs support exports, including those to
China, tend to earn more on average than the Canada-wide average income. The
implied income premium relative to the average Canadian income is about 4.5%.
The most recent Statistics Canada data shows that average individual income
in 2015 and 2019 was $47,300,24 which would place the average income
for employment embodied in foreign final demand from China at $49,428.
Consequently, it is estimated that the total wage impact from direct and
indirect employment embodied in exports to mainland China was equal to
$13.5 billion in 2015, $14.5 billion in 2019, and $13.7 billion in 2020.
Using the same method, it is estimated that 24,912 Canadian domestic jobs
were linked to Hong Kong’s demand for goods and services in 2015, 26,580
jobs in 2019, and 25,199 jobs in 2020. Further, the total wage impact was $1.23
billion in 2015, $1.31 billion in 2019, and $1.25 billion in 2020. The total (direct
+ indirect + induced) employment and wage effects for mainland China and
12Hong Kong aggregated are 298,940 jobs and $14.8 billion in wages in 2015,
318,958 jobs and $15.8 billion in wages in 2019, and 302,387 jobs and $14.9
billion in wages in 2020.25
As the most recent available OECD data is from 2015, these estimates may not
accurately reflect the changes of the underlying effects year to year. Given
that export growth to China outpaced Canada-wide export expansion, these
estimates likely still underrepresent the true employment and wage effects
in 2019 and 2020. Notably, the 2019 jobs estimate of 318,958 is not far from
the simple jobs number estimate produced by multiplying the most recent
“total industries”
the estimated number of jobs supported by jobs multiplier (2017)
exports to China in 2019 amounts to 365,915 with the total value
of exports to China
in 2019. Doing so
produces a jobs number estimate of 367,784. When total exports are broken
down by industry and multiplied by the most sector-relevant input-output
total jobs multiplier, the estimated number of jobs supported by exports to
China in 2019 amounts to 365,915.
Given that 2019 and 2020 jobs number estimates based on OECD data
are more likely to underestimate the true number of jobs, these higher
estimates may provide a more accurate picture for the last few years. The
2019 jobs estimate
wage effect for 2019 [...] amounts to produced using the
$18 billion sector-relevant jobs
multipliers exceeds
the 2015 estimate based on OECD data by about 22%. Over the same period,
total exports to mainland China and Hong Kong increased by 20% (from $32.2
billion to $38.6 billion). This provides a fair indication that our sector-relevant
multiplier-based jobs estimate for 2019 is in line with the changing role of
China as a Canadian export destination. Accordingly, the wage effect for 2019
estimated by the sector-relevant multiplier approach amounts to $18 billion.
1.3 merchandise trade
China, the only major economy to record positive economic growth in 2020,
will undoubtedly play an even greater role in the global economy moving
forward. While the U.S. is and will remain by far the largest export market for
Canada, China is a key export market for many Canadian industries.
The table below presents the Canadian dollar value of Canadian goods exports
to China over the past 10 years. Canadian goods exports to mainland China
and Hong Kong reached $28.3 billion in 2020, growing at an average pace
13table 1.3.1
canadian goods exports to china
2011-2020, millions of dollars cad
Goods Trade 2011 2012 2013 2014 2015 2016 2017 2018 2019 2020
Exports to
Mainland China 18,133 20,368 22,031 20,467 21,419 22,346 24,992 29,076 24,489 26,303
(Goods)
YoY% Change 12% 8% -7% 5% 4% 12% 16% -16% 7%
Exports to Hong
2,917 2,553 4,551 4,623 4,025 2,378 2,308 4,067 4,162 1,949
Kong (Goods)
YoY% Change
-13% 78% 2% -13% -41% -3% 76% 2% -53%
(HK)
Source: Statistics Canada26
of 5% since 2011. Using calculations from the previous section on jobs and
wage impacts, we also estimate that nearly 220,000 jobs were embodied in
merchandise (goods) exports to China in 2019.
The pulp mill industry (12%) represents the largest export category
in Canada to China at the national level. Iron ore mining (11%), animal
table 1.3.2 slaughtering/
top 10 canadian exports to china by industry processing
(7%), starch and
2020, millions of dollars cad
vegetable fat & oil
% of
Total Exports manufacturing (7%),
national
2020 and oilseed farming
total
Pulp mills 2,933 12%
(6%) round out the
top five.
Iron ore mining 2,812 11%
Iron ores and
Animal slaughtering & processing 1,845 7% concentrates are the
Starch & vegetable fat/oil manufacturing 1,678 7% single largest product
export category (at 11%
Oilseed (except soybean) farming 1,556 6% of the national total),
Copper, nickel, lead, zinc ore mining 1,064 4% followed by chemical
wood pulp (8%),
Wheat farming 953 4% canola seeds (6%),
Dry pea and bean farming 948 4% swine (pork) (6%), and
canola oil (4%).
Automobile/light-duty motor vehicle manufacturing 849 3%
Coal mining 731 3%
Source: Statistics Canada28,29
14trade in goods/merchandise
(regional/provincial level)
Statistics Canada has established six geographical regions of the country
(British Columbia, the Territories, the Prairies, Ontario, Quebec, and Atlantic
Canada) for the purposes of statistical reporting.31
Exports to China from the Prairies (Alberta, Saskatchewan, Manitoba)
represent 38% the national total. British Columbia constitutes 24% of the
national total—the single largest provincial total. This is followed by Quebec
(19%) and Ontario (11%). The Atlantic region (Nova Scotia, New Brunswick,
Prince Edward Island, and Newfoundland & Labrador) represents 8% of the
national export total. Comparatively, Atlantic Canada makes up only 5.5% of
Canada’s GDP, suggesting that they overperform in exports to China relative to
the national average. The Canadian Territories (Yukon, Northwest Territories,
and Nunavut) represent just 0.4% of Canadian merchandise exports to China.
Interestingly, British Columbia led Canada in terms of percentage of its provincial
exports that are destined for China in 2020, at 14%. It is followed closely by
Saskatchewan (14%), Nova Scotia (12%), and Newfoundland and Labrador (11%).
1515%
10%
5%
0%
s I
BC SK NS NL MB QC AB rie PE NB ON
o
r rit
Te
Source: Statistics Canada 32
table 1.3.4
exports, imports, and trade balance with china by region
2020, millions of dollars cad
Atlantic
Prairies Ontario Quebec BC Territories Total
Canada
Total Exports 9,646 2,755 4,795 5,974 106 1,942 25,129
Total Imports 5,122 45,710 11,416 13,455 0.072 800 76,503
Trade Balance
4,524 -42,995 -6,621 -7,482 -106 1,143 -51,285
(China)
Total Exports
269 950 342 252 0.00035 92 1,904
(HK)
Total Imports
29 333 113 92 N/A 5 572
(HK)
Source: Statistics Canada33, 34
prairies
Alberta and Saskatchewan (at 18% and 16% of the national export total,
respectively) are the two primary drivers of the Prairies’ exports to China.
Manitoba, meanwhile, makes up 4%.
Unsurprisingly, agricultural industries lead the way in the Prairie provinces.
Starch/vegetable fat/oil manufacturing were most significant at 17%, followed
16table 1.3.5
exports and imports for individual prairie
provinces
2020, millions of dollars cad
Alberta Saskatchewan Manitoba
Total Exports 4,557 4,138 952
Total Imports 3,423 411 1,288
Total Exports (HK) 239 25 5
Total Imports (HK) 22 2 5
Source: Statistics Canada35
table 1.3.6
top 10 prairie exports to china by product
2020, millions of dollars cad
Total Exports 2020 % of regional total
Starch/vegetable/fat/oil
1,670 17%
manufacturing
Oilseed farming 1,547 16%
Dry pea/bean farming 940 10%
Wheat farming 915 10%
Pulp mills 779 8%
Other non-metallic mineral
677 7%
mining/quarrying
Animal slaughtering/processing 599 6%
Other grain farming 570 6%
Other basic organic chemical
509 5%
manufacturing
Resin/synthetic rubber
295 3%
manufacturing
Source: Statistics Canada36
17by oilseed farming (16%), dry pea and bean farming (10%), wheat farming (9%)
and pulp mills (the only non-agrifood industry in the top five, at 8%).
Similarly, agricultural products constitute most of the top Canadian
Prairie exports to China. Canola/colza Seeds (15%), canola/colza oil (11%),
leguminous vegetables (10%), wheat (9%), and potassic mineral or
chemical fertilizers (7%) were the top five product categories in 2020.37
ontario
Exports from Ontario constitute 11% of all Canadian goods flowing to China.
This places Ontario fifth among individual provinces in Canada, trailing British
Columbia, Quebec, Alberta, and Saskatchewan.
While the other top Canadian exporting provinces send vast quantities of
agricultural and mining-related commodities to China, Ontario’s exports are
mainly concentrated in manufacturing industries.
Ontario’s top industry by Chinese export value is automobile/light-duty motor
vehicle manufacturing, at 13% of the provincial total. This is followed closely by
pharmaceutical/medicine manufacturing (10%), animal slaughtering/processing
(7%), navigational/measuring/medical/control instruments (5%), and resin/
synthetic rubber manufacturing (5%).
table 1.3.7
top 10 ontario exports to china by product
2020, millions of dollars cad
Total Exports 2020 % of provincial total
Automobile/light-duty motor vehicle manufacturing 366 13%
Pharmaceutical/medicine manufacturing 275 10%
Animal slaughtering/processing 190 7%
Measuring/medical/control instruments 145 5%
Resin/synthetic rubber manufacturing 135 5%
Soybean farming 118 4%
Commercial/service machinery manufacturing 104 4%
Non-ferrous metal (except aluminium) smelting/refining 102 4%
Animal food manufacturing 101 4%
Industrial machinery manufacturing 80 3%
Source: Statistics Canada38
18Passenger motor vehicles (13% of the provincial total) are the top export by
product category, followed by medicine (9%), swine (pork) meat (5%), soya
beans (4%) and pet food (4%).39
There is considerable distribution of exports in Ontario across industry and
product categories. Only 21% of exports fall outside of the top 25 industries,
while 35% of exports fall outside the top 25 product categories.40
quebec
Quebec is the source of 19% of Canadian goods flowing to China, trailing only
B.C. in the individual provincial rankings.
Exports are highly concentrated in the iron ore mining and animal
slaughtering/processing industries, which make up 40% and 21% of the
provincial export total, respectively. There is a considerable drop-off to
commercial/service industry machine manufacturing (5%), pulp mills (4%), and
aerospace product/parts manufacturing (4%).
Similarly, iron ores and concentrates comprise 40% of the provincial export
total, followed by swine/pork meat (18%), ground flying trainers/flight
simulators (4%), helicopters/airplanes/spacecraft (4%), and motor vehicles for
passenger transport (3%). 42
table 1.3.8
top 10 quebec exports to china by product
2020, millions of dollars cad
Total Exports 2020 % of provincial total
Iron ore mining 1,908 40%
Animal slaughtering/processing 988 21%
Commercial/service machinery manufacturing 255 5%
Pulp mills 191 4%
Aerospace product/parts manufacturing 189 4%
Automobile/light-duty motor vehicle manufacturing 129 3%
Iron and steel mills/ferro-alloy manufacturing 121 3%
Non-ferrous metal (except aluminium) smelting/refining 113 2%
Measuring/medical/control instruments 109 2%
Sawmills and wood preservation 90 2%
Source: Statistics Canada41
19british columbia
B.C. is the single largest provincial source of merchandise exports to China,
representing 24% of the national total.
Exports (by industry) are mostly heavily concentrated in pulp mills, which
make up 31% of the export total in this region. Copper/nickel/lead/zinc ore
mining (17%), coal mining (12%), sawmills (9%), and automobiles/light-duty
motor vehicle manufacturing (5%) round out the top five.
Product exports are led by chemical wood pulp (27%), copper ores and
concentrates (17%), coal (12%), lumber (9%), and passenger motor vehicles (6%).44
table 1.3.9
top 10 bc exports to china by product
2020, millions of dollars cad
Total Exports 2020 % of provincial total
Pulp mills 1,888 32%
Copper/nickel/lead/zinc ore mining 1,022 17%
Coal mining 705 12%
Sawmills 555 9%
Automobiles/light-duty motor vehicle manufacturing 321 5%
Logging 190 3%
Gold/silver ore mining 189 3%
Seafood product preparation/packaging 141 2%
Fishing 96 2%
Paper mills 91 2%
Source: Statistics Canada43
atlantic canada
Atlantic Canada generates 8% of Canadian exports to China. On a
provincial level, Newfoundland & Labrador (4%) leads the way, followed by
Nova Scotia (3%), New Brunswick (1%), and Prince Edward Island (0.13%).
The iron ore industry is by far the largest source of Atlantic Canadian exports
to China at 41%, followed by seafood product preparation and packaging
at 21% and fishing at 19%. Pulp mills (4%) and non-ferrous metal (except
aluminum) smelting/refining (3%) round out the top five.
20table 1.3.10
exports and imports for individual atlantic
provinces
2020, millions of dollars cad
Newfoundland
New Brunswick Nova Scotia PEI
and Labrador
Total Exports 144 658 40 1,108
Total Imports 225 514 3 58
Total Exports (HK) 16 31 5 40
Total Imports (HK) >0 5 >0 >0
Source: Statistics Canada45
table 1.3.11
top 10 atlantic exports to china by product
2020, millions of dollars cad
Total Exports 2020 % of provincial total
Iron ore mining 799 41%
Seafood product 413 21%
Fishing 370 19%
Pulp mills 72 4%
Smelting and Refining 67 4%
Oil and gas extraction 56 3%
Meslin and wheat 41 2%
Peas (dried and shelled) 38 2%
Semi-chemical wood pulp 13 1%
Bituminous coal 11 1%
Source: Statistics Canada46
21Iron ores and concentrates (41% of the provincial merchandise export total),
crustaceans (32%), frozen fish (4%), nickel (3%), and chemical wood pulp (3%)
are the top five product categories from Atlantic Canada.47
territories
The Canadian Territories (Yukon, NWT, and Nunavut) represent just 0.4% of
Canadian merchandise exports to China. In 2020, Nunavut’s iron ore mining
industry comprised almost the entire territorial total via the export of iron
ores and concentrates.
table 1.3.12
top 5 territories exports to china by product
2020, cad
Total Exports 2020
Iron ore mining 105,527,918
Instruments Manufacturing 297,850
Store retailers 35,500
Mechanical manufacturing 5,686
Source: Statistics Canada49
1.3.1 canada china interdependence:
difficult to untangle
Statistics often fail to communicate the full picture when it comes to trade,
and China is no exception. The following considerations regarding Canadian
merchandise trade illustrate the importance of China as a trading partner and
outline the difficulties surrounding efforts to diversify or disengage with China.
Canadian goods trade (both exports and imports) with China has had an
overwhelmingly upward trajectory over the past 30 years. Despite recent
political tensions and a global pandemic, 2020 saw a 7% increase in goods
exports from Canada to China. While this comes after a considerable
decrease (-16%) in the prior year (largely due to agricultural products),50 it
serves to demonstrate the resilience of the broader trading relationship. For
comparison, 4.8% of Canadian merchandise exports went to China in 2020
while only 0.7% went to India.51
22Conversely, public opinion polling suggests that Canadians are wary of the Canada-
China trade relationship. A Nanos/CTV News poll released in January 2021 indicates
that 45% of Canadians think that trade with China should be reduced. Just 10%
believe trade should increase, while 28% state that it should be kept at its current
level; 17% of respondents were unsure.52 A prior Ipsos poll, released on July 21,
2020, reported that
rapid growth, massive consumption of 82% (35% strongly/47%
commodities, and integration in the global somewhat) “agree …
Canada should reduce
supply-chain make it exceedingly difficult its reliance on trade with
for Canada to “turn off the taps” China and diversify to
other countries.”53
This is difficult to reconcile. Political tensions are not always reflected in the
economic relationship between two countries and calls for reliance reduction
are not easily translated to real outcomes. While the idea of pulling back trade
with China is often-discussed in expert circles, China’s rapid growth, massive
consumption of commodities, and integration in the global supply chain make
it exceedingly difficult for Canada to “turn off the taps.”54
This is not to say that trade diversification is impossible. The Government of
Canada, through its Export Diversification Strategy, sets an ambitious target to
expand trade via “50% more overseas exports by 2025.” It states that
“[d]iversification is a national imperative” and that it “will not stop until [Canada]
is the hub of global trade and the world’s most connected, stable, predictable,
innovative and in-demand market on earth.”55 Canada’s existing multilateral trade
agreements, such as the Comprehensive Economic and Trade Agreement (CETA),
the Comprehensive and Progressive Agreement for Trans-Pacific Partnership
(CPTPP), and the Canada-United States-Mexico Agreement (CUSMA) will
undoubtedly play a role in this equation. That being said, any public expectations of
a rapid move away from China trade should be tempered with reality.
1.3.2 canadian use of chinese
imports/inputs
A key aspect of the Canada-China trading relationship not yet discussed in
this section is the importance of Chinese imports (and inputs) for Canadian
consumers and businesses. Similar to Canadian exports, imports from China
have grown considerably over past decades. Chinese goods comprised 14%
of cumulative Canadian imports in 2020, up from 12% in 2019, in part due to a
spike in imports of masks and PPE to combat the pandemic.
A 2020 Global Affairs Canada report on Canadian supply chains linked with
China illustrates China’s importance.56 Attesting to China being the dominant
23supplier for a large number of internationally traded goods, the report notes
that China holds a dominant (50%) market share in 448 products (out of
5,428) at the HS-6 level.57 By comparison, the U.S. was the dominant (50%)
market share holder for only 101 products. The report notes that China is a
significant source for “limited supply products,” where “Canada imported the
product from 3 or less supplier countries, or if the HHI is greater than 0.81
(which roughly indicates 90% market share from a single source).”58
Moreover, that report highlights that China is increasingly supplying Canadian
businesses with capital (like factory machinery) and intermediate goods
which can enhance domestic production. In 2000, 57% of Canada’s imports
from China were consumption goods—consistent with China being the final
assembly point in many Asian supply-chains—16% of imports were capital
goods, and 27% were intermediate goods. By 2019, only 41% of imports from
China were consumption goods, 26% were capital goods, and 32% were
intermediate goods. In terms of economic impact, this shift enables Canadian
producers to make value-adding contributions in the supply chain for either
domestic consumption or export, which in turn contributes to GDP.
Expectedly, certain industries are more reliant than others on Chinese imports
for inputs. Canadian manufacturing of hand tools, electrical equipment,
computer parts, and small electrical appliances are particularly reliant
on Chinese products. 36% of components in small electrical appliances
are Chinese imports as of 2016. Disruptions to this area, where input
concentration is so high, could reverberate widely throughout the economy
given that small electrical appliances are found throughout 97% of all
industries in Canada.
Generally speaking, the impact of trade disruption on consumer goods
imports, for example, would be shortage and price increases. In some cases,
“certain consumption goods (such as “Toys, Games, and Sports Equipment”)
are not readily
the impact of trade disruption on available from other
producers and these
consumer goods imports would be would be difficult to
shortage and price increases replace.”59 For capital
goods, those “tangible
goods that are instrumental in producing goods and services,” the loss of
Chinese imports would overwhelmingly impact machinery and equipment
manufacturing, which produce critical “computers, computer peripherals,
and parts; and other communications equipment.”60 For intermediate goods,
Chinese content is found in roughly 47% (21,793) of all Canadian production
inputs. While one might wager that Canadian firms could substitute
Chinese inputs in some cases, “[a]ny disruption to trade that involves firms
24involuntarily substituting away from the 21,793 Chinese inputs could cause the
cost of production to increase, a decrease in productivity, and ultimately hurt
Canadian producers and consumers.”61
While the benefits of exports are more easily quantifiable, the importance
of Chinese imports for Canadian consumers, businesses, and supply chains
cannot be understated. A shift away from Chinese imports may make the
Canada-China trade balance appear more favourable, but it would undoubtedly
increase costs for consumers and expose some Canadian firms to potentially
damaging supply chain disruptions.
1.4 “spin-off” effects: case study
on the canola industry
The Canadian canola industry has long been linked to, and interconnected
with, the China market. China has been the source of both pain and gain for
producers across Canada. The wide-ranging, and sometimes deleterious,
implications of such an export-dependent industry make it a relevant case
study for this report. The oilseed, which originated in Canada in the 1970s,
is well known across the globe as a useful (and healthy) cooking oil choice,
feedstock, and emerging source of biofuel.62
Canola is one of Canada’s top agricultural products for export, bringing
immense benefit to producers and farmers across Canada. LMC International
(a global consultancy commissioned by the Canola Council of Canada) found
that the annual economic impact of the canola industry in Canada over the
three-year period from 2016/17 to 2018/19 was $29.9 billion.63 The sector also
supported 207,000 domestic jobs, with wages totalling $12 billion.
In the calendar year 2020, the Canola Council of Canada reported production
of 18.8 million metric tonnes (MMT) from 20.8 million seeded acres.64
table 1.4.1
value of canola exports by country
2020, cad
$4 billion $3 billion $1 billion $1 billion $800 million
Source: Canola Council of Canada65
25Domestic processing (crushing) produced 4.5 MMT of canola oil and 5.79 MMT
of canola meal. Cumulative exports equalled 11.8 MMT (worth $6.3 billion) of
seed, 3.4 MMT ($3.7 billion) of oil, and 5.0 MMT ($1.9 billion) of meal for a sum
total of $11.9 billion.
Exports of canola to China—the world’s top consumer of vegetable oil—
reached $3.1 billion in 2020, trailing only the U.S. ($3.7 billion) in total value.66
This far outpaced the entire European Union ($1.3 billion), Japan ($1.3 billion),
and Mexico ($797.1 million). Seed exports to China totalled 2.6 MMT (22% of
the national total and first among all export markets), oil reached 1.1 MMT
(32%), and meal reached 1.5 MMT (30%).67
export disruptions
Canola exports to China have grown rapidly since the Chinese oilseed market
opened up in the 1990s. The only periods of disruption have largely been
linked to periodic Chinese import restrictions.
China has previously imposed restrictions on Canadian canola in 2009 and
2016, invoking concerns over the spread of blackleg disease.68 Both were
eventually resolved; however, the most recent, and perhaps most well-known,
export disruption took place in 2019, when China revoked the canola seed
export licenses of Richardson and Viterra, two of Canada’s largest canola
producers. According to the Canola Council, this situation was estimated to
have “cost the industry between $1.54 and $2.35 billion from lost sales and
lower prices between March 2019 and August 2020.”69
The official reason for the ban given by Chinese authorities was the presence
of “dangerous pests such as fungus” in shipments to the country.70 While
the reason for the ban is evidently complicated and multifaceted, it came
just months after Huawei CFO MENG Wanzhou was detained by Canadian
authorities in Vancouver.71 Observers have linked the two events and posited
that the ban could have been motivated by political elements. Prime Minister
Justin Trudeau was even quoted saying that China was “inventing excuses” and
that it was “unjustified” to stop the flow of Canadian exports to China.72
This situation is ongoing (with both producers’ canola seed export licenses still
suspended), although seed exports as a whole are beginning to recover.73 The year
2020, for example, was a strong one for Canadian producers, who benefited from
rapidly increasing Chinese demand for agri-food products.74 It is also important to
note that canola oil and meal exports were not impacted by the ban.
This does not mean that Canadian industry stakeholders should be (or are)
complacent with regards to China. The Canola Council of Canada, for example,
26table 1.4.2
canadian canola exports by year
Year Exports in Metric Tonnes
2020 20 million
2019 16 million
2018 18 million
2017 19 million
2016 16 million
Source: Canola Council of Canada75
noted the importance of trade diversification in its new 2021 market access
strategy, noting that “more government resources are required to diversify
markets and create trade predictability in Asia.”76 It will clearly take both
industry and government buy-in to promote the necessary levels of trade
diversity and expand into new markets.
The multibillion-dollar China market is, and will continue to be, a core market
for the Canadian canola industry despite ongoing restrictions. Although
the industry may face short-term roadblocks and/or disruption, the general
trajectory (and resulting economic benefit) has proven to be positive.
cumulative economic effect
The aforementioned LMC report concluded that in the 2018-19 fiscal year
when exports to China accounted for $3.187 billion of the $10 billion total, the
direct economic impact was $12.18 billion and the cumulative, which includes
indirect and induced effects, was $27.7 billion.77 Therefore, if the direct impact
of China’s Canadian canola imports is proportional to its cumulative effect,
then China’s import of Canadian canola is responsible for a $7.25 billion
impact in Canada over the 2018-19 fiscal year. This means that the indirect and
induced effects are 1.27 times greater than the direct impact and the multiplier
for the total industry activity is 2.27. This is notably higher than the multiplier
calculated for total exporting industries to China, which was 2.064.
Furthermore, the report found that the number of jobs directly supported in
the canola industry in 2018-19 was about 60,000. However, when accounting
for the indirect and induced consumption effect in particular, the number of
Canadian jobs supported by the canola industry increases to 142,000 and is
even higher at 204,000 when including farm family members who help with
the canola farming work on site. Given the proportion of canola industry
27revenue generated by exporting to China, we can estimate that canola exports
to China support 37,500 jobs of the 142,000 total.
It is important to note that the indirect and induced effects of canola exports
are likely higher than that of many other industries since wages in the canola
industry, at $86,000 per year, are nearly double the average salary across
Canada. This partially explains why the multiplier effect in the canola industry
(2.27) is higher than for total China targeted export activity (2.064).
1.5 services trade
table 1.5.1
canadian service exports to china
2011-2020, millions of dollars cad
Services Trade 2011 2012 2013 2014 2015 2016 2017 2018 2019 2020
Total Services Exports
2,547 3,252 4,084 4,773 5,344 6,316 6,907 7,682 8,096 5,359
(Mainland)
% Change YoY 28% 26% 17% 12% 18% 9% 11% 5% -34%
Travel (Exports) 1,690 2,099 2,924 3,679 4,185 4,983 5,505 6,002 6,333
Commercial Services
386 583 491 505 546 597 617 791 798
Exports
Transportation and
government services 471 570 669 588 613 736 785 889 964
(Exports)
Total Service Exports
924 1,156 1,247 1,305 1,389 1,705 1,574 1,816 1,875 1,394
(Hong Kong)
% Change YoY 25% 8% 5% 6% 23% -8% 15% 3% -26%
Travel (Exports) 220 229 249 250 293 322 305 363 379
Commercial Services
252 278 344 385 429 720 570 618 622
Exports
Transportation and
government services 453 649 655 670 667 663 700 835 874
(Exports)
Source: Statistics Canada78
*Subcategory breakdown not available for 2020 data.
28Canadian service exports to China grew at an average rate of 15% over
the past 10 years, before tumbling by over 34% in 2020. Obviously, the
COVID-19 pandemic greatly hindered international travel, which in turn
reduced education and tourism exports. In recent years, travel exports, which
encompasses both tourism and education, has been by far the largest and
fastest growing services export category to China. About two thirds of the
value of travel exports comes from education exports (~$4.5 billion), while the
remaining third (~$2.2 billion) is generated by tourism from China. Services
exports to Hong Kong were not as adversely affected by pandemic responses
due to their greater concentration in commercial services, which were not as
vulnerable to travel restrictions as education and tourism.
While smaller in quantity than merchandise trade, services trade with China
is an important dimension of the Canada-China economic relationship. The
primary components of Canadian service exports to China are tourism,
financial services, and education, which is constituted mainly by Chinese
international students at Canadian universities, but also includes those
studying at colleges and grade schools. These activities bring billions of dollars
to Canada and are a key driver of the social and cultural connection between
the two countries. Social and cultural exports are an important factor even
in the China-Canada economic relationship because they facilitate further
trade in goods and services and even investment. For example, many Chinese
international students in Canada end up immigrating, which brings long-term
positive changes to the Canadian economy. Therefore, the importance of the
social and cultural exports embedded within services exports to China must
not be understated.
This section examines the specific impacts of Canadian services exports
to China on a sectoral and regional basis before discussing the cumulative
impacts and implications.
1.5.1 education
Canada is a world leader in educational exports. In 2018, the Canadian
government and independent research estimated that international students
spent about $22
education services were Canada’s billion on tuition,
accommodation,
largest export to China in 2019 and discretionary
expenses combined.79
This directly supported nearly 220,000 Canadian jobs. Because international
students’ expenditures represent revenue for goods and services from
overseas, they are Canadian exports of education services. In fact, international
29You can also read