Chicago Influenza and Respiratory Virus Surveillance Report
←
→
Page content transcription
If your browser does not render page correctly, please read the page content below
Surveillance Week 7 (February 13-19, 2022)

                      Chicago Influenza and Respiratory Virus
                                Surveillance Report
Lori E. Lightfoot, Mayor                                   February 25, 2022                Allison Arwady, MD, MPH, Commissioner

                                                   Online Influenza Dashboard

 Influenza Surveillance in Chicago
 The Chicago Department of Public Health utilizes various surveillance indicators to monitor influenza activity in
 Chicago. This includes surveillance for influenza-associated intensive care unit (ICU) hospitalizations, monitoring
 circulating influenza viruses, as well outpatient and emergency department visits that are due to influenza-like
 illness (ILI). Influenza surveillance data are typically aggregated by week. This report is updated on Fridays for the
 previous Saturday through Sunday. On all graphs, the week ending date is displayed. Ending dates are accurate for
 the current season but are approximations for all other years. All data presented here are preliminary and may
 change as more reports are received. Reported percentages for previous seasons represent final, end of season
 data and may differ from previously published reports. All data presented on this page, except where otherwise
 noted, are available through the Chicago Data Portal1.

 Note for the 2021-2022 season: The COVID-19 pandemic has influenced influenza activity and surveillance in
 several ways. Surveillance indicators that monitor outpatient and emergency department visits for influenza-like
 illness will capture visits for other respiratory illnesses, like COVID-19, that have similar symptoms. Additionally,
 health care seeking behavior has changed during the COVID-19 pandemic which may limit our ability to monitor
 influenza activity. As a result, our typical indicators may be less reliable in measuring influenza activity and should
 be interrupted with caution and in context with other respiratory pathogens circulating at the time. COVID-19
 mitigation measures, like masking and social distancing may also change the timing and intensity of influenza
 activity this year. Information about the current COVID-19 situation in Chicago can be found on the COVID-19
 Dashboard2.

 Expanded respiratory virus surveillance: In order to provide additional context regarding influenza activity, CDPH,
 along with participating hospital laboratories, has expanded laboratory surveillance to include other respiratory
 viruses. The data represented here are a subset of all the respiratory virus testing performed in Chicago and may
 include both Chicago and non-Chicago residents. The facilities reporting data are the largest medical centers in
 Chicago and represent nearly half of all acute care hospitals in the city. Additional respiratory virus surveillance
 data is presented at the end of this report including emergency department visits for RSV among children less than
 five years of age.

                                                 Weekly Surveillance Summary
 •    Currently, the risk of influenza infection remains low. The influenza surveillance season continues through the end of
      May and increases in influenza activity can still occur; in 2018-2109, the percent of specimens testing positive for
      influenza peaked in early April.
 •    No influenza-associated ICU hospitalizations were reported. Since October 3, 2021, five influenza-associated ICU
      hospitalizations have been reported.
 •    11 of 2,750 (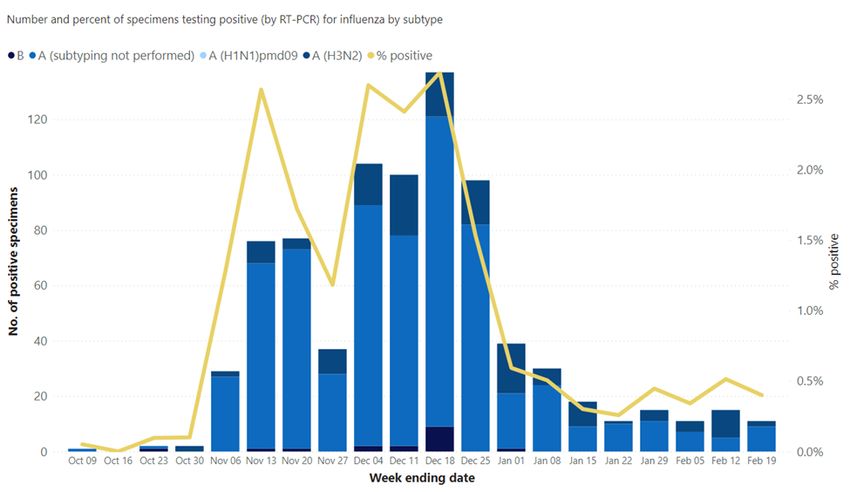
Influenza Intensive Care Unit (ICU) Hospitalizations
In Illinois, influenza associated Intensive Care Unit (ICU) hospitalizations are reportable as soon as possible, but
within 24 hours. Influenza associated ICU hospitalizations are defined as individuals hospitalized in an ICU with a
positive laboratory test for influenza A or B, including specimens identified as influenza A/H3N2, A/H1N1pdm09,
and specimens not subtyped (e.g., influenza positive cases by PCR or any rapid test such as EIA).

This chart shows the number of reported
influenza-associated ICU hospitalizations by
week of when the patient tested positive for
influenza. It is not a census of those currently
hospitalized in the ICU for influenza.

This table summarizes selected
characteristics of the number of reported
influenza-associated ICU hospitalizations for
the current week and the cumulative number
since the beginning of the season.

 Influenza Laboratory Surveillance
 Data on influenza virus test results are
 reported by several Chicago hospital
 laboratories performing influenza RT-PCR.
 Laboratories submit aggregate data for all
 influenza tests performed; therefore, data
 may contain results for individuals that
 reside outside of Chicago. It is meant as an
 indicator of circulating influenza viruses in
 the area. Data represents positive laboratory
 results regardless of hospitalization status.
 Data does not represent all cases of
 influenza since many individuals with
 influenza do not seek medical care or get
 tested for influenza.

 This chart shows the percent of specimens
 tested for influenza that were positive (line
 graph) and the number of positive influenza
 tests by influenza virus subtype (bar graph).
                                                                                                              Page 2 of 6
The following charts show the weekly number of specimens tested for influenza and the weekly percent that were
positive.
The following charts show the cumulative number of specimens tested for influenza and the cumulative percent that
were positive.
Influenza Outpatient Illness Surveillance
Several outpatient clinics throughout Chicago
participate in CDC’s Influenza-like Illness
Surveillance Network (ILINet5) by reporting on a
weekly basis the total number of outpatient
clinic visits, and of those visits, the number with
influenza-like illness (ILI). ILI is defined as fever
plus cough or sore throat.
This chart shows the percent of medically-
attended outpatient visits attributed to influenza
-like illness as reported by ILINet facilities in
Chicago by week. By default, the chart shows
the current season and previous two seasons.
Influenza Emergency Department Illness
Surveillance
ESSENCE6 is an electronic syndromic
surveillance system that utilizes the chief
complaints of patients visiting emergency
departments to monitor for influenza-like illness.
All acute-care hospitals in Illinois report
emergency department data to this system.
Currently, ESSENCE captures nearly every
emergency department visit in the city on a daily
basis.
This chart shows the percent of emergency
department visits attributed to influenza-like
illness for Chicago zip codes based on chief
complaint data submitted to ESSENCE by week.
By default, the chart shows the current season
and previous two seasons.
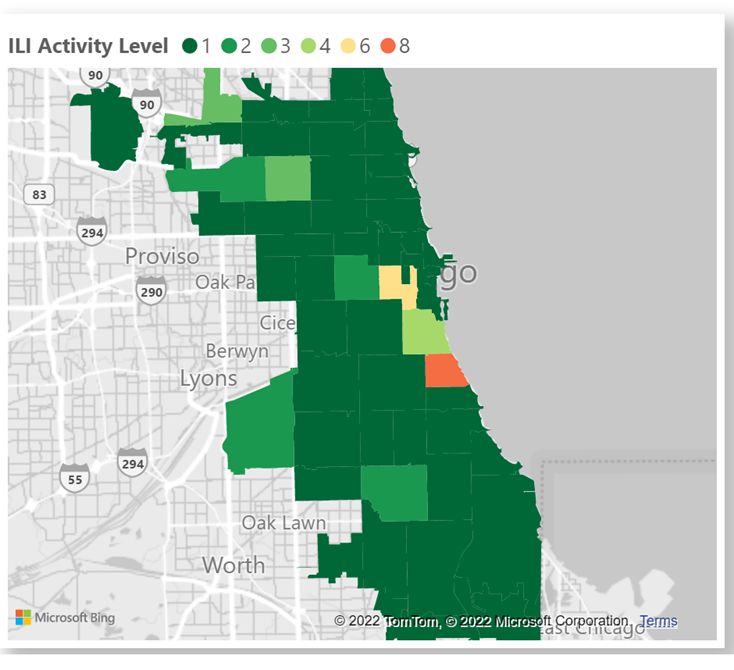
Page 3 of 6Influenza-like Illness Activity Map ILI Activity Level is determined by comparing the ILI percentage for each zip code for the current week to the mean ILI percentage during the non-influenza weeks for the previous season (usually the summer months of May through September). Level 1 corresponds to an ILI percentage below the mean, level 2 to an ILI percentage less than one standard deviation (SD) above the mean, level 3 to an ILI percentage more than one, but less than two standard deviations above mean, and so on, with level 10 corresponding to an ILI percentage more than eight standard deviations above the mean. Variations in ILI activity levels should not be interpreted as an influenza cluster or outbreak as other illnesses can cause similar symptoms (including COVID-19). This map shows the influenza-like Illness (ILI) activity levels by patient zip code determined by the chief complaint data submitted to ESSENCE for the current season. Respiratory syncytial virus (RSV) among children < 5 years of age While RSV can affect people of all ages, it is more common, and more frequently causes severe illness, in younger children (
This figure shows the percent of ED visits for
RSV among children
National and State Influenza Surveillance
The Centers for Disease Control and Prevention’s FluView report7 provides national updates and trends related to
the intensity of influenza activity across the United States, as well as detailed information on antiviral resistance,
severity of illness, and other topics. Updates specific to Illinois8 and Suburban Cook County9 are also available
online. Current and archived issues of the Chicago Flu Update can be found on the CDPH website section Current
Flu Situation in Chicago.10

Referenced Websites
1. https://data.cityofchicago.org/browse?q=flu&sortBy=relevance&tags=flu
2. https://www.chicago.gov/city/en/sites/covid-19/home/covid-dashboard.html
3. https://www.chicagohan.org/alert-detail?
p_p_id=hanalertdetailsweb&p_p_lifecycle=2&p_p_state=normal&p_p_mode=view&p_p_resource_id=download&p_p
_cacheability=cacheLevelPage&_hanalertdetailsweb_attachmentId=45691699&_hanalertdetailsweb_alertId=46669
192
4. https://www.chicago.gov/city/en/depts/cdph/supp_info/health-protection/immunizations_walk-inclinics.html
5. https://www.cdc.gov/flu/weekly/overview.htm
6. https://dph.illinois.gov/data-statistics/syndromic-surveillance
7. https://www.cdc.gov/flu/weekly/index.htm
8. http://dph.illinois.gov/topics-services/diseases-and-conditions/influenza/influenza-surveillance
9. https://ccdphcd.shinyapps.io/influenza/
10. https://www.chicago.gov/city/en/depts/cdph/supp_info/health-protection/current_flu_situationinchicago.html

                                                                                                               Page 6 of 6
You can also read