CAREER & TECHNICAL EDUCATION - MSP Metro Minnesota - Minnesota State ...
←
→
Page content transcription
If your browser does not render page correctly, please read the page content below
MSP Metro
Minnesota

CAREER & TECHNICAL
EDUCATION

Workforce Trends &
Careers of Tomorrow
RealTime Talent                         Minnesota State
370 Wabasha Street, Suite 900           30 East 7th Street
St. Paul, MN 55102                      St. Paul, MN 55101

Erin Olson, Director of Strategic Research
Erin@realtimetalentmn.org
1

Workforce Trends & Careers of Tomorrow
Overview
A year and a half after COVID-19 first appeared, the impacts of shutdowns, business closures, and shifting
workforce needs worldwide have been ongoing and cumulative. Approximately 1.5 million Minnesotans have
made initial unemployment claims since the beginning of the COVID-19 pandemic—about 47% of the state’s
employed workforce just before the pandemic hit. 1 Many of the economic impacts of the COVID-19 pandemic
will be felt far into the future, and in ways that may still be yet unknown.

This report unpacks the current workforce landscape of Minnesota and the regional nuances of talent demand
by career field. We aim to support Minnesota Perkins Consortia in navigating changes in their local labor
market and guide their understanding of how these changes may impact enrollment, industry, career
advancement, and the needed programs of study by region. Each of the six regional reports—and statewide
report—include:

    •    Regional economic and demographic overview
    •    Career field and cluster analysis including regional importance of each sector, key labor market
         statistics, and forecasting for future demand in the six career fields:
              o Health Science Technology
              o Engineering, Manufacturing, and Technology
              o Arts, Communications, and Information Systems
              o Agriculture, Food, and Natural Resources
              o Business, Management, and Administration
              o Human Services
    •    Gap analysis in each of the six career fields, including:
              o Occupation gaps (i.e. talent shortages)
              o Award gaps
              o Certification gaps
              o Skill gaps
    •    An origin-to-gateway-to-target model analysis for how to help move students from entrypoints into their
         field of interest into other aligned careers, taking into account automation, remote work, and the
         changing work environment
    •    A word on remote work and jobs of the future

About This Report
This report was developed by RealTime Talent for the Career and Technical Education Consortia of Minnesota
with funding provided by Minnesota State. The contents of this publication were made possible through the
Strengthening Career and Technical Education for the 21st Century Act (Perkins V) Federal grant from the
United States Department of Education administered through Minnesota State Colleges and Universities. If you
have questions about the data found in this report, or are interested in learning more, please contact the
Director of Strategic Research Erin Olson at erin@realtimetalentmn.org

1
 Unemployment Statistics, MN Department of Employment and Economic Development. March 16, 2020 – August 27, 2020. Accessed 9/4/2020 at
https://mn.gov/deed/data/data-tools/unemployment-insurance-statistics/
2

Table of Contents
Workforce Trends & Careers of Tomorrow .................................................................... 1
   Overview ................................................................................................................... 1
       About This Report .................................................................................................. 1
Minneapolis-St. Paul Metro ........................................................................................... 3
   Introduction ............................................................................................................... 3
   Community Profile ..................................................................................................... 5
       Demographics........................................................................................................ 5
       Employment ........................................................................................................... 6
       Education............................................................................................................... 8
   The Workforce of Today and Tomorrow .................................................................. 11
       Workforce Forecast.............................................................................................. 11
       Mid-Term Occupational Impacts .......................................................................... 13
       Career Field Insights ............................................................................................ 20
Conclusion .................................................................................................................. 75
3
Minneapolis-St. Paul Metro
Introduction
This report highlights the current and future talent needs in the seven counties of
Minnesota’s Minneapolis-St. Paul Metropolitan Area (MSP Metro). 2 Starting from the
community demographics, unique vulnerabilities and opportunities, and the
critical occupations and industries underpinning the regional
economy, this macroeconomic overview is intended to
support educators and administrators who seek to
go beyond compliance to impact both student lives
and local businesses most pressing needs. Identifying the
skills, certifications, and qualifications for positions today—and
how they have been disparately impacted by the pandemic—will
help the education community anticipate community needs and
ensure that curriculum prepares students for relevant job opportunities
of the future here in the MSP Metro.
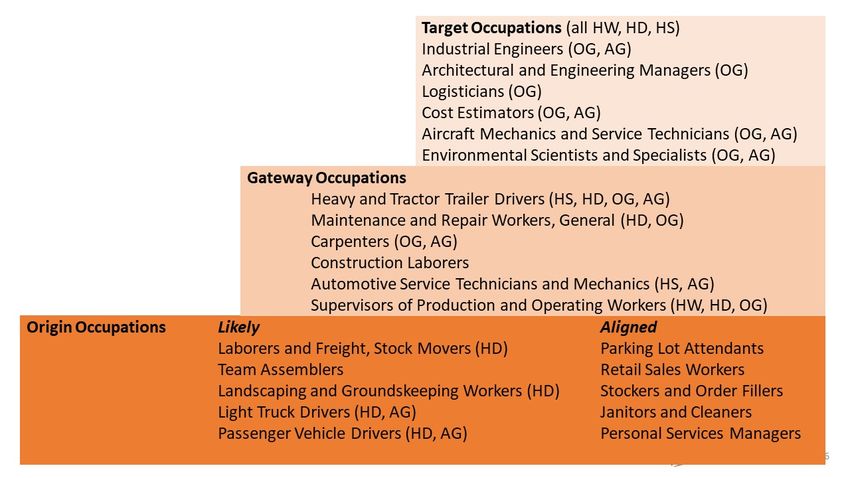
This report uses an Origin-to-Gateway-to-Target Occupation model, a
concept currently used by the Rework America Alliance and modified in this
report by RealTime Talent, illustrates promising likely and aligned pathways
into each career field. This model supports students looking for entrypoints
from an initial occupation of interest into other aligned careers, taking
into account automation, remote work, and the changing work
environment. The model itself is shown below, along with the
definitions of each grouping of occupations.
Origin-to-Gateway-to-Target (OGT) Model
The cities of Minneapolis and St. Paul
are home to the largest local
concentrations of population, and are
economic hubs for the region. In all,
about 3,065,147 people live in MSP
Metro Minnesota, according to 2015-
2019 American Community Survey
Estimates—an increase of just over
25,000 people from the prior year’s
estimates. Based on year-over-year
population growth, about 3,130,769
people are estimated to live in the
MSP Metro as of 2021.
Approximately 23.5% of the MSP
Metro’s population are minors under 18 years of age. Overall, the MSP Metro’s median age is one year
younger (37 years) than the statewide median (38 years), mostly attributable to a larger share of 25-34 year-
olds calling the MSP Metro home.
2
Hennepin, Ramsey, Anoka, Carver, Scott, Dakota, and Washington Counties.
4

    Resident Population of the MSP Metro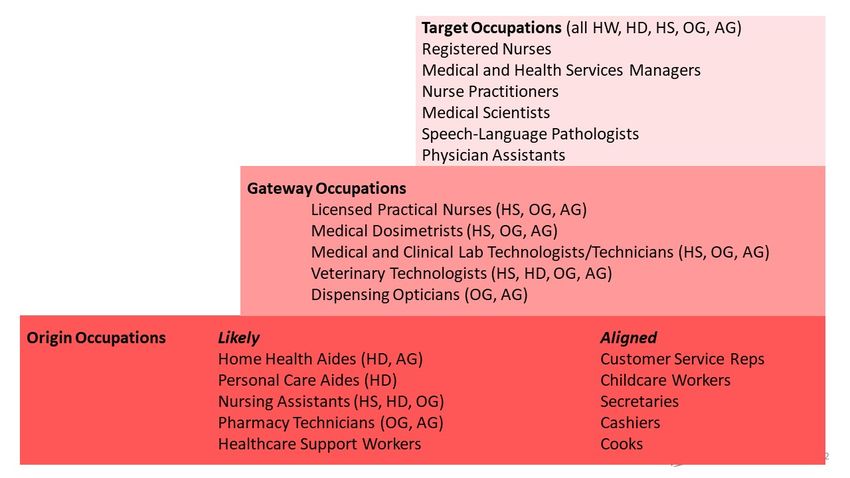
5

Community Profile
Demographics
Population diversity increased between the two most recent population estimates for the 7-county MSP Metro
by half of a percentage point. Across the region overall, 23.9% of the population identify as Black, Asian,
American Indian, Native Hawaiian, or some other race. The demographic makeup of Suburban Twin Cities
communities continue to be similar to the average Minnesota population overall, which also became more
diverse: In the suburbs, 81.3% of the population identifies as White, compared to 82.5% in the prior population
estimates. Within the MSP Metro’s urban communities, St. Paul has a greater share of Asian residents than the
other areas in the MSP Metro—growing since the most recent population estimates—and Minneapolis has a
greater share of Black or African American residents, though the overall share of Black or African American
residents declined by 0.2 percentage points in Minneapolis between the most recent population estimates.
Approximately 6.4% of the MSP Metro’s residents are Hispanic or Latinx, for comparison, this is 1 percentage
point ahead of Minnesota overall. The share of the population being Hispanic or Latinx increased in the
Suburban Metro, but declined in Minneapolis between the most recent population estimates.
                                                Population Race, All Ages
                                                                                                      7.0%       6.1%
 Suburban MSP                                             81.3%                                              0.4%     3.3%

        St. Paul                            57.0%                                      16.1%   0.8%     18.7%
                                                                                                            5.9%
   Minneapolis                                  63.6%                                          19.2%     1.4%         4.8%
                                                                                                     9.8%
      MSP Metro                                         76.1%                                              0.6% 7.5% 3.6%
                                                                                                               1.0% 1.9%
      Minnesota                                            82.8%                                           6.4% 4.8% 3.0%

                   0%     10%       20%        30%         40%       50%          60%      70%        80%      90%         100%

                        White                                            Black or African American
                        American Indian or Alaska Native                 Asian
                        Native Hawaiian or Other Pacific Islander        Some Other Race
                        Two or More Races

                                                American Community Survey 2015-2019.

                                            Population Ethnicity, All Ages

 Suburban MSP                                                    94.7%                                              5.3%

        St. Paul                                             90.8%                                                 9.2%

   Minneapolis                                              90.4%                                                  9.6%

      MSP Metro                                                 93.6%                                               6.4%

      Minnesota                                                  94.6%                                              5.4%

                   0%     10%       20%       30%        40%        50%          60%     70%         80%     90%      100%

                                  Non-Hispanic White                     Hispanic/Latinx, Any Race

                                                American Community Survey 2015-2019.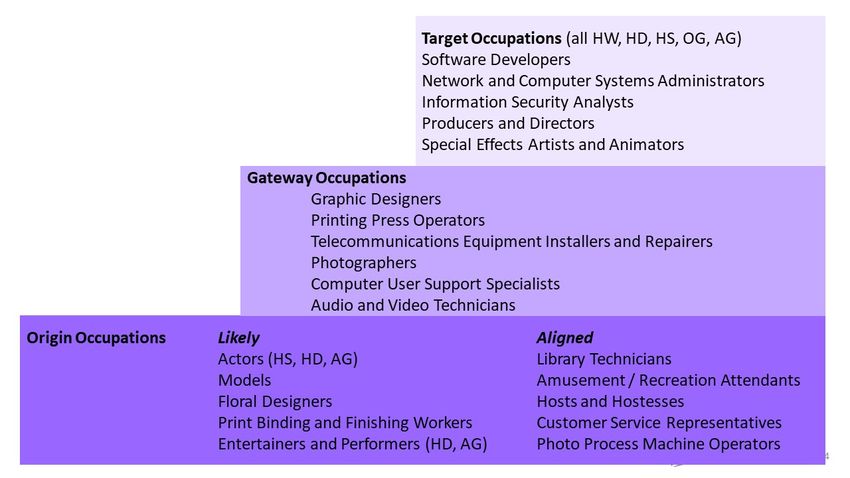
6

                                                      Community Demographics
                                                                          Percent                                      Value
                                                          MSP Metro                                   MSP Metro
Demographics                                              Minnesota      Minnesota        USA         Minnesota      Minnesota        USA
Population (ACS)                                              —              —              —          3,065,147      5,563,378    324,697,795
Male                                                        49.4%          49.8%          49.2%        1,514,230      2,770,873    159,886,919
Female                                                      50.6%          50.2%          50.8%        1,550,917      2,792,505    164,810,876
Median Age2                                                   —              —              —            37.0           38.0           38.1
Under 18 Years                                              23.5%          23.3%          22.6%         720,329       1,295,848     73,429,392
18 to 24 Years                                               8.5%          9.0%           9.4%          261,981       500,630       30,646,327
25 to 34 Years                                              15.1%          13.6%          13.9%         462,318       756,337       45,030,415
35 to 44 Years                                              13.3%          12.5%          12.6%         406,324       697,077       40,978,831
45 to 54 Years                                              13.1%          12.7%          13.0%         402,231       708,668       42,072,620
55 to 64 Years                                              12.9%          13.4%          12.9%         396,303       746,120       41,756,414
65 to 74 Years                                               8.0%          8.8%           9.1%          246,111       490,739       29,542,266
75 Years, and Over                                           5.5%          6.6%           6.5%          169,550       367,959       21,241,530
Race: White                                                 76.1%          82.8%          72.5%        2,331,877      4,609,049    235,377,662
Race: Black or African American                              9.8%          6.4%           12.7%         299,059       356,515       41,234,642
Race: American Indian and Alaska Native                      0.6%          1.0%           0.8%          17,990         58,011       2,750,143
Race: Asian                                                  7.5%          4.8%           5.5%          230,093       268,181       17,924,209
Race: Native Hawaiian and Other Pacific Islander             0.0%          0.0%           0.2%           1,061         2,194         599,868
Race: Some Other Race                                        2.4%          1.9%           4.9%          73,211        104,032       16,047,369
Race: Two or More Races                                      3.6%          3.0%           3.3%          111,856       165,396       10,763,902
Hispanic or Latino (of any race)                             6.4%          5.4%           18.0%         195,477       299,556       58,479,370
American Community Survey 2015-2019 unless noted otherwise.

Employment
As of 2020Q1, total employment for the MSP Metro was 1,875,117 (based on a four-quarter moving average).
By 2021Q1, employment was hit hard by the COVID-19 pandemic and had moderately climbed again to
approximately 1,711,996 (based on a four-quarter moving average). Over the year ending 2021Q1,
employment declined an average of 6.5% in the region.

                                                   Employment for the MSP Metro

Employment data are derived from the Quarterly Census of Employment and Wages, provided by the Bureau of Labor Statistics and imputed where
necessary. Data are updated through 2020Q4 with preliminary estimates updated to 2021Q1.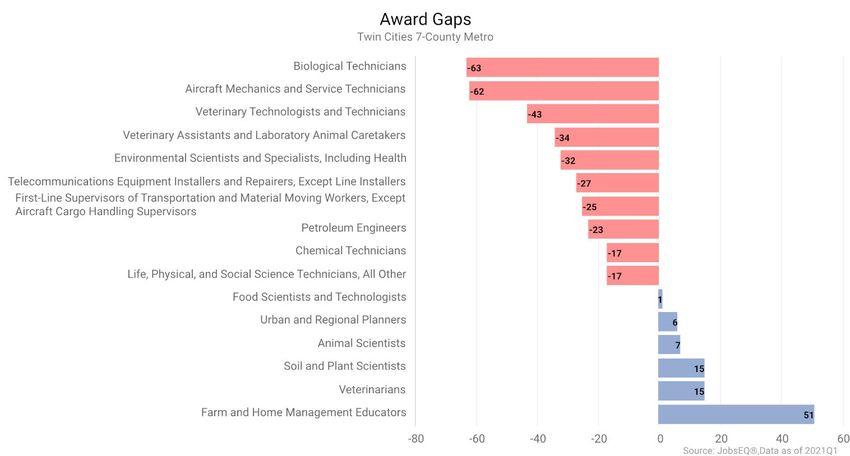
7

  The average worker in the MSP Metro earned annual wages of $70,842 as of 2020Q1, an increase of about
  $6,351 from one year prior, 2020Q1. Average annual wages per worker increased 8.6% in the region over the
  preceding four quarters. Wages rose similarly nationwide, where annual average wages were $63,393 as of
  2021Q1 compared to $57,624 as of 2020Q1. This is due in parge part to the loss of low-wage workers during
  the COVID-19 pandemic and the ongoing challenge of recruiting and hiring talent for entry-level, lower-wage
  jobs, particularly in sectors like hospitality, tourism, retail that were hit hardest by the pandemic.

                                              Average Annual Wages for the MSP Metro

  Annual average wages per worker data are derived from the Quarterly Census of Employment and Wages, provided by the Bureau of Labor Statistics
  and imputed where necessary. Data are updated through 2020Q4 with preliminary estimates updated to 2021Q1.

                                                                    The region has a civilian labor force of 1,743,704 with a
            Labor Force Participation Rate
                                                                    participation rate of 72.0%, which is over two percentage
                                                                    points ahead o
Prime-Age (civilian                                                 f Minnesota’s labor force participation rate for the population
                           88.9%                11.1%
population 25-54)
                                                                    over 16. This may be due, in large part, to the lower median
                                                                    age in the MSP Metro (37 years) than in other parts of the
   16+ Population          72.0%                   28.0%
                                                                    state (38 years statewide). The participation rate of the
                                                                    prime working age population (between the ages of 25 and
                                                                    64) also is ahead of the statewide rate—88.9% compared to
                      0%     20%   40%    60%     80% 100%
                                                                    the statewide 88.4%.
            In Labor Force         Not in Labor Force
                                                                    The MSP Metro area has a lower share of veterans in the
  American Community Survey 2015-2019 unless noted otherwise.       region, at 3.3% of the regional population compared to

  3.8% broadly across the state. However, veteran labor force participation rate is higher in the MSP Metro,
  82.9% compared to 80.4% statewide. Similarly, the MSP Metro area has a lower share of persons with a
  disability, 8.0% compare to 8.7% statewide, but a higher labor force participation rate for the population with a
  disability, 54% compared to 53% statewide. The MSP Metro overall has a small share of disconnected youth
  (1.5% of youth) compared to statewide (1.8%) and national rates (2.5%), but rates vary significantly between
  communities. While just 1.4% of Minneapolis’ youth are disconnected from school, training, or work, about
  double this share of youth (2.9%) in Saint Paul are disconnected.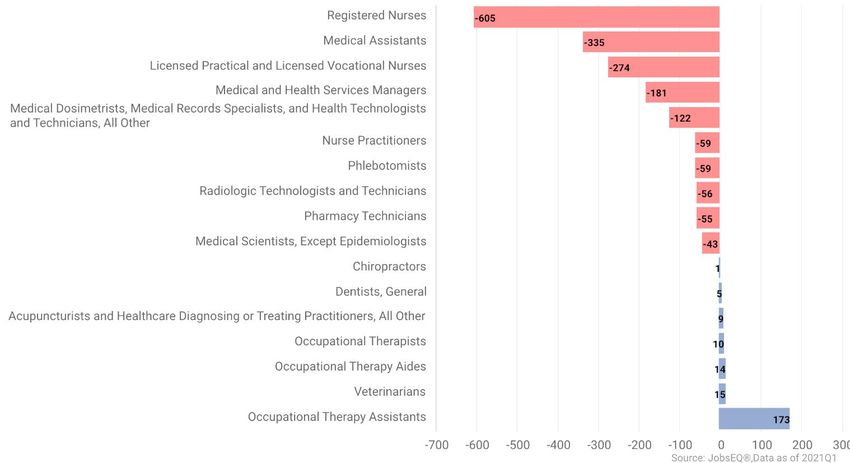
8

                                         Economic and Social Characteristics of the MSP Metro
                                                                   Percent                                        Values
                                                    MSP Metro                                 MSP Metro
         Economic and Social Characteristics        Minnesota     Minnesota       USA         Minnesota          Minnesota                USA

Labor Force Participation Rate and Size (civilian
                                                      72.0%        69.6%        63.2%         1,743,704         3,069,730            163,555,585
population 16 years and over)

Prime-Age Labor Force Participation Rate and
                                                      88.9%        88.4%        82.1%         1,128,537         1,908,936            104,634,905
Size (civilian population 25-54)

Armed Forces Labor Force                              0.0%          0.1%         0.4%           1,207             2,514                1,073,907

Veterans, Age 18-64                                   3.3%          3.8%         4.6%          63,851            130,320               9,143,042
Veterans Labor Force Participation Rate and
                                                      82.9%        80.4%        76.6%          52,903            104,731               7,003,778
Size, Age 18-64
Median Household Income2                                —             —            —           $80,485           $71,306                $62,843

Per Capita Income                                       —             —            —           $42,155           $37,625                $34,103

Poverty Level (of all people)                         9.0%          9.7%        13.4%          270,588           526,065              42,510,843

Households Receiving Food Stamps/SNAP                 7.8%          7.9%        11.7%          93,168            172,477              14,171,567

Enrolled in Grade 12 (% of total population)          1.5%          1.4%         1.4%          46,762             80,319               4,422,344

Disconnected Youth3                                   1.6%          1.7%         2.5%           2,378             4,961                 423,273

Children in Single Parent Families (% of all
                                                      28.1%        28.1%        34.1%          195,824           350,236              23,790,005
children)
Uninsured                                             4.4%          4.5%         8.8%          132,706           246,184              28,248,613
With a Disability, Age 18-64                          8.0%          8.7%        10.3%          153,615           293,656              20,187,604

With a Disability, Age 18-64, Labor Force
                                                      54.0%        53.0%        42.2%          82,890            155,592               8,509,463
Participation Rate and Size

Foreign Born                                          12.1%         8.5%        13.6%          370,577           472,849              44,011,870
American Community Survey 2015-2019 unless noted otherwise.
*Median values for certain aggregate regions (such as MSAs) may be estimated as the weighted averages of the median values from the composing
counties. **Disconnected Youth are 16-19 year olds who are (1) not in school, (2) not high school graduates, and (3) either unemployed or not in the
labor force.

Education
                                        93.8% of prime working age adult residents
                                        have at least a high school diploma or GED.

In the MSP Metro, 6.2% of adults between the ages of 25 and 64 do not have a high school diploma or
equivalent, and about 17.8% have a high school diploma as their highest level of education (compared with
21.7% statewide). Some communities of the MSP Metro have as high as 20% of prime working age adults in a
neighborhood with no high school diploma or GED credential. Nationwide, 10.9% of U.S. residents between the
ages of 25 and 64 never completed high school or obtained an equivalent credential. The prime working age
population of St. Paul has a larger share of residents with a high school diploma or less (13.2%, or 21,282
people), while Suburban MSP and Minneapolis have a smaller share of residents with lower educational
attainment (4.5% or 53,303 in the suburbs and 9.6% or 22,857 people in the City of Minneapolis).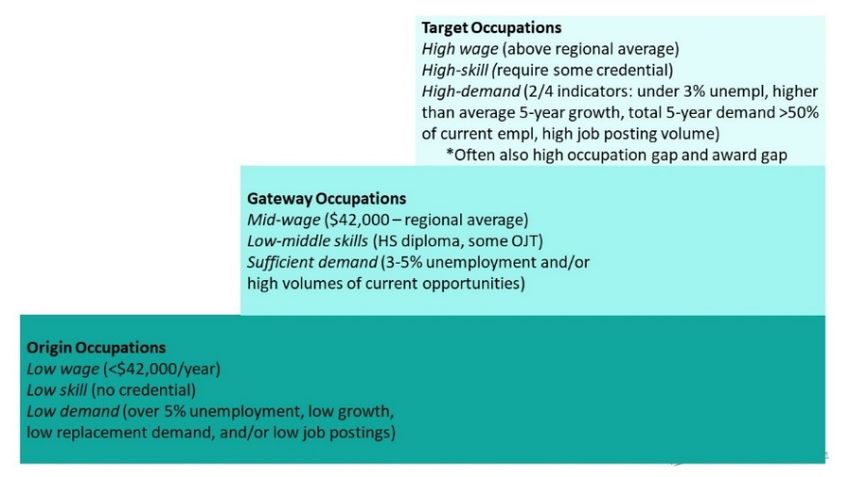
9

                                          Educational Characteristics of MSP Metro Minnesota
                                                                                  Percent                                            Values
                                                                MSP Metro                                         MSP Metro
Educational Characteristics
                                                                Minnesota        Minnesota            USA         Minnesota       Minnesota            USA
No High School Diploma                                                6.2%            6.1%           10.9%           103,057         178,196        18,550,150
High School Graduate                                                  17.6%       21.7%              25.7%           293,174         632,253        43,627,868
Some College, No Degree                                               19.0%       21.0%              20.7%           316,205         610,250        35,174,790
Associate's Degree                                                    10.7%       12.9%               9.1%           178,725         374,770        15,526,064
Bachelor's Degree                                                     30.5%       25.6%              21.2%           509,305         744,024        35,997,848
Postgraduate Degree                                                   16.0%       12.7%              12.3%           266,710         368,709        20,961,560
American Community Survey 2015-2019 unless noted otherwise.

                                                    Educational Attainment, Age 25-64

 Suburban MSP           4.5%          18.1%             19.7%                 11.8%                   30.9%                      15.0%

           St. Paul           13.2%            19.5%               17.8%              8.0%                25.4%                  16.1%

     Minneapolis           9.6%         14.2%           16.9%           7.5%                      31.9%                        19.9%

       MSP Metro        6.2%           17.6%             19.0%                10.7%                   30.5%                      16.0%

       Minnesota        6.1%            21.7%                  21.0%                  12.9%                  25.6%                12.7%

                      0%          10%         20%      30%        40%           50%          60%          70%        80%       90%        100%

                    No High School Diploma               High School Graduate or GED              Some College, No Degree
                    Associate's Degree                   Bachelor's Degree                        Postgraduate Degree

                                                         American Community Survey 2015-2019.

Regional Colleges and Universities
The MSP Metro has 26 institutions of higher education that offer non-degree awards, two-year degrees, and
four-year degrees. The table below shows these postsecondary institutions sorted by enrollment size in during
the 2018-19 school year.

                                                         Certificates and 2yr                                     Total School
                         School                                 Awards                   4yr Awards                Enrollment                 Avg Net Price
University of Minnesota-Twin Cities                              216                         9,224                    50,734                    $16,691
Walden University                                                 0                          2,214                    50,360                    $21,276
Capella University                                               28                          3,751                    37,171                    $13,387
University of St Thomas                                          56                          1,798                    10,035                    $30,183
Normandale Community College                                    1,339                         0                       9,784                     $12,248
Century College                                                 2,043                         0                       8,891                     $10,600
Anoka-Ramsey Community College                                  1,270                         0                       8,845                     $11,594
Metropolitan State University                                    11                          1,966                    7,861                     $14,900
Minneapolis Community and Technical College                     1,280                         0                       6,951                     $12,868
Saint Paul College                                              1,350                         0                       6,912                     $11,973
10
Certificates and 2yr Total School
School Awards 4yr Awards Enrollment Avg Net Price
North Hennepin Community College 1,141 0 6,286 $10,189
Concordia University-Saint Paul 9 843 5,054 $18,591
St Catherine University 295 678 4,859 $20,157
Hennepin Technical College 1,422 0 4,762 $12,675
Inver Hills Community College 808 0 4,264 $10,554
Bethel University 26 942 3,692 $27,085
University of Northwestern-St Paul 20 731 3,623 $24,286
Hamline University 67 706 3,526 $22,079
Augsburg University 0 638 3,419 $24,608
Dakota County Technical College 836 0 2,523 $10,993
Macalester College 0 679 2,174 $29,013
Anoka Technical College 916 0 1,844 $12,368
Crown College 21 274 1,510 $24,220
Dunwoody College of Technology 397 63 1,316 $21,797
Mitchell Hamline School of Law 0 0 1,154 n/a
Total 15,025 25,162 254,385 n/a
Economic Indicators
Gross Domestic Product (GDP) is the total value of goods and services produced by a region. In 2020, nominal
GDP in the MSP Metro contracted 2.6%. This follows growth of 3.1% in 2019. As of 2020, total GDP in the
MSP Metro was $252,537,469,000.
One-Year % Change in GDP, MSP Metro
Gross Domestic Product data are provided by the Bureau of Economic Analysis, imputed by Chmura where necessary, updated through 2020.
Of the industries represented in the MSP Metro, Real Estate and Rental and Leasing contributed the largest
portion of GDP in 2020, $34,069,928,000 The next-largest contributions came from Manufacturing
($31,687,551,000); Finance and Insurance ($30,098,824,000); and Health Care and Social Assistance
($21,256,995,000).11
Gross Domestic Product data are provided by the Bureau of Economic Analysis, imputed by Chmura where necessary, updated through 2020.
The Workforce of Today and Tomorrow
Workforce Forecast
The pandemic has been anything but “sharp and short.” Instead, many businesses have sustained ongoing
impacts which have translated into business closures and reduction in workforce. Additionally, some individuals
have chosen to exit the workforce entirely to care for family members or support children who are attending
school remotely. Employment dropped by -8.9% between 2020Q1 and 2021Q1, with an estimated 6.7% of the
MSP Metro population being unemployed by the start of 2021. Future growth in jobs in the region is forecasted
to grow by about 1.6% averaged annually through 2025 in the most optimistic scenario shown below in black,
though lagging behind employment in prior years considerably. A pessimistic forecast based on baseline data
from the Bureau of Labor Statistics and the MN Department of Employment and Economic Development,
assuming the pandemic’s effects do not worsen nor get better, puts employment growth closer to 0.4%.12
5-Year Forecast Comparison in the MSP Metro
An industry clusterr is a geographic concentration of interrelated industries or occupations. The industry cluster
in the MSP Metro with the highest relative concentration is Electric/Electronics Manufacturing with a location
quotient of 2.30. This cluster employs 43,438 workers in the region with an average wage of $102,213.
Employment in the Electric/Electronics Manufacturing cluster is projected to remain flat over the next ten years.
Industry Clusters in the MSP Metro, 2021Q1Mid-Term Occupational Impacts HIGH CONTACT-INTENSITY OCCUPATIONS The pandemic has had some surprising impacts on talent demand due to changing healthcare, human services, supply chain, and customer service needs. For roles that require close contact with the public, high growth was forecast in the MSP Metro just prior to the pandemic, but quickly shifted as businesses temporarily or permanently closed their doors. One year ago, we had estimated that about 41,000 (-9.4%) of the 434,344 people employed locally in high contact-intensity roles during 2020Q1 would lose their employment by 2021Q1. Instead, employment in these high contact-intensity roles dropped to 383,184 across the MSP Metro, closer to 50,000 in losses. About 30,631 people are now unemployed but skilled in these high contact-intensity positions locally, a combined unemployment rate across these positions of 7.8%. Roles that saw some of the biggest losses in employment were Fast Food and Counter Workers (- 8,241 or -18.7%), Waiters and Waitresses (-11,731 or -42.6%), Passenger Vehicle Drivers (-2,421 or - 20.6%), and Bartenders (-3,949 or -42.6%). These occupations also have the highest estimated unemployment rates, and many other individuals previously in these roles have taken new career and educational paths since the pandemic began. Just a few high contact-intensity positions in the Human Services and Health Science Technology fields have actually seen increased demand and growth in employment counts between 2020Q1 and 2021Q1, including Personal Care Aides (+4.5%), Pharmacy Technicians (+0.3%), and Phlebotomists (0.4%).
Top 15 High Contact-Intensity Occupations by Total Employment with Optimistic COVID-19 Modeled Forecast, 2021Q1
                                                            2021Q1                                  1-Year History                     Optimistic 5-Year Forecast
                                                Mean Ann                      Unempl    Online     Empl                 Total
                                      Empl                 LQ     Unempl                                      Ann %                 Exits    Transfers   Empl Growth   Ann %
                                                 Wages2                        Rate    Job Ads3   Change               Demand
   SOC            Occupation                                                                                                                                           Growth
31-1122   Personal Care Aides        41,945     $30,000    1.44      2,259     5.6%     1,008      1,807       4.5%     40,153     17,735     15,578         6,841     3.1%
29-1141   Registered Nurses          36,626     $87,100    1.05       705      1.9%     2,289      -1,502     -3.9%     11,917      5,317     4,937          1,663     0.9%
          Fast Food and Counter
35-3023                              35,874     $27,200    0.93      4,552    12.1%     2,937      -8,241     -18.7%    50,418     18,615     21,930         9,873     5.0%
          Workers
          Heavy and Tractor-
53-3032                              17,673     $54,100    0.79      1,041     6.0%     1,142      -766       -4.2%     11,222      3,762     6,698          762       0.8%
          Trailer Truck Drivers
          Waiters and
35-3031                              15,802     $31,600    0.77      3,717    20.1%      494      -11,731     -42.6%    23,403      6,809     12,138         4,456     5.1%
          Waitresses
31-1131   Nursing Assistants         15,541     $39,500    0.97       747      5.0%     1,295      -1,028     -6.2%     10,487      4,463     4,794          1,230     1.5%
31-1121   Home Health Aides          14,849     $30,000    1.45       742      5.2%      328       -1,109     -7.0%     11,947      4,585     4,925          2,437     3.1%
          Elementary School
25-2021   Teachers, Except           12,447     $67,100    0.84       588      4.3%      420       -751       -5.7%     6,366       2,111     2,928          1,327     2.0%
          Special Education
53-3033   Light Truck Drivers        11,038     $45,100    0.92       613      5.9%      573       -551       -4.8%     7,689       2,435     4,336          918       1.6%
39-9011   Childcare Workers          9,973      $30,200    1.03      1,279    12.2%      432       -1,454     -12.7%    10,534      4,302     4,360          1,873     3.5%
          Secondary School
          Teachers, Except
25-2031   Special and                9,721      $67,800    0.90       307      3.0%      599       -558       -5.4%     4,767       1,490     2,235          1,043     2.1%
          Career/Technical
          Education
          Passenger Vehicle
          Drivers, Except Bus
53-3058                              9,355      $38,800    1.13      2,117    20.1%      218       -2,421     -20.6%    8,997       3,997     2,857          2,143     4.2%
          Drivers, Transit and
          Intercity
          First-Line Supervisors
35-1012   of Food Preparation        8,015      $43,300    0.81       761      9.5%     3,320      -2,654     -24.9%    9,421       2,143     5,308          1,971     4.5%
          and Serving Workers
          Licensed Practical and
29-2061   Licensed Vocational        7,559      $52,900    0.97       207      3.0%      831       -623       -7.6%     3,670       1,370     1,692          608       1.6%
          Nurses
          High Contact-Intensity
                                    383,184     $54,200    0.98      30,631    7.8%    25,543     -49,188     -11.4%   302,931     109,476   138,165        55,289     2.7%
          Occupations

          Total - All Occupations   1,711,996   $63,000    1.00   114,969      6.7%    112,575    -166,270    -8.9%    1,167,086   386,893   635,319       144,875     1.6%
SEVERE OCCUPATION GAPS
Estimation of mid-term and long-term recovery of critical local occupations is based on our most
reasonable hypothesis given current conditions. In the MSP Metro, an analysis of local labor market
occupational gaps as of the first quarter of 2020 showed that there is a shortage of local Nurses,
Software Developers, General and Operations Managers, Computer Systems Analysts, and Financial
Managers, among other critical healthcare, information technology, and management occupations. By
the first quarter of 2021, forecasted talent gaps for each of these occupations remained, but with some
changes to the volume of anticipated gaps. Among high contact-intensity roles in shortage, Registered
Nurses, Nurse Practitioners, and Licensed Practical Nurses ranked in the top three spots, while
Hospitality and Tourism roles are forecast to have a surplus of talent. Based on forecasted growing
demand for health, education, human services, and remote work-friendly management positions,
these occupations of shortage are likely to rebound and grow in demand as the pandemic subsides,
possibly beyond initial forecasts. All of the top ten positions of highest forecasted talent shortage pay
wages over $52,000 per year. Most occupations of shortage require an Associate’s degree or higher.
Conversely, none of the ten positions forecast to have the highest surplus of talent in the MSP Metro
as of the first quarter of 2020 or 2021 typically require an advanced degree, and only one of the ten
pays over $43,000 on average. Six out of ten of these positions typically cannot be done remotely, and
seven out of ten of these positions are considered high contact-intensity. Given the impacts of the
COVID-19 pandemic on local industry, these occupations of anticipated high talent excess will likely
decline in overall local demand and shift dramatically in how work is done on a daily basis.
Average Annual Occupation Gaps (i.e. Talent Shortage), 2021Q1 through 2031Q116
Expected growth rates for occupations vary by the education and training required. Overall,
employment forecasts have dropped from last year’s estimate of 0.6% to just 0.4% average annual
growth over the next ten years. Growth in occupations typically requiring a postgraduate degree
dropped to just 0.9% per year, those requiring a bachelor’s degree are forecast to grow 0.6% per year,
and occupations typically needing a 2-year degree or certificate are expected to grow 0.5% per year.
Jobs that typically require moderate on-the-job training but no formal degree are now forecast to
decline year-over-year on average by about -0.2%. Estimated wages have increased across careers
at each education level requirement.
Annual Average Projected Job Growth by Training Required for the MSP Metro
Employment by occupation data are estimates are as of 2021Q1. Education levels of occupations are based on BLS assignments. Forecast
employment growth uses national projections from the Bureau of Labor Statistics adapted for regional growth patterns.
EMERGING CAREER PATHS
Online job posting data can tell us a lot about employer demand for certain skills, certifications,
qualifications, and occupational competencies. Too often jobseekers limit their search to careers
matching prior job titles or formal education. However, taking a non-traditional education path doesn’t
mean a person doesn’t have the skills necessary for in-demand jobs or career paths outside their
formal education. And increasingly, employers are more focused on skills than degrees.
Total Jobs Advertised Monthly in the MSP Metro, September 2019 – 202117
During the first six months of the COVID-19 pandemic, 3 there were 308,526 new jobs advertised in the
region—a decrease of about 18% from the same six months in 2019. The top three positions
advertised by volume were for Software Developers (Applications), Heavy Truck Drivers, Laborers
and Freight Movers, and Registered Nurses. Personal Care Aide job posting volumes doubled
between 2020 and 2019. This reflects the sudden and growing local demand for entry-level healthcare
and human services talent, particularly those with at least a 2-year degree in a related area of study.
Over the past 12 months, several of these occupations have continued to see growth in postings,
including Software Developers, general computer occupations, Truck Drivers, and Laborers.
Additionally, administrative, management, and marketing roles have begun to spike in volume
considerably.
Top Emerging Occupations in the MSP Metro, March 1-August 31, 2021
compared to the same dates in 2020 (high-growth occupations by order of volume of postings)
1. Software Developers, Applications (+10%)
2. Heavy and Tractor-Trailer and Truck Drivers (+15%)
3. Laborers and Freight, Stock, and Material Movers (+251%)
4. Stock Clerks—Stockroom (+86%)
5. Personal Care Aides (+108%)
6. Insurance Sales Agents (+38%)
7. Computer Systems Engineers (+5%)
8. Nursing Assistants (+1%)
9. Information Security Analysts (+19%)
10. Loan Interviewers and Clerks (+131%)
Top Sustaining Occupations in the MSP Metro September 2020 – 2021
1. Software Developers, Applications (+20%)
2. Registered Nurses (+38%)
3. Computer Occupations (+24%)
4. Heavy and Tractor-Trailer and Truck Drivers (+49%)
5. Marketing Managers (+68%)
6. Management Analysts (+19%)
7. Laborers and Freight, Stock, and Material Movers (+23%)
8. Accountants and Auditors (+5%)
9. Industrial Engineers (+35%)
10. Supervisors of Office and Administrative Support Workers (+3%)
Talent accumulates valuable skills in many different ways beyond just work and education, from self-
study to apprenticeships/internships, as well as workforce training programs and general life
experience all develop relevant skills. Assessing experience in terms of skills unearths a person’s
qualifications and more clearly identifies training needs. It also helps people recognize the abilities
and knowledge they don’t know they have.
3 March 15-June 15, 2020.18
For example, servers trying to move beyond a likely transition (bartending, retail sales, and other
hospitality jobs) to an aligned transition like public relations specialist, skills tell us where their current
qualifications align and where there are gaps. This kind of gap analysis is possible at the occupation
level and supports with postsecondary planning, workforce development, and employer talent
strategy.
The certifications and technical skills in demand locally match to the customer service, and entry-level
health care positions available in high volumes in the region, with Commercial Drivers Licenses,
Registered Nurse Certification, Accounting, Licensed Practical Nursing, and Hospice and Palliative
Care Certification appearing in high volumes in local job postings during this period compared to a full
year prior. In general, most human skills were mentioned in job postings as required competencies for
candidates in lower frequencies from throughout the pandemic period thus far. The majority of rising
skills are focused in Information Technology capacities.
Top Emerging Skills in the MSP Metro in Order of Frequency, with percent change from prior year
in Job Postings, September 2020 - 2021
1. Supervision (+40%)
2. Software Engineering (+40%)
3. Product Development (+34%)
4. English Language Skills (+33%)
5. Software Development (+24%)
Telecommuting and work-from-home continues to appear in job posting requirements locally,
increasing 144% in the past 12 months (September 2020-2021) compared to the prior year
(September 2019-2020).
Trends in Remote Work Opportunities Advertised Online, MSP Metro 2021Q119
Remote work opportunities increased significantly among Information Technology careers and
Business, Management, and Administration roles over the past 12 months compared to the 12 months
prior.
Change in Volume of Remote Work Opportunities by Occupation in the MSP Metro,
September 2020-2021 Compared to 12 months prior
1. Software Developers, Applications (276%)
2. Computer Occupations, All Other (226%)
3. Marketing Managers (366%)
4. Management Analysts (250%)
5. Customer Service Representatives (267%)
6. Accountants and Auditors (425%)
7. Managers, All Other (215%)
8. Computer User Support Specialists (52%)
9. Market Research Analysts and Marketing Specialists (310%)
10. Computer Systems Analysts (144%)
Currently, the occupations with highest estimated unemployment rates in the MSP Metro are
Choreographers (39.3%), Dancers (38.5%), Reinforcing Iron and Rebar Workers (32.1%), and Food
Preparation and Serving Workers (30.3%). Demonstrators and Product Promoters (29%
unemployment) is an occupation that has a high level of alignment in skills and experience for several
career pathways and high-skill, high-demand occupations in the region. Likely transitions for local
entry-level Product Promoters include a variety of marketing and sales positions like Merchandisers
and Window Trimmers, while other aligned positions that could support movement into entirely
different career paths that have forecasted talent shortages include Home Health Aides, Personal
Care Aides, Barbers, and Postal Service Clerks.20
Career Field Insights
Analysis of the sixteen CTE Clusters provides an entryway into career pathways, summarizing where
opportunities are greatest among hundreds of occupations.
Of sixteen career clusters used by Career and Technical Education (CTE), four are forecast in a
worst-case scenario model to decline in overall employment over the next ten years. The clusters
expecting the greatest growth are Human Services (19.5%), Health Science (11.1%), and Information
Technology (9.9%). The metro is the only region in the state where IT ranks in one of the top three
clusters of highest percent growth (though it ranks fourth in the Northeast, Southeast, and Central
regions). In contrast, Arts, Audio/Video Technology and Communications (-5.2%) and Manufacturing
(-2.3%) are anticipating the greatest declines in overall employment, matching with similar trends seen
in other regions of the state. Of the thirteen career clusters expected to grow, eight pay more than the
average occupation wage in the region ($63,000 in 2020—an increase from $59,700 as of 2019). 4
Comparing current baseline forecasts to the same forecasts modeled one year ago, all but three
Career Clusters are forecasting lower baseline employment growth over ten years than what was
estimated last year: 1) Science, Technology, Engineering, and Mathematics, 2) Arts, A/V Technology,
and Communications, and 3) Manufacturing all saw employment forecasts improve slightly.
Baseline Worst-Case Scenario 10-Year Forecasts by Career Cluster, MSP Metro 2021Q1
Cluster forecasts estimated using Chmura, JobsEQ, based on 2020Q1 employment data. All clusters are distinct occupations except for
Agriculture, Food, and Natural Resources, which overlaps with other clusters.
An accurate assessment of future occupation demand requires that both future growth and the
number of people retiring be taken into account. In the MSP Metro, Hospitality & Tourism, Business,
Management, and Administration, and Marketing, Sales, and Service clusters are expected to have
the highest annual job demand by volume of opportunities—due to retirements and job changes.
Science, Technology, Engineering & Mathematics has the highest wages of the Career Clusters
followed by the Information Technology and Finance clusters.
4
Clusters paying an average salary higher than the regional average occupation wage include Science, Technology, Engineering, and
Mathematics, Information Technology, Finance, Health Science, Government and Public Administration, Law, Public Safety, Corrections,
and Security, Business, Management, and Administration, and Architecture and Construction.21
Baseline 10-Year Ann
Avg Ann Forecasted Empl Empl Ann Total
Career Cluster Employment Wages Job Ads Change Growth Demand
Science, Technology, Engineering &
30,001 $103,600 3,638 5.5% (+) 160 2,484
Mathematics
Information Technology 70,307 $96,700 9,911 9.9% 661 5,983
Finance 91,254 $88,700 6,036 1.5% 129 8,568
Health Science 159,600 $77,100 13,118 11.1% 1,692 14,379
Law, Public Safety, Corrections & Security 46,874 $74,600 1,903 1.7% 75 4,389
Government & Public Administration 16,647 $72,100 822 2.7% 43 1,515
Business, Management & Administration 324,665 $70,200 18,536 -1.8% -588 34,187
Architecture & Construction 97,659 $67,100 2,279 3.5% 334 10,829
Arts, A/V Technology & Communications 31,501 $61,500 1,003 -5.2% (+) -172 3,189
Education & Training 102,232 $61,300 5,512 7.0% 690 10,319
Agriculture, Food & Natural Resources* 69,124 $60,900 3,255 5.0% 349 8,435
Marketing, Sales & Service 188,481 $58,800 16,258 -0.4% -84 24,274
Manufacturing 142,229 $50,600 6,826 -2.3% (+) -344 15,067
Transportation, Distribution & Logistics 124,148 $49,700 5,571 3.8% 456 15,375
Human Services 113,580 $42,000 5,923 19.5% 2,043 17,241
Hospitality & Tourism 156,914 $33,100 14,303 6.3% 958 26,863
Total - All Occupations 1,711,996 $63,000 112,575 4.0% 6,433 197,114
*Cluster forecasts estimated using Chmura, JobsEQ, based on 2021Q1 employment data. All clusters are distinct occupations except for
Agriculture, Food, and Natural Resources, which overlaps with other clusters. (+) indicates an improved forecast from 2020Q1 estimates.22
HEALTH SCIENCE TECHNOLOGY
Health Science Technology is a critical Career Field to secure the public health of the entire
state. The COVID-19 pandemic has made this reality even more clear, and further strained
the workforce challenges faced in this sector.
Over the next three years, under a pessimistic baseline forecast, Health Science Technology
employment is forecast to grow by 1.1% annually. In the most optimistic scenario feasible
based on employer demand, and given the existing talent shortage and talent pipelines in
place, employment growth of 1.9% annually in this field could be possible.
Baseline Worst-Case Scenario 3-Year Forecast for Health Science Technology Careers,
MSP Metro 2021Q1
Top Ten Health Science Technology Occupations by Employment Volume in the MSP Metro,
2021Q1
Baseline
Historical 3- Forecast
Avg Mean Year Empl Annual Ann
6-Digit Occupation Empl Wages LQ Change Demand Growth
Registered Nurses 36,626 $87,100 1.05 9 2,215 0.6%
Nursing Assistants 15,541 $39,500 0.97 -926 1,879 0.6%
Home Health Aides 14,849 $30,000 1.45 -1,670 2,266 2.9%
Licensed Practical and Licensed Vocational Nurses 7,559 $52,900 0.97 -787 654 0.8%
Medical Secretaries and Administrative Assistants 7,115 $44,000 1.01 -70 867 0.7%
Medical Assistants 6,476 $44,400 0.78 29 853 1.6%
Medical and Health Services Managers 4,831 $120,500 1.01 239 556 2.7%
Pharmacy Technicians 4,751 $41,300 0.99 36 396 0.2%
Physicians, All Other; and Ophthalmologists, Except Pediatric 4,449 $237,800 0.96 80 150 0.4%
Pharmacists 3,861 $131,300 1.03 -4 154 -0.4%
Remaining Component Occupations 53,543 $88,000 0.97 -921 4,320 1.0%
Health Science (CTE Cluster) 159,600 $77,100 1.00 -3,987 14,379 1.1%
“Annual Demand” is the projected need for new entrants into an occupation. New entrants are needed due to expected growth and to
replace workers who left the occupation due to factors such as retirement or switching careers.
“Forecast Ann Growth” is the expected baseline (most pessimistic) yearly change in employment due to national, long-term trend
projections (per the BLS) as well as local factors such as industry mix, labor force participation rates, and population growth (as computed
and modeled by RealTime Talent in JobsEQ).23
Most talent in the MSP Metro that is working in Health Science Technology roles are employed by
General Medical and Surgical Hospitals (29.1%) or Offices of Physicians (14.1%). The rest are
employed in care facilities, other medical offices, and schools. Hospitals will require the greatest
increase in additional talent to fill future roles over the next ten years.
Health Science Technology Field Employment by Industry, 2021Q1, MSP Metro
% of Career Career Field 10-Year 10-Year Empl 10-Year Total
Industry Title Field Empl Empl Separations Growth Demand
General Medical and Surgical Hospitals 29.1% 46,400 31,048 1,245 32,293
Offices of Physicians 14.1% 22,572 16,608 2,864 19,472
Nursing Care Facilities (Skilled Nursing Facilities) 7.0% 11,243 10,151 -235 9,917
Individual and Family Services 6.3% 10,102 12,548 4,332 16,881
Home Health Care Services 5.4% 8,553 8,201 2,326 10,527
Offices of Dentists 4.7% 7,435 6,438 395 6,833
Offices of Other Health Practitioners 3.6% 5,705 4,314 1,105 5,419
Continuing Care Retirement Communities and Assisted
3.0% 4,848 5,285 1,327 6,612
Living Facilities for the Elderly
Health and Personal Care Stores 2.9% 4,695 3,147 -342 2,805
Outpatient Care Centers 2.9% 4,651 3,693 1,285 4,978
Residential Intellectual and Developmental Disability,
2.3% 3,728 3,902 619 4,521
Mental Health, and Substance Abuse Facilities
Other Professional, Scientific, and Technical Services 2.0% 3,250 3,054 515 3,570
Management of Companies and Enterprises 1.6% 2,623 1,996 192 2,188
Insurance Carriers 1.4% 2,171 1,452 313 1,765
Employment Services 1.4% 2,167 1,705 37 1,742
Colleges, Universities, and Professional Schools 1.3% 2,126 1,492 51 1,543
Other Ambulatory Health Care Services 1.2% 1,884 1,669 536 2,206
Elementary and Secondary Schools 1.1% 1,685 1,066 179 1,244
Medical and Diagnostic Laboratories 0.9% 1,383 1,085 210 1,295
Specialty (except Psychiatric and Substance Abuse)
0.9% 1,357 1,050 363 1,413
Hospitals
All Others 6.9% 11,023 8,575 476 9,05124
Career Field Demographics
The Health Science Technology field is predominantly female (78%) and white (77%). Half of the
Health Science Technology workforce in the region is between the ages of 25 and 44.
Educational Attainment and Requirements
The stacked bar chart here illustrates the estimated mix of educational attainment of the workers in
this occupation(s) in aggregate. In general, the MSP Metro Health Science Technology workforce has
a close match to the education and training required for existing roles. For example,18.6% of the
Health Science Technology workforce hold a two-year degree and 12.5% completed some college
(such as a certificate), or 31.1% in all, compared to about 33% of local jobs in Health Science
Technology that typically require a certificate two-year degree. The table below indicates typical
education and training requirements rather than the mix of attainment of workers in such positions.
Typical Education Requirements for Top Occupations by Volume, 2021Q1
Previous Work Typical On-the-Job
Occupation Typical Entry-Level Education Experience Training
Registered Nurses Associate or Bachelor's degree None None
Nursing Assistants Postsecondary non-degree award None None25
Previous Work Typical On-the-Job
Occupation Typical Entry-Level Education Experience Training
Short-term on-the-
Home Health Aides High school diploma or equivalent None
job training
Licensed Practical and Licensed Vocational Nurses Postsecondary non-degree award None None
Moderate-term on-
Medical Secretaries and Administrative Assistants High school diploma or equivalent None
the-job training
Medical Assistants Postsecondary non-degree award None None
Medical and Health Services Managers Bachelor's degree < 5 years None
Moderate-term on-
Pharmacy Technicians High school diploma or equivalent None
the-job training
Physicians, All Other; and Ophthalmologists, Except
Doctoral or professional degree None Internship/residency
Pediatric
Pharmacists Doctoral or professional degree None None
Occupation Gaps
The chart below shows the potential average annual gaps over 10 years. Many variables go into this
analysis, but at its core it is based on a forecast comparing occupation demand growth to the local
population growth and the projected educational attainment of those residents, then matched to
specific related programs offered locally. When an area, for example, has an occupation expected to
grow quickly but the educational requirement for the occupation does not match well with the
educational attainment of its residents, there is a high potential for an occupation shortfall in the
region. Alternatively, slow-growing or contracting occupations often represent potential supply
surpluses.
The potential supply shortfall is an underlying force that the market needs to resolve one way or
another, such as by employers recruiting from further distances for these occupations, wages going
up to attract more candidates, and/or increased demand and wages enticing more local residents to
get training for these occupations. While this an important analysis for determining local occupation
needs, the occupation gap should be considered along with other regional data including growth and
separation forecasts, unemployment rates, wage trends, and award and skill gap analyses.
In Health Science Technology, Registered Nurses are the occupation of second-highest annual
shortages in the MSP Metro and #1 statewide. This critical talent shortage is due in large part to
forecasted employment growth and replacement demand needs due to retirements combined with
insufficient talent coming through Registered Nursing programs at both the 2-year and 4-year levels.26
Annual Average Occupation Gaps (i.e. Talent Shortages) for the next 10 Years in Health Science
Technology, MSP Metro 2021Q1
Award Gaps
A comparison of the graduate talent pipeline through certificate and other postsecondary degree
programs to the current estimated openings by occupation illuminate a number of distressing
shortages. The MSP Metro faces significant Health Science Technology award gaps, meaning that the
region is underproducing local talent in relation to employer demand. For instance, MSP Metro
colleges and universities are underproducing about 605 graduates annually that are needed to fill
Registered Nursing positions open with employers based in the 7-county MSP Metro. This is a
significant shortage of awards, which exacerbates the forecasted occupation gap highlighted above.
Several occupations that typically require a certificate or 2-year program also have local award gaps,
including LPNs, Medical Managers, Phlebotomists, and a number of Technician roles. Occupations
that show higher awards given than what is currently needed in the local talent market are examples
of programs that serve other parts of the state where talent demand is high but relevant programs may
not exist.27
Award Gaps in Health Science Technology, MSP Metro 2021Q1
Certification Gaps
Similar to award gaps, an analysis of certification gaps identify where the existing talent pool lacks
particular credentials in comparison to current openings. However, this analysis uses real-time labor
market data in the form of online candidate profiles and job postings to analyze the alignment between
the available workforce and local opportunities. In the table below, it is apparent that the programs
aligned to the occupations above as well as shorter training programs are both needed to connect
local talent with opportunities.
Top 10 Certification Gaps in the MSP Metro, August 2021
Name Candidates Openings Gap
Licensed Practical Nurse (LPN) 436 903 -467
Medical Technologist (Medical Technologists) 20 79 -59
Certified Nursing Assistant (CNA) 1,102 1,143 -41
Certified Home Health Aide 35 67 -32
Certified Clinical Medical Assistant (NHA) 13 43 -30
Pediatric Advanced Life Support (PALS) 88 115 -27
Trauma Nursing Core Course (TNCC) 28 55 -26
Registered Dental Assistant (RDA) 15 39 -24
National Phlebotomy Association Certified
43 67 -24
Phlebotomist
Registered Respiratory Therapist (RRT) 13 37 -24
Skill Gaps
Likewise, there is a degree of misalignment between the skills of the available workforce and the skills
advertised by local employers. The ten skills listed below are examples of the skills in most high
demand among MSP Metro employers hiring Health Science Technology talent that potential
candidates have not indicated in their professional networking platforms as a strength.28
Top 10 Skill Gaps in Twin Cities 7-County Metro
Name Candidates Openings Gap
Home Health Care 937 1,210 -273
Unity 67 295 -228
Keyboarding/Typing 286 484 -197
Electronic Health Record (EHR) 247 443 -197
Teaching/Training, Job 318 507 -189
Microsoft Office 447 574 -127
Microsoft Word 248 359 -110
Medical Terminology 666 760 -94
Microsoft Outlook 271 354 -83
Geriatric 133 216 -83
Promising Pathways
This section offers an origin-to-gateway-to-target model analysis for how to help move students from
entrypoints into their field of interest into both likely and other aligned careers, taking into account
automation, remote work, and the changing work environment.
Origin-to-Gateway-to-Target Occupations for Health Science Technology, MSP Metro 2021Q1
HW = High-Wage; HS=High-Skill; HD=High-Demand; OG=Occupation Gaps; AG=Award Gaps
Origin Occupations are roles that are low-wage (29
occupations offer a wage uplift to those previously employed in Origin Occupations, and offer longer-
term economic mobility and career advancement opportunities. These are most often best-suited for
adult workforce programming and first postsecondary experiences.
Likely Gateways Aligned Gateways
Licensed Practical and Licensed Vocational Nurses Postsecondary Teachers
Medical Dosimetrists Social and Human Services Assistants
Medical Equipment Preparers Supervisors of Office and Administrative Support Workers
Medical and Clinical Lab Technologists / Technicians Eligibility Interviewers
Veterinary Technologists Residential Advisors
Target Occupations refer to high-wage occupations that pay at or above the region’s average wage
($63,000 in the MSP Metro). These positions are also high-skill—meaning that they require an industry
credential, certification, or higher education—and high-demand. Many of these Target Occupations
are also facing Opportunity Gaps and Award Gaps locally, labeled below as “OG” and “AG”
respectively.
Top Target Occupations in Health Science Technology, MSP 2021Q1
2021Q1 Mean Ann High- High-
SOC Occupation Empl Wages2 Wage High-Skill Demand OG AG
29-1141 Registered Nurses 36,626 $87,100 HW HS HD OG AG
Medical and Health
11-9111 4,831 $120,500 HW HS HD OG AG
Services Managers
29-1171 Nurse Practitioners 2,282 $121,000 HW HS HD OG AG
Medical Scientists, Except
19-1042 1,732 $99,500 HW HS HD OG AG
Epidemiologists
Speech-Language
29-1127 1,543 $78,700 HW HS HD OG AG
Pathologists
29-1071 Physician Assistants 1,353 $123,900 HW HS HD OG AG
29-1126 Respiratory Therapists 1,236 $72,100 HW HS HD OG AG
29-1131 Veterinarians 999 $94,500 HW HS HD OG
29-2091 Orthotists and Prosthetists 160 $89,300 HW HS HD OG
29-1081 Podiatrists 88 $158,600 HW HS HD AG
Registered Nurses, as the number-one occupation of shortage in the Career Field, while also
being high-wage, high-skill, high-demand, and experiencing a local award gap, is analyzed
below in more detail for better understanding of occupation “gain and drain.” The chart below
illustrates the national profiles of current and past people in this occupation. The left column
shows job transitions from other occupations to Registered Nursing. The right column shows
job transitions from Registered Nursing to other occupations.30
Registered Nurse Talent Gain and Drain, MSP Metro 2021Q3 Candidate Profile Analysis
Candidate profile analysis from Emsi 2021Q3 national dataset.
Graduate Pipeline for Registered Nurses, MSP Metro 2021
2020 IPEDS Completions Data; Visualizations from Emsi 2021Q3 dataset.31
HUMAN SERVICES
Human Services is the Career Field forecast to grow the most over the next ten years. Over
the next three years, under a pessimistic baseline forecast, Human Services employment is
forecast to grow by 1.0% annually. In the most optimistic scenario feasible based on
employer demand, and given the existing talent shortage and talent pipelines in place,
employment growth of 2.9% annually in this field could be possible.
Baseline Worst-Case Scenario 3-Year Forecast for Human Services Careers, MSP Metro
2021Q1
Top Ten Human Services Occupations by Employment Volume in the MSP Metro, 2021Q1
Baseline
Historical 3- Forecast
Avg Mean Year Empl Annual Ann
6-Digit Occupation Empl Wages LQ Change Demand Growth
Personal Care Aides 41,945 $30,000 1.44 8,494 7,637 2.9%
Teaching Assistants, Except Postsecondary 17,660 $35,300 1.26 -1,342 2,013 0.7%
Elementary School Teachers, Except Special Education 12,447 $67,100 0.84 -596 1,025 0.7%
Childcare Workers 9,973 $30,200 1.03 -1,235 1,535 0.3%
Lawyers 9,864 $137,000 1.08 -82 508 0.4%
Secondary School Teachers, Except Special and
9,721 $67,800 0.90 -402 764 0.7%
Career/Technical Education
Security Guards 8,345 $39,400 0.70 -1,260 1,085 0.1%
Social and Human Service Assistants 6,865 $38,500 1.46 -465 994 1.8%
Preschool Teachers, Except Special Education 6,235 $40,800 1.28 -1,016 664 0.4%
Hairdressers, Hairstylists, and Cosmetologists 5,993 $34,600 0.92 -1,450 700 -0.5%
Remaining Component Occupations 150,281 $64,200 0.96 -9,901 16,455 0.7%
Human Services (CTE Field) 279,332 $56,300 1.02 -9,250 33,382 1.0%
“Annual Demand” is the projected need for new entrants into an occupation. New entrants are needed due to expected growth and to
replace workers who left the occupation due to factors such as retirement or switching careers.
“Forecast Ann Growth” is the expected baseline (most pessimistic) yearly change in employment due to national, long-term trend
projections (per the BLS) as well as local factors such as industry mix, labor force participation rates, and population growth (as computed
and modeled by RealTime Talent in JobsEQ).
Most talent in the MSP Metro that is working in Human Services roles are employed by Elementary
and Secondary Schools (21.5%) or Individual and Family Services (12.2%). These two industries
account for the majority of talent demand over the next ten years.32
Human Services Field Employment by Industry, 2021Q1, MSP Metro
% of Career Career Field 10-Year 10-Year Empl 10-Year Total
Industry Title Field Empl Empl Separations Growth Demand
Elementary and Secondary Schools 21.5% 59,920 54,775 4,033 58,808
Individual and Family Services 12.2% 34,057 51,275 14,234 65,509
Colleges, Universities, and Professional Schools 6.1% 17,056 15,418 766 16,184
Executive, Legislative, and Other General
5.1% 14,378 12,743 505 13,248
Government Support
Legal Services 4.2% 11,823 8,801 -197 8,605
Child Day Care Services 4.1% 11,404 13,888 -14 13,875
Religious Organizations 3.7% 10,417 12,176 617 12,793
Residential Intellectual and Developmental Disability,
3.4% 9,593 12,994 1,534 14,528
Mental Health, and Substance Abuse Facilities
Personal Care Services 3.3% 9,351 11,475 458 11,933
Home Health Care Services 3.1% 8,760 13,463 2,609 16,072
Justice, Public Order, and Safety Activities 2.7% 7,534 6,581 38 6,619
Other Schools and Instruction 2.5% 7,012 9,001 1,117 10,118
Investigation and Security Services 1.9% 5,428 6,942 100 7,042
Administration of Human Resource Programs 1.7% 4,702 4,065 -151 3,914
Management of Companies and Enterprises 1.5% 4,178 3,966 315 4,281
Offices of Other Health Practitioners 1.5% 4,097 4,332 862 5,194
Other Amusement and Recreation Industries 1.4% 3,784 6,436 571 7,007
General Medical and Surgical Hospitals 1.2% 3,278 3,297 48 3,344
Continuing Care Retirement Communities and
1.2% 3,230 4,986 1,021 6,007
Assisted Living Facilities for the Elderly
Other Residential Care Facilities 1.1% 3,197 3,856 -97 3,758
All Others 16.5% 46,135 49,503 2,159 51,662You can also read