Capturing transient plasma flows and jets in the solar corona
←
→
Page content transcription
If your browser does not render page correctly, please read the page content below
Astronomy & Astrophysics manuscript no. AA_2021_41683                                                                                  ©ESO 2021
                                              October 6, 2021

                                                                                                           Letter to the Editor

                                                    Capturing transient plasma flows and jets in the solar corona
                                              L. P. Chitta1 , S. K. Solanki1, 2 , H. Peter1 , R. Aznar Cuadrado1 , L. Teriaca1 , U. Schühle1 , F. Auchère3 , D. Berghmans4 ,
                                                                                        E. Kraaikamp4 , S. Gissot4 and C. Verbeeck4

                                                    1
                                                        Max-Planck-Institut für Sonnensystemforschung, Justus-von-Liebig-Weg 3, 37077 Göttingen, Germany
                                                        e-mail: chitta@mps.mpg.de
                                                    2
                                                        School of Space Research, Kyung Hee University, Yongin, Gyeonggi 446-701, Republic of Korea
                                                    3
                                                        Institut d’Astrophysique Spatiale, CNRS, Univ. Paris-Sud, Université Paris-Saclay, Bât. 121, 91405 Orsay, France
                                                    4
                                                        Royal Observatory of Belgium, Ringlaan -3- Av. Circulaire, 1180 Brussels, Belgium
arXiv:2109.15106v2 [astro-ph.SR] 5 Oct 2021

                                                    Received ; accepted

                                                                                                                  ABSTRACT

                                                    Intensity bursts in ultraviolet (UV) to X-ray wavelengths and plasma jets are typical signatures of magnetic reconnection and the
                                                    associated impulsive heating of the solar atmospheric plasma. To gain new insights into the process, high-cadence observations are
                                                    required to capture the rapid response of plasma to magnetic reconnection as well as the highly dynamic evolution of jets. Here,
                                                    we report the first 2 s cadence extreme-UV observations recorded by the 174 Å High Resolution Imager of the Extreme Ultraviolet
                                                    Imager on board the Solar Orbiter mission. These observations, covering a quiet-Sun coronal region, reveal the onset signatures of
                                                    magnetic reconnection as localized heating events. These localized sources then exhibit repeated plasma eruptions or jet activity. Our
                                                    observations show that this spatial morphological change from localized sources to jet activity could occur rapidly on timescales of
                                                    about 20 s. The jets themselves are intermittent and are produced from the source region on timescales of about 20 s. In the initial
                                                    phases of these events, plasma jets are observed to exhibit speeds, as inferred from propagating intensity disturbances, in the range of
                                                    100 km s−1 to 150 km s−1 . These jets then propagate to lengths of about 5 Mm. We discuss examples of bidirectional and unidirectional
                                                    jet activity observed to have been initiated from the initially localized bursts in the corona. The transient nature of coronal bursts and
                                                    the associated plasma flows or jets along with their dynamics could provide a benchmark for magnetic reconnection models of coronal
                                                    bursts and jets.
                                                    Key words. Sun: corona — Sun: magnetic fields — Magnetic reconnection — Plasmas

                                              1. Introduction                                                             and corona (Tian et al. 2014; Narang et al. 2016; Panesar et al.
                                                                                                                          2018, 2019). Evidence of magnetic reconnection is further sup-
                                              Magnetic reconnection is a universal process that is invoked to             ported by observations that these small-scale jets erupt when
                                              explain phenomena ranging from astrophysical jets to granular-              patches of small-scale opposite-polarity magnetic elements in
                                              scale explosive events on the Sun. In the solar atmosphere, sig-            the solar photosphere interact and undergo flux cancellation
                                              natures of magnetic reconnection are prevalent. In particular, ob-          (e.g. Chitta et al. 2017; Panesar et al. 2018, 2019). There is also
                                              servations of spectral line broadening and double-peaked spec-              some evidence for a direct association of explosive events iden-
                                              tral profiles support the idea of bidirectional jets during magnetic        tified in spectroscopic observations and plasma jets observed in
                                              reconnection at the site of megameter-scale explosive events in             imaging observations (Innes & Teriaca 2013; Chen et al. 2019;
                                              the transition region at the base of the quiet-Sun corona (Dere             Chitta et al. 2021).
                                              1994; Innes et al. 1997; Chae et al. 1998), as well as ultravio-
                                                                                                                               The dot-like, loop-like, and surge- or jet-like EUV bright-
                                              let (UV) bursts in active regions (Peter et al. 2014; Young et al.
                                                                                                                          enings in active regions, observed during the second flight of
                                              2018). High-cadence (1.4 s to 5 s) spectroscopic observations of
                                                                                                                          Hi-C, have provided new insights into the spatial evolution
                                              such bursts show that the observed intensity and broadening of
                                                                                                                          of plasma response to magnetic reconnection by revealing bi-
                                              spectral lines fluctuate on timescales as short as 10 s, suggesting
                                                                                                                          and uni-directional plasma flows at small spatial scales of 2′′ –
                                              that the plasma responds very dynamically to magnetic recon-
                                                                                                                          5′′ (Tiwari et al. 2019). However, the rapid response of high tem-
                                              nection (e.g., Gupta & Tripathi 2015; Chitta & Lazarian 2020;
                                                                                                                          perature plasma (above 0.1 MK) to magnetic reconnection in
                                              Guo et al. 2020).
                                                                                                                          terms of the spatial evolution and internal dynamics of jets are
                                                  In chromospheric images that sample temperatures around                 not well known due to the lack of extreme ultraviolet (EUV)
                                              104 K, inverse Y-shaped anemone jets are observed in active                 coronal observations at cadences as high as 1 s to 2 s, which are
                                              regions. Such jets outline plasma eruptions on spatial scales               comparable to high-cadence spectroscopic observations of the
                                              of 150 km to 300 km, with speeds of 10 km s−1 to 20 km s−1                  transition region (e.g., at 1.4 s, Chitta & Lazarian 2020). We ex-
                                              (Shibata et al. 2007). Signatures of similar small-scale chromo-            pect such high-cadence coronal images to reveal the transience
                                              spheric jets are also observed at the footpoints of active re-              of plasma jets as a direct response to the ephemeral nature of
                                              gion coronal loops (Chitta et al. 2017). Small-scale plasma jets            magnetic reconnection. We also expect such imaging observa-
                                              at higher speeds on the order of 100 km s−1 are observed at                 tions to provide insights into the morphological evolution of jets.
                                              higher temperatures of ∼0.1 MK to 1 MK in the transition region             In this study, we report the first 2 s high cadence observations
                                                                                                                                                                       Article number, page 1 of 8
A&A proofs: manuscript no. AA_2021_41683
of Solar Orbiter. The Carrington longitude of Solar Orbiter was
about 152°, while that of Earth was about 292°. This means that
solar disk center seen from Solar Orbiter could not be seen from
Earth and thus no coordinated solar observations from Earth or-
bit or by ground based telescopes are available.
3. Signatures of dynamic magnetic reconnection in
the solar corona
The HRIEUV images revealed typical quiet-Sun coronal features
such as coronal bright points on scales of 10 Mm interspersed
with patches of diffuse EUV emission (Fig. 1). Coronal bright
points are widely studied features in the literature (Golub et al.
1974; Madjarska 2019). The data also revealed a number of tran-
sient roundish and loop-like elongated brightenings (EUV bursts
or campfires; e.g., Chitta et al. 2021; Berghmans et al. 2021)
that are distributed throughout the field of view (not marked in
Fig. 1). Numerical simulations show that such transient bright-
enings in the corona can be triggered by magnetic (component)
reconnection (Chen et al. 2021). There is also observational ev-
idence to support magnetic reconnection as the driver of these
transient coronal events based on the detection of double-peaked
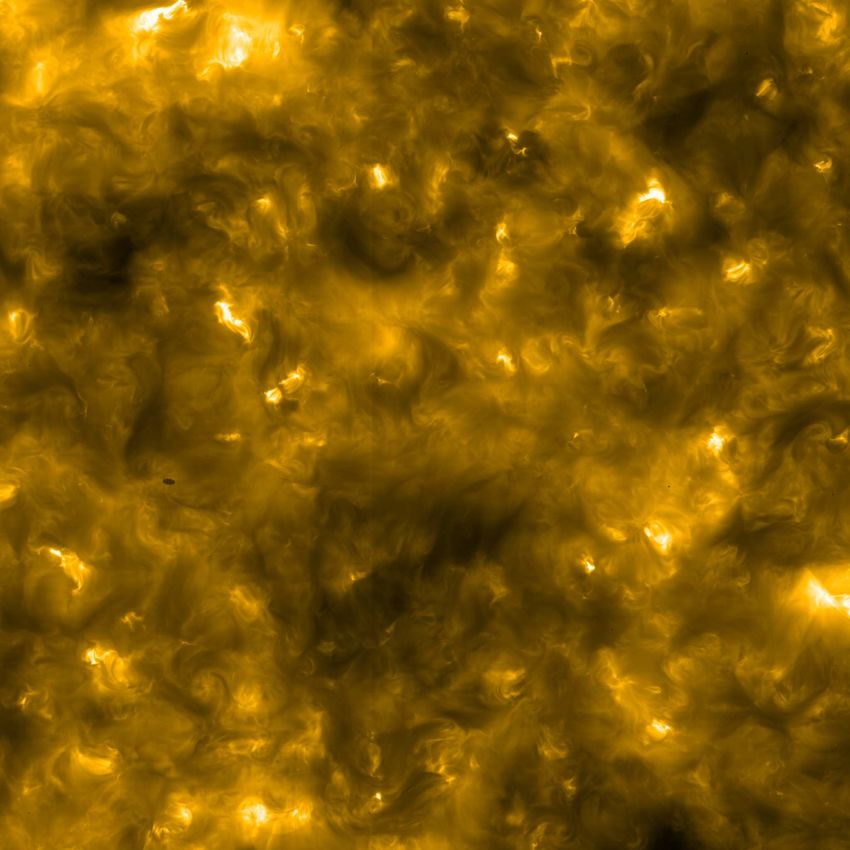
Fig. 1. Quiet-Sun corona observed with HRIEUV on 2021 February 23. spectral lines (indicative of bidirectional jets from the site of re-
The map is obtained by averaging emission from all the frames in the connection) emitted by those structures at transition region tem-
level-2 image sequence. The field of view is about 384 Mm × 384 Mm. peratures of around 0.1 MK (c.f. Sect. 1; see also Chitta et al.
Three boxes labelled A–C mark quiescent regions that exhibited jet ac- 2021).
tivities further discussed in Figures 2–5. Each box covers a field of view These transient events exhibit rapid (internal) dynamics that
of roughly 19 Mm × 19 Mm. can be seen as intensity disturbances along the brightenings in
the data analyzed here. We focus on four examples of elongated
brightenings detected in the 2 s high-cadence EUI data in this
of plasma flows or jets using data obtained by the Extreme Ul- study. These appear to be collimated plasma flows, which we re-
traviolet Imager (EUI; Rochus et al. 2020) on board the Solar fer to as jets in the rest of the paper. The location of these events
Orbiter mission (Müller et al. 2020) during its cruise phase on is marked in Fig. 1 (boxes A–C). The examples were selected
2021 February 23. The reported plasma flow events are not clas- based on their clear visibility, which allows us to track their evo-
sical or traditional coronal jets as described in the literature (e.g., lution with minimal confusion coming from the rather diffuse
Shibata et al. 1994; Shen 2021, c.f. Sect. 4). and weak local fore- and background coronal emission.
2. Observations 3.1. Bidirectional jet
We employ a high-cadence image sequence recorded by the Here, we analyze a bidirectional jet event that is a typical signa-
17.4 nm EUV High Resolution Imager (HRIEUV ) of the Extreme ture of magnetic reconnection. In Fig. 2a-d, we show the spatial
Ultraviolet Imager (EUI; Rochus et al. 2020) on board the So- morphological evolution of a jet event. The general structure of
lar Orbiter mission (Müller et al. 2020), which is currently in this jet is discernible also at the center of box-A overlaid on the
its cruise phase. EUI/HRIEUV records the EUV emission on the mean emission map in Fig. 1. The event started as a weak, spa-
central 2048 × 2048 pixel area of its CMOS sensor with an tially localized burst, seen as a compact bright source (indicated
image scale of 0.492′′ pixel−1 . The observations used in this by an arrow in Fig. 2a). The intensity of this compact source in-
study were obtained on 2021 February 23 between UT 17:13:25 creased over a period of 20 s (from UT 17:17:00 to UT 17:17:20;
and UT 17:20:59 (i.e., total duration of 454 s).1 At the time see white-colored light curve of the compact source in panel-e).
of observations, the sun-bound Solar Orbiter was at a distance After this phase of localized brightening, the event rapidly de-
of 0.526 astronomical units and hence, the linear image scale veloped into an elongated structure (panels c-d). On one side of
of EUI/HRIEUV was about 188 km pixel−1 . These observations this elongation, the flows appears to exhibit complexity and then
were recorded at 2 s cadence and we used level-2 calibrated data. bifurcate further into multiple segments, diverging away from a
Using a cross-correlation technique, we removed the remaining Y-type junction (green arrow in panel d). This could reflect the
jitter in the image sequence. internal magnetic complexity associated with this event. While
EUI/HRIEUV samples emission from roughly 1 MK plasma the jet was visible, the compact source region exhibited further
due to Fe ix (at 17.11 nm) and Fe x (at 17.45 nm and 17.72 nm). intensity fluctuations on timescales of 10 s to 20 s, pointing to
In Figure 1, we display the mean emission map (obtained by av- intermittency in the magnetic reconnection. Away from the com-
eraging all the frames in the image sequence) covering the full pact source, the jets are observed to exhibit intensity fluctuations
field of view of HRIEUV . The region covers the quiet-Sun corona on similar timescales (see cyan coloured light curve of the com-
that is close to the disk center as observed from the vantage point pact source in panel-e). The propagating nature of disturbances
is apparent from the time-lag between the initial intensity rise
1
https://doi.org/10.24414/z2hf-b008 exhibited by the compact source and that displayed by the jet.
Article number, page 2 of 8L. P. Chitta et al.: Capturing transient plasma flows and jets in the solar corona
Fig. 2. Bidirectional jets. These transient jets are observed in the region outlined by box-A in Fig. 1. Panels (a)-(d), covering an area of roughly
19 Mm×19 Mm, display snapshots at four instances during the jet evolution. The white arrow points to the initial brightening and its location
observed prior to the jet. In panel (d), the green arrow points to a location where the jet is further bifurcated. The space-time stack plot in panel
(e) shows the evolution of the brightness along the strip marked in panel (c; emission averaged across dotted vertical lines, i.e. the strip). The
overlaid light curve in white is from the location of the initial brightening (emission averaged over the white box in panel b). Similarly, the cyan
coloured light curve represents average emission covering a region over the jet (cyan box in panel b). The vertical dotted lines mark the time-stamps
associated with images in panels (a)-(d). In panel (f) we show a smooth-subtracted image of panel (e). Fiducial (solid) lines are plotted to guide
the eye. Their slopes, in units of speed (km s−1 ), are also quoted. An online animation of the snapshots is available.
The episodic nature of jet activity and its relation to the ini- 3.2. Unidirectional jets
tial compact source are demonstrated using the space-time stack
plot shown in Fig. 2e, derived by plotting the intensities along a In the following, we analyze intermittent unidirectional jets ob-
strip placed along the structure. In particular, intermittent jets are served by HRIEUV . In Fig. 3a-d, we present the morphological
observed to originate on either side of the initial compact source evolution of another event that exhibits characteristics that are
(located between distances of 4 Mm and 6 Mm from the start of similar to the example in Fig. 2 (see also box-B in Fig. 1). The
the selected strip). These disturbances apparently propagate over event in Fig. 3 also starts as a compact bright source (see arrow
distances (i.e., lengths of the jets) of 2 Mm to 4 Mm. The inter- in Fig. 3a). But compared to the example in Fig. 2, which is more
mittency of jets is further established using smooth-subtracted isolated, the event in Fig. 3 originates in a region of enhanced ac-
image of the space-time stack plot (panel-f).2 tivity (see bright regions adjacent to the source marked by an ar-
row in Fig. 3a). The source exhibits a rapid intensity increase for
Initially, these jets exhibit speeds on the order of 100 km s−1 . a period of roughly 20 s (between UT 17:17:20 to UT 17:17:40;
Each episode lasts for about 20 s, the timescale that is also ob- see light curve in panel-e). After this phase, repeated plasma
served in the intensity fluctuations of the light curve of the cen- eruptions are observed to originate from the source (see panels
tral bright source (panel-e). Assuming that the intensity distur- c, e-f). The propagation speeds of intensity disturbances of about
bances are plasma motions, the jet speeds are comparable to the 150 km s−1 are comparable to the local sound speed. This event
local sound speed of about 150 km s−1 in a million Kelvin hot also lasts for about 200 s.
plasma in the corona. The event in its entirety lasted for about
200 s. While the intensity disturbances propagate to relatively sim-
ilar distances on either side of the central source in Fig. 2f, the
detected jets in Fig. 3f are predominantly in one direction. On
one side from the source (located about a distance of 2 Mm from
2
the zero position of the strip), jets have a projected length of
To enhance the fluctuations on timescales of 20 s observed in the light nearly 6 Mm. Opposite in direction to these longer jets (shown
curves in panel (e), we first smoothened the space-time stack plot in the in Fig. 3f), there are indications of repeated, but shorter prop-
time domain using a smoothing window of 10 time steps (corresponding
to a duration of 20 s). The smoothened image is then subtracted from the
agating perturbations with projected lengths of only 1 Mm. If
original space-time map. The features remain clearly discernible over these shorter-scale perturbations are also associated with small-
a range of smoothing windows from 5 to 25 time steps. No smooth- scale jet activity, then the difference in the projected lengths of
subtraction is done in the spatial direction. This is the case also for the plasma flow in opposite directions can be understood in terms
smooth-subtracted images in Figs. 3, 4, and 5. The intermittent nature of jets propagating in closed magnetic loops, where the source
of jets is evident in the associated online animations. region is situated closer to one of their footpoints. However, we
Article number, page 3 of 8A&A proofs: manuscript no. AA_2021_41683
Fig. 3. Unidirectional jets. Same details as in Fig. 2, but plotted for transient jets observed in the region outlined by box-B in Fig. 1. The green
arrow in panel (c) points to a previously existing feature adjacent to the observed jet. An online animation of the snapshots is available.
Fig. 4. Unidirectional jets. Same details as in Fig. 3, but plotted for a second event observed in the region outlined by box-B in Fig. 1. For reference,
the white box in Fig. 3b (i.e. the source or footpoint) is overlaid as a blue box in panel-b). An online animation of the snapshots is available.
cannot rule out other plausible explanations, such as magneto- localized brightening (see Fig. 4a-d and box-B in Fig. 1) that
hydrodynamic waves at the footpoints of the longer jet driving led to plasma eruptions. This burst episode exhibits brighten-
these intensity perturbations on shorter length-scales of 1 Mm. ing between UT 17:19:40 and UT 17:20:00, (see Fig. 4e), af-
Adjacent to the jet activity discussed in Fig. 3, we observed ter which point a jet is ejected at speeds of about 150 km s−1 .
a pre-existing loop-like plasma feature (green arrow in Fig. 3c) Unlike jets seen in previous examples, that did not show sig-
with one of its apparent footpoints situated closer to the source natures of speed changes as they propagate, this unidirectional
region marked in Fig. 3b. This loop-like structure gradually fades jet exhibits some deceleration after UT 17:20:20. This jet also
away by UT 17:19:20. Its footpoint region exhibited another propagates to distances of about 6 Mm from the initial bright
Article number, page 4 of 8L. P. Chitta et al.: Capturing transient plasma flows and jets in the solar corona
Fig. 5. Unidirectional jets. Same details as in Fig. 2, but plotted for an event observed in the region outlined by box-C in Fig. 1. An online animation
of the snapshots is available.
source. There are signatures of subsequent jet activity from this 2019). The speeds, however, are generally on the lower end of
location seen as intensity ridges in the space-time stack plots transition region network jets (seen as fast propagating inten-
(between UT 17:20:00 and UT 17:21:00; Fig. 4e-f). The whole sity disturbances) in coronal hole regions (Tian et al. 2014), but
event evolves over a period of about 80 s. The footpoint regions comparable to transition region jets observed in the quiet-Sun
of the events shown in Figs. 3 and 4 appear to be close to each (Narang et al. 2016).
other (see Fig. 4b). It is possible that the jet in Fig. 4 is causally The main difference, however, is that the jets observed in
linked to the eruption in Fig. 3, which is still ongoing when the these earlier studies appear to be collimated outflows from the
new jet starts. Sun along (locally) open magnetic fields. In contrast, both the
An example of a jet that is fainter than the other three is pre- bi- and unidirectional jet features we presented here are appar-
sented in Fig. 5 (box-C in Fig. 1). The bright source becomes ent flows confined to closed magnetic loops in the quiet-Sun (e.g.
clearly distinguishable starting around UT 17:18:20 and a jet is Teriaca et al. 2004; Huang et al. 2015). Our quiet-Sun events
ejected from this region around UT 17:18:40, which then propa- could be similar to the previously reported active region bi- and
gates at speeds of about 150 km s−1 (Fig. 5e-f, with at least two unidirectional surges and jet-like features (Tiwari et al. 2019).
additional episodes between UT 17:19:20 and UT 17:20:00). Al- Another related difference is the general appearance or
though the morphology of the jet is quite simple, its source re- spatial morphology of jets itself. Typical coronal jets con-
gion footpoint exhibits a dynamic evolution. The duration of this sist of a bright base along-with a spire that extends outward
event is about 100 s. from the bright jet-base into the corona (Shibata et al. 1994;
Alexander & Fletcher 1999). However, the collimated flows we
investigated here do not show these typical characteristics of
4. Discussion and conclusions classical coronal jets. Why the studied jets differ in terms of spa-
In the initial phases, the observed transient jets propagate with tial morphology in comparison with the classical coronal jets re-
speeds in the range of 100 km s−1 to 150 km s−1 . Using 5 s ca- mains to be answered.
dence EUI data from the 2020-May campaign, Mandal et al. A clear imaging of bi-directional plasma jets in the
(Submitted) investigated the internal dynamics of EUV bright- corona was previously reported by Jiang et al. (2013) using
enings (termed campfires, c.f. Berghmans et al. 2021) and found EUV data from the Atmospheric Imaging Assembly (AIA;
signatures of propagating disturbances with speeds in the range Lemen et al. 2012) on board the Solar Dynamics Observatory
of 25 km s−1 and 60 km s−1 . This is a factor of two to six smaller (SDO; Pesnell et al. 2012). However, the transient and repeti-
than the speeds of jets investigated here. In this regard, the study tive nature of quiet-Sun jets on shorter timescales of 20 s that
of Mandal et al. (Submitted) complements our work in high- we present in all examples here had not been observed before.
lighting a variety of plasma dynamics in coronal structures that This is because (as discussed in Appendix A) such short-lived
could be revealed, thanks to higher cadence EUI data. transients could not be observed with routine SDO/AIA EUV
The jet speeds reported in our study are on the higher observations.
end of the distribution of speeds exhibited by type-II spicules Fast-propagating disturbances in the upper chromosphere
(Pereira et al. 2012) and jetlet-like features from magnetic net- and transition region were also detected along bright elon-
work lanes observed adjacent to an active region (Panesar et al. gated structures using Lyman-α slit-jaw images recorded by the
Article number, page 5 of 8A&A proofs: manuscript no. AA_2021_41683
CLASP sounding rocket experiment (Kubo et al. 2016). These Acknowledgements. We thank the anonymous referee for helpful comments on
CLASP Lyman-α propagating disturbances might be transi- the manuscript. The authors thank Koen Stegen (Royal Observatory of Belgium)
for his crucial role in EUI operations. L.P.C. thanks Sudip Mandal (MPS) for
tion region counterparts to events similar to those studied here. helpful discussions. This project has received funding from the European Re-
Whether or not they are visible also in the EUI/HRI Lyman-α search Council (ERC) under the European Union’s Horizon 2020 research and
Imager requires further investigation with new observations. innovation programme (grant agreement No 695075). Solar Orbiter is a mis-
Furthermore, a common feature we observed among all four sion of international cooperation between ESA and NASA, operated by ESA.
jets is that they erupt from an initial compact bright source. The The EUI instrument was built by CSL, IAS, MPS, MSSL/UCL, PMOD/WRC,
ROB, LCF/IO with funding from the Belgian Federal Science Policy Office
intensity of the source increases for about 20 s. The jet ma- (BELSPO/PRODEX PEA 4000112292); the Centre National d’Etudes Spatiales
terial is then observed as repetitive eruptions from this local (CNES); the UK Space Agency (UKSA); the Bundesministerium für Wirtschaft
bright source. The short timescales associated with these jets re- und Energie (BMWi) through the Deutsches Zentrum für Luft- und Raumfahrt
semble fluctuations observed in the nonthermal broadening of (DLR); and the Swiss Space Office (SSO).
transition region spectral lines (formed at around 0.1 MK) from
reconnection-driven microflares that are likely produced by in-
ternal turbulent motions (Chitta & Lazarian 2020). References
In three of the four jet events we investigated (i.e., Figs. 2,
3, and 5), there is no clear signature of acceleration or deceler- Alexander, D. & Fletcher, L. 1999, Sol. Phys., 190, 167
Berghmans, D., Auchère, F., Long, D. M., et al. 2021, arXiv e-prints,
ation of ejected material. Nevertheless, the jets fade away af- arXiv:2104.03382
ter traversing distances of a few Mm from the source region Chae, J., Wang, H., Lee, C.-Y., Goode, P. R., & Schühle, U. 1998, ApJ, 497,
with almost uniform speeds. One possible explanation is that L109
the jets are further heated or cooled down such that the result- Chen, Y., Przybylski, D., Peter, H., et al. 2021, arXiv e-prints, arXiv:2104.10940
Chen, Y., Tian, H., Huang, Z., Peter, H., & Samanta, T. 2019, ApJ, 873, 79
ing emission is not captured by the HRIEUV 174 Å filter. In one Chitta, L. P. & Lazarian, A. 2020, ApJ, 890, L2
case (Fig. 4), however, the initial jet is observed to slow down. Chitta, L. P., Peter, H., Solanki, S. K., et al. 2017, ApJS, 229, 4
Whether this deceleration reflects the true kinematics of the jet Chitta, L. P., Peter, H., & Young, P. R. 2021, A&A, 647, A159
plasma or whether it is an apparent effect (i.e., produced by the Dere, K. P. 1994, Advances in Space Research, 14, 13
Golub, L., Krieger, A. S., Silk, J. K., Timothy, A. F., & Vaiana, G. S. 1974, ApJ,
loop geometry that curves perpendicular to the plane of sky, as 189, L93
in a downward curved loop) requires further investigation with Guo, L. J., De Pontieu, B., Huang, Y. M., Peter, H., & Bhattacharjee, A. 2020,
more such events, coupled with magnetic field extrapolations. ApJ, 901, 148
Because these jets are characterized by their intensity en- Gupta, G. R. & Tripathi, D. 2015, ApJ, 809, 82
Huang, Z., Xia, L., Li, B., & Madjarska, M. S. 2015, ApJ, 810, 46
hancement with respect to the local background, it is either the Innes, D. E., Inhester, B., Axford, W. I., & Wilhelm, K. 1997, Nature, 386, 811
segments of these jets or the whole structures themselves that Innes, D. E. & Teriaca, L. 2013, Sol. Phys., 282, 453
could be classified as quiet-Sun EUV bursts (Chitta et al. 2021) Jiang, Y., Bi, Y., Yang, J., et al. 2013, ApJ, 775, 132
or campfires (Berghmans et al. 2021), which are likely akin to Kubo, M., Katsukawa, Y., Suematsu, Y., et al. 2016, ApJ, 832, 141
small-scale bursts detected in active regions (Tiwari et al. 2019). Lemen, J. R., Title, A. M., Akin, D. J., et al. 2012, Sol. Phys., 275, 17
Madjarska, M. S. 2019, Living Reviews in Solar Physics, 16, 2
Our spatio-temporal analysis provides further insights into the Mandal, S., Peter, H., Chitta, L. P., et al. Submitted, A&A
dynamics and transient nature of these small-scale events. Müller, D., St. Cyr, O. C., Zouganelis, I., et al. 2020, A&A, 642, A1
Magnetic reconnection models of solar bursts predict that the Narang, N., Arbacher, R. T., Tian, H., et al. 2016, Sol. Phys., 291, 1129
current sheets break into copious magnetic islands or plasmoids Panesar, N. K., Sterling, A. C., Moore, R. L., et al. 2018, ApJ, 868, L27
Panesar, N. K., Sterling, A. C., Moore, R. L., et al. 2019, ApJ, 887, L8
that are then ejected outward. These plasmoids then hit the am- Pereira, T. M. D., De Pontieu, B., & Carlsson, M. 2012, ApJ, 759, 18
bient medium and thermalize to produce repeated bursts of ob- Pesnell, W. D., Thompson, B. J., & Chamberlin, P. C. 2012, Sol. Phys., 275, 3
servable plasma emission (Peter et al. 2019; Guo et al. 2020). It Peter, H., Huang, Y. M., Chitta, L. P., & Young, P. R. 2019, A&A, 628, A8
is possible that the jets we observed are related to the dynamics Peter, H., Tian, H., Curdt, W., et al. 2014, Science, 346, 1255726
of such plasmoids along reconnection current sheets in coronal Rochus, P., Auchère, F., Berghmans, D., et al. 2020, A&A, 642, A8
Shen, Y. 2021, Proceedings of the Royal Society of London Series A, 477, 217
bursts. The observed speeds of jets, their transient nature (short Shibata, K., Nakamura, T., Matsumoto, T., et al. 2007, Science, 318, 1591
lifetimes) and their origination from initially localized bursts Shibata, K., Nitta, N., Strong, K. T., et al. 1994, ApJ, 431, L51
could be used to test magnetic reconnection models of coronal Solanki, S. K., del Toro Iniesta, J. C., Woch, J., et al. 2020, A&A, 642, A11
bursts and jets. Teriaca, L., Banerjee, D., Falchi, A., Doyle, J. G., & Madjarska, M. S. 2004,
A&A, 427, 1065
The data we used here are among the highest cadence EUV Tian, H., DeLuca, E. E., Cranmer, S. R., et al. 2014, Science, 346, 1255711
imaging observations of the solar corona ever recorded. These Tiwari, S. K., Panesar, N. K., Moore, R. L., et al. 2019, ApJ, 887, 56
novel 2 s cadence data revealed the repetitive and transient na- Young, P. R., Tian, H., Peter, H., et al. 2018, Space Sci. Rev., 214, 120
ture of coronal jets on timescales of about 20 s. There are hints
of similar plasma flows (with repetition) also in coronal bright
points distributed throughout the field of view. However, most
of these regions appear over-exposed in this experimental ob-
servational set, limiting the extraction of local flow properties.
Similar high-cadence EUV observations (with better exposure
settings to capture bright regions) during the perihelion of So-
lar Orbiter (around 0.3 AU) with roughly two times better spatial
resolution than the data used here will further reveal and estab-
lish the details of the internal dynamics and the transient nature
of these jets and their relation to plasmoids. Combining such
observations with photospheric magnetic field information at a
similar spatial resolution that is expected from the Polarimetric
and Helioseismic Imager on Solar Orbiter (Solanki et al. 2020)
will shed light on the magnetic drivers of these transient jets.
Article number, page 6 of 8L. P. Chitta et al.: Capturing transient plasma flows and jets in the solar corona
Appendix A: SDO/AIA type observations of jets
The four cases we discussed in the main text have jet propa-
gation lengths of about 5 Mm and total event duration exceed-
ing 60 s. These characteristics should imply that they (or sim-
ilar events) are observable with the Atmospheric Imaging As-
sembly (AIA; Lemen et al. 2012) on board the Solar Dynamics
Observatory (SDO; Pesnell et al. 2012). The EUV channels of
SDO/AIA record images every 12 s and have a spatial resolution
of about 1.2′′ . Therefore, it may be asked why such events were
not reported based on AIA observations. At the time the obser-
vations were recorded, Solar Orbiter was close to the far-side
of the Sun (c.f. Sect. 2), and therefore no direct SDO observa-
tions were available. Therefore, to answer the question, we used
the EUI data of the observed jets themselves and retrieved their
space-time stack plots for parameters typical of observations by
SDO/AIA channels, which record image sequences of the solar
corona at a six times lower cadence and a roughly two times
lower spatial resolution compared to the HRIEUV images pre-
sented in our study. To simulate the six times lower cadence of
AIA, we simply picked every sixth EUI snapshot. The next step
is to spatially degrade the EUI data to closely match the spatial
resolution of AIA. To this end, we extracted the central 9 ×9 pix-
els patch covering the core of the point spread function (PSF) of
the AIA 171 Å filter. This patch was then rescaled and the result-
ing 2D profile was normalized such that the target PSF or kernel
has an image scale similar to that of EUI and area under the PSF
equals unity (to preserve flux). We first convolved the EUI im-
ages with the newly created kernel and then rebinned the data
such that the image scale is 0.6′′ , matching the AIA plate scale.
Using these degraded data, we constructed the space-time maps
of the jet features. The results are displayed in Fig. A.1. This ex-
periment reveals that while a general intensity propagation along
the structures is observed by SDO/AIA, it would miss most of
the temporal substructure and to a large extent the rapid evolu-
tion of jets we observed with HRIEUV . For instance, the clear
transient bidirectional jet features that we discussed in Fig. 2 are
not apparent in Fig. A.1a. Moreover, the repetition of transient
jet activity (on timescales of 20 s) that we observed in all four
cases is also clearly missing in the SDO/AIA type observations,
which means missing signatures of dynamic magnetic reconnec-
tion. Thus, our study emphasizes the necessity of high-cadence,
high-resolution observations to capture the highly dynamic sig-
natures of magnetic reconnection in the solar corona.
Article number, page 7 of 8A&A proofs: manuscript no. AA_2021_41683 Fig. A.1. Jet features as SDO/AIA would observe them. Panels (a) through (d) show space-time stack plots of jet features that correspond to panel (e) in Fig. 2 through Fig. 5, as if those jets were observed by EUV filters on SDO/AIA that sample plasma emission from similar temperatures as HRIEUV would (e.g., AIA 17.1 nm or 19.3 nm filters; but with six times lower cadence at roughly a factor of two lower spatial resolution). Article number, page 8 of 8
You can also read