CANADIAN LODGING OVERVIEW - January 2022 - A Cushman & Wakefield Canadian Hospitality Publication - Cushman & Wakefield
←
→
Page content transcription
If your browser does not render page correctly, please read the page content below
CANADIAN
LODGING OVERVIEW

A Cushman & Wakefield
Canadian Hospitality Publication

January 2022

TABLE OF CONTENTS

                                          4               MARKET PERFORMANCE
                                                          INDICATORS
                                                                                                                            INTRODUCTION

                                          6
                                                                                                                        The year 2021 was notable for renewed optimism
                                                                                                                     and a gradual return to normalcy for many. While
                                                          TOP 10 MARKETS                                           COVID-19 can be expected to continue impacting
                                                                                                                  our lives and the Canadian accommodation market,

                                          8
                                                                                                                the past year evidenced how quickly demand and the
                                                                                                               economy can begin to rebound.
                                                          NEW SUPPLY
                                                                                                            In our 2021 Outlook, we had anticipated the beginnings of

                                         10
                                                                                                          a recovery once vaccines had been distributed. This came
                                                                                                        to fruition in Q3, October, and November of 2021, with strong
                                                          NOTABLE TRANSACTIONS                         growth in demand and the beginnings of ADR recovery.

                                         14
                                                                                                    As the economy reopened and restrictions were loosened, many
                                                                                                  markets saw travel gradually return to near normal levels, fuelled
                                                                                                 by strong leisure travel, and pent up demand from groups and events
                                                          RECOVERY UPDATE                      that saw many delays and postponements in 2020 and early 2021.
                                                                                             Some markets saw signs of corporate travel returning in late 2021, while

                                         17
                                                                                            markets that rely on international travel and large-scale events, such as
                                                                                          airports and major city centres, continued to lag the overall market.
                                                          LABOUR CHALLENGES
                                                                                       This annual Outlook will recap the results for this past year, the timeline of the

                                         18
                                                                                     recovery, and emerging trends.
                                                          CONCLUSION &             Despite the near-term impact of Omicron, we still expect a continuation of the
                                                          OUTLOOK                recovery that started in 2021 and some meaningful gains in 2022.

                                           Cover photo:
                               Fairmont Chateau Laurier
                                        Ottawa, Ontario

2   C AN AD I A N LO D G I N G OVERVIE W / JANUARY 2022                                                                                                          CUS H MAN & WAK E F IE LD   3
MARKET PERFORMANCE INDICATORS YEAR IN REVIEW
The following chart illustrates key operating performance indicators of the Canadian hotel The following graph illustrates monthly trends in RevPAR through 2021 by market type. This graph shows the overall
industry from 2011 through Year-to-Date November 2021. magnitude of the declines in 2020 and early 2021, relative to the same period in 2019, as well as which property types
have performed better throughout the downturn and which have recovered more quickly.
CANADIAN HISTORICAL OPERATING STATISTICS:
2011-2020 and Year-to-Date November 2021 MONTHLY REVPAR % CHANGE SINCE PANDEMIC
APR- MAY- JUN- JUL- AUG- SEP- OCT- NOV- DEC- JAN- FEB- MAR- APR- MAY- 2021- JUL- AUG- SEP- OCT- NOV-
SUPPLY DEMAND 20 20 20 20 20 20 20 20 20 21 21 21 21 21 06-01 21 21 21 21 21
YEAR OCCUPANCY % CHANGE ADR % CHANGE REVPAR % CHANGE 10%
% CHANGE % CHANGE
2011 61.8% $127.85 $78.98 0%
2012 0.5 1.6 62.3% 0.8 $130.12 1.8 $81.08 2.7
-10%
2013 0.5 2.1 63.3% 1.6 $133.08 2.3 $84.21 3.9
-20%
2014 0.5 3.0 64.8% 2.4 $137.36 3.2 $89.06 5.8
2015 1.0 0.2 64.1% (1.1) $142.98 4.1 $91.71 3.0 -30%
2016 0.9 1.5 64.4% 0.5 $149.02 4.2 $95.95 4.6 -40%
2017 0.8 3.2 65.7% 2.0 $156.72 5.2 $102.95 7.3
-50%
2018 1.0 2.0 66.1% 0.7 $163.32 4.2 $108.00 4.9
-60%
2019 1.5 0.1 65.2% (1.3) $165.23 1.2 $107.81 (0.2)
2020 -3.7 (51.0) 33.1% (49.3) $130.43 (21.1) $43.11 (60.0) -70%
Average Annual % Change 0.9 % 1.9 % -6.7 % 0.2 % -6.5 %
-80%
YTD November 2020 34.0% $131.43 $44.71
-90%
YTD November 2021 2.7 % 26.3 % 41.7% 22.6 % $138.01 5.0 % $57.54 28.7 %
-100%
Source: STR | Republication or other re-use of this data without the express written permission of STR is strictly prohibited.
URBAN SUBURBAN AIRPORT HIGHWAY RESORT SMALL METRO/TOWN
Source: STR | March through November 2021 results are indexed to 2019.
Following a sharp RevPAR decline of 60% in 2020, the In Q3, the summer period provided a strong In 2020, the accommodation market saw a shift in These trends are expected to continue over the coming
hotel market saw better results in 2021. YTD November resurgence in demand as many travelers looked to how different types of markets perform – from major months as the accommodation markets grapple with
2021 data showed a significant increase in demand and take advantage of the summer months resulting in a city centres historically being the top performers the Omicron variant and restrictions are re-introduced,
a moderate increase in ADR across the country, resulting RevPAR increase of 15% over 2020. This optimism and to being those most impacted by the pandemic. including the GAA program. Once restrictions are
in RevPAR growing by 28.7% over 2020 results. return to normalcy persisted into the fall months and With the changes in the sources of demand, resorts, loosened and the threat from Omicron has subsided,
many hotels saw a gradual return of corporate travel smaller towns, and highway locations led the country demand patterns established in 2021 are expected to
The beginning of 2021 got off to a slow start as many and groups, as well as leisure travelers resulting in an in performance as these locales often offer steadier resume with smaller towns, resorts, and highway hotels
provinces in the country maintained their lockdowns and overall boost to YTD 2021 RevPAR results of 29% over sources of demand and are popular leisure travel showing the earliest and strongest growth, followed by
restrictions, with Q1 RevPAR down by 55% over 2020. the previous year. destinations. Airport hotels showed a noticeable surge suburban areas, airport markets, and urban areas.
Beginning in Q2, as vaccinations to the general public in performance in March 2021 as the government
ramped up, restrictions were gradually reduced, and implemented mandatory quarantine periods for
consumer confidence increased resulting in slow but travelers and many hotels opted into the Government-
steady improvement in accommodation performance. Authorized Accommodation (GAA) program.
4 C AN AD I A N LO D G I N G OVERVIE W / JANUARY 2022 CUS H MAN & WAK E F IE LD 5
STR TOP 10 MARKETS
In 2020, there was a reversal of many longstanding 42%, 41%, 40%, 34% and 33%, respectively. These
trends in the Canadian accommodation industry with markets generally saw the recovery start earlier, in
the major cities of Toronto, Vancouver, and Montreal left the May to June period, and saw very strong summer
struggling to fill rooms. As a result, international, group performance relative to the markets with lower growth.
and corporate demand fell, as travelers avoided densely In addition, these markets also took advantage of
populated cities. In 2021, this pattern has persisted with stronger demand periods to drive stronger ADR growth,
many leisure-oriented destinations and smaller cities resulting in strong overall RevPAR growth.
seeing a strong resurgence in demand.
The remaining major markets also saw strong
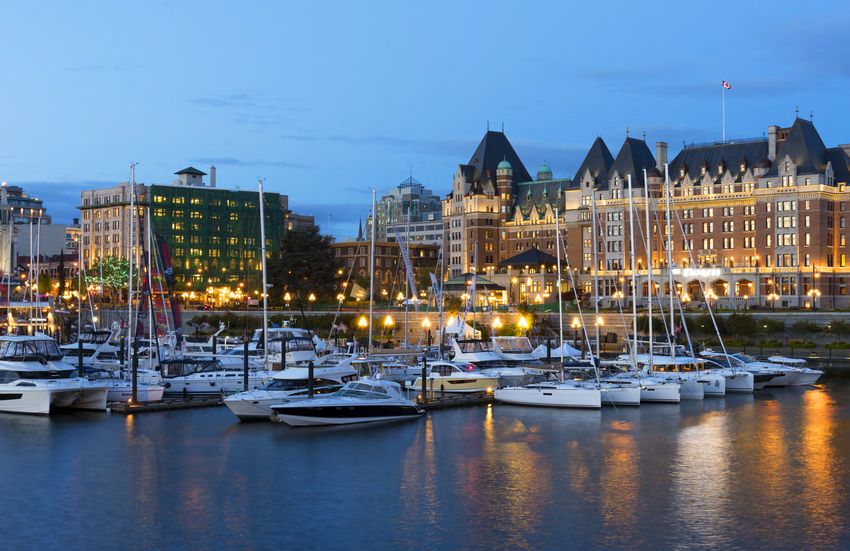
As of YTD November 2021, Vancouver and Victoria improvements in RevPAR, capturing growth in leisure
continued to lead the country in terms of overall demand over the summer and fall months. Ottawa
RevPAR, followed distantly by Toronto and Quebec recorded the lowest RevPAR growth for this year-
City. The cities that have seen the largest RevPAR to-date period; however, the city had posted a much
improvements this year have been Victoria, Vancouver, smaller decline in 2020 as a result of relatively steady
Halifax, Montreal, Quebec City, and Calgary, at 69%, government and leisure demand.
TOP 10 CANADIAN MARKETS PERFORMANCE - YTD NOVEMBER 2021 % CHANGE
80%
68.6%
70%
60%
50%
40.6%
42.1% 34.2%
39.7%
40%
33.0%
30% 26.4% 26.8%
14.8%
20%
12.7%
10%
0%
-10%
VICTORIA
VANCOUVER
CALGARY
EDMONTON
WINNIPEG
TORONTO
OTTAWA
MONTREAL
QUEBEC CITY
HALIFAX
■ OCCUPANCY ■ ADR ■ RevPAR
Source: STR | Republication or other re-use of this data without the express written permission of STR is strictly prohibited.
Photo >
Fairmont Empress
Victoria, BC
6 C AN AD I A N LO D G I N G OVERVIE W / JANUARY 2022 CUS H MAN & WAK E F IE LD 7
NEW SUPPLY SLOWS IN 2021 TRANSACTIONS MARKET
As of November 2021, STR reported a national pipeline New hotel development conditions are more challenging Below is a chart summarizing Canadian hotel transaction volumes since 2006.
of 280 projects and 32,667 rooms. Both metrics were than they were before COVID-19. Key factors include
lower than the 305 projects and 34,704 rooms in the financing availability, availability and costs of skilled
pipeline reported before the pandemic in March 2020. labour, material and transportation costs, and CANADIAN HOTEL TRANSACTION VOLUME – 2006 TO 2021
During this period, the number of hotel rooms reporting government approvals. Hotel construction loans, while
to STR declined from 454,108 rooms (March 2020) to generally more available than during 2020, are subject $5,000
445,189 rooms (November 2021). A discussion on the to increased due diligence, lower loan-to-cost ratios, and
number of properties converting to other uses is found proven sponsor requirements.
$4,000
in the Transaction review which follows.
IN CONSTRUCTION AND PLANNING PIPELINE – Q1 2020 TO Q3 2021 $3,000
VOLUME (Millions $)
Q1 Q2 Q3 Q4 Q1 Q2 Q3
PHASE TYPE
2020 2020 2020 2020 2021 2021 2021 $2,000
IN
PROJECTS 64 72 70 79 83 90 96
CONSTRUCTION
$1,000
ROOMS 7,440 8,513 8,184 9,182 9,805 10,286 10,832
$-
PLANNING 2006 2007 2008 2009 2010 2011 2012 2013 2014 2015 2016 2017 2018 2019 2020 2021
(INCLUDES FINAL PROJECTS 211 211 205 201 202 187 175
PLANNING) ■ TOTAL
Source: Cushman & Wakefield | Transactions of at least $1 Million
ROOMS 24,095 23,843 22,731 22,066 22,826 21,263 19,961
TOTAL PROJECTS 275 283 275 280 285 277 271 2021 TRANSACTION ACTIVITY BY SALE TYPE
(NUMBER OF TRANSACTIONS)
ROOMS 31,535 32,356 30,915 31,248 32,631 31,549 30,793 After a relatively slow 2020, with just over 100 sales
and under $1.0B in sales, the transaction market
Source: STR | Republication or other re-use of this data without the express written permission of STR is strictly prohibited.
saw stronger activity in 2021. Cushman & Wakefield
22% tracked over 180 sales, totaling approximately $1.7B in
transaction volume in 2021, a substantial increase from
The sentiment on the hotel industry can change quickly Projects in late planning stages were more likely to 2020. The increase in activity was most pronounced
based on public health measures and government proceed to construction. However, the number of for smaller, independent hotels and for hotels in
regulations related to the pandemic. projects and rooms in planning has been declining since 6% secondary and tertiary markets. There were few
Q2 2020 (except briefly during Q1 2021). Overall, as of large transactions and few traditional transactions
As illustrated above, the number of projects and rooms Q3 2021, the national pipeline was lower than as of in the larger, urban markets across Canada.
in construction declined briefly during Q3 2020, but Q1 2020.
both metrics have been rising for the past four quarters. Outlined in the pie graph to the left is a cross
49% section of sales we tracked in 2021.
23%
■ BRANDED- TRADITIONAL TRANSACTION
■ INDEPENDENT- TRADITIONAL TRANSACTION
■ ALTERNATE USE/REDEVELOPMENT TRANSACTION
■ DISTRESS/NON-TRADITIONAL TRANSACTION
8 C AN AD I A N LO D G I N G OVERVIE W / JANUARY 2022 CUS H MAN & WAK E F IE LD 9
With major urban areas still underperforming historic                         As noted, the segment that saw a rise in activity was the       In terms of location, most traditional sales were located            Where better quality assets have been available,
         levels by a wide margin, there were few larger assets                         independent hotels. C&W tracked just under 120 of these         in secondary or tertiary markets, many in areas less                 brokers reported strong interest and multiple bids.
         available for purchase. Ownership of these hotels are well                    sales in 2021, a substantial increase over the 80 independent   impacted by the pandemic. Markets which depend on                    Similar to the overall CRE market, the hospitality
         capitalized, have strong lender relationships and have                        sales we tracked in 2019, prior to the pandemic. The            domestic travel and local economic activity such as                  sector also benefitted from a strong influx of
         been supported by government programs allowing them                           pandemic has had a bigger impact on these properties            mining and pipeline construction, have fared relatively              investment capital. This combined with an improving
         to weather the COVID impact. One urban sale of note was                       which are often smaller, older assets operated by their         well. Sales in some of these areas reflect pricing similar           outlook for the sector made good quality hotels
         the yet to open King Blue hotel, a boutique hotel on King                     owners. In downturns, there is often a flight to quality        to pre-pandemic pricing in many cases.                               attractive to buyers in 2021. Pricing for these assets
         Street in Toronto which was acquired for $74 million or                       leaving many of these properties without sufficient business                                                                         saw little if any discounting as the demand for
         $643,500 per room.                                                            to remain viable. Owners are also less likely to benefit                                                                             investments at least partially offset the impact of
                                                                                       from the various assistance programs offered to the wider                                                                            term results on value.
                                                                                       industry. After two years of COVID, there are many cases
                                                                                       where long time owners have retired or exited the industry.

         2021 TOP INDIVIDUAL HOTEL TRANSACTIONS                                                                                                        2021 NOTABLE SECONDARY & TERTIARY MARKET HOTEL TRANSACTIONS (PER ROOM)

            HILTON GARDEN INN                         "KING BLUE HOTEL               "COURTYARD AND                   PATRICIA HOTEL                     HOLIDAY INN EXPRESS & SUITES             QUALITY INN & SUITES                      DAYS INN CANMORE
            TORONTO VAUGHAN"                          TORONTO"                       RESIDENCE INN                                                       KINCARDINE DOWNTOWN                      PETAWAWA
                                                                                     MONTREAL AIRPORT"

            $130.79 million                           $74 million                    Confidential                     $63.8 million                      $12.3 million                            $10.25 million                            $10 million

            Where:                                    Where:                         Where:                           Where:                             Where:                                   Where:                                    Where:
            Vaughan, Ontario                          Toronto, Ontario               Montreal, Quebec                 Vancouver, British Columbia        Kincardine, Ontario                      Petawawa, Ontario                         Canmore, Alberta

            Rooms: 155                                Rooms: 115                     Rooms: 329                       Rooms: 195                         Rooms: 70                                Rooms: 66                                 Rooms: 60
            Per Room: $843,800                        Per Room: $643,500             Per Room: Confidential           Per Room: $327,200                 Per Room: $175,700                       Per Room: $155,300                        Per Room: $166,700
            Date: November 2021                       Date: September 2021           Date: December 2021              Date: April 2021                   Date: September 2021                     Date: December 2021                       Date: June 2021
            Buyer: Graywood                           Buyer: Northland               Buyer: Knightstone               Buyer: BC Housing
            Developments Ltd.                         Properties                     Capital Management                                                  Takeaway: This transaction was           Takeaway: Newer hotel which               Takeaway: The hotel was acquired
                                                                                                                                                         negotiated prior to the pandemic.        performs well. This site is situated      by Basecamp Resorts (regional chain
                                                                                                                                                         The hotel will be renovated by the       close to the Canadian Forces Base         of upscale resort properties). The hotel
            Takeaway:                                 Takeaway:                      Takeaway:                        Takeaway:                          purchaser.                               Petawawa.                                 will be renovated and repositioned.
            This site was acquired for                The hotel is situated within   Well established hotels in the   The hotel and adjoining
            conversion to alternative                 the seven-storey tower of      Montreal Airport area which      parking lot was acquired for
            use. Graywood has plans                   the King Blue Condominium      has been a market leader         conversion to social housing.
            to redevelop the site into a              Complex. This is a new build                                                                     Another sector that saw strong activity in 2021 was in               social housing organizations. The other segment that
                                                                                     for many years. The hotels
            three tower high-rise, mixed-             property with no operating     will be renovated by the                                          the alternative use segment. In the larger urban areas,              was active in urban areas was acquisitions of obsolete
            use development with 1,730                history at the time of sale.   purchaser.                                                        public bodies continued to acquire in 2021 as the need               properties for redevelopment; with rising land values
            residential units.
                                                                                                                                                       for social and emergency housing remains high. In 2021,              and increased densities available, redevelopment makes
                                                                                                                                                       we tracked 21 sales acquired by municipalities and                   financial sense.

10   C AN AD I A N LO D G I N G OVERVIE W / JANUARY 2022                                                                                                                                                                                                             CUS H MAN & WAK E F IE LD   11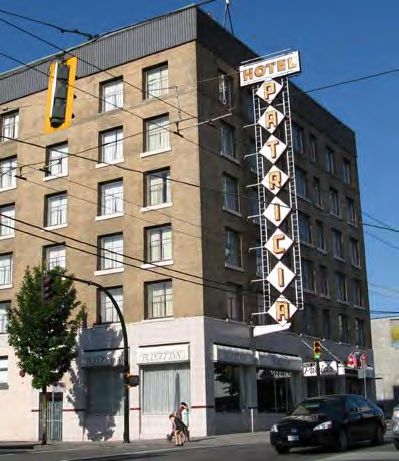
HOTEL SALES FOR CONVERSION TO ALTERNATE USE Resorts remained attractive to investors as buyers transaction was the largest hospitality deal of the year
were keen to capitalize on the surge in COVID driven and included Deerhurst and Horseshoe resorts, along
NO. OF leisure demand and the rise in revenues seen in 2021. with substantial development lands at the two resorts
DATE NAME CITY PROVINCE PRICE BUYER INTENDED USE
ROOMS
DAYS INN VANCOUVER
Most notable was the sale of Skyline’s resort assets and at Blue Mountain Resort.
MAR-21 VANCOUVER BC 65 $25,500,000 CITY OF VANCOUVER AFFORDABLE HOUSING
METRO in December at a reported price of $210 million. The
HOSTELLING INTERNATIONAL
MAR-21 VANCOUVER BC 77 CONFIDENTIAL BC HOUSING AFFORDABLE HOUSING
VANCOUVER
RAMADA LIMITED VANCOUVER
MAR-21
DOWNTOWN
VANCOUVER BC 80 $36,000,000 BC HOUSING AFFORDABLE HOUSING
2021 TOP RESORT TRANSACTIONS
MAR-21 STATION HOTEL VANCOUVER BC 32 $6,800,000 BC HOUSING AFFORDABLE HOUSING
MAR-21 THE LARK VANCOUVER BC 33 CONFIDENTIAL BC HOUSING AFFORDABLE HOUSING
MAR-21 THORNTON PARK HOTEL VANCOUVER BC 22 $4,900,000 BC HOUSING AFFORDABLE HOUSING
MAR-21 HOWARD JOHNSON AURORA AURORA ON 98 $8,250,000 -PRIVATE INVESTOR- RETIREMENT RESIDENCE
THE REGIONAL
MAR-21 BURLINGTON INN BURLINGTON ON 45 $10,000,000 MUNICIPALITY OF ALTERNATIVE USE
HALTON
GUELPH (MOG)
MAR-21 PARKSVILLE MOTEL GUELPH ON 32 $3,800,000 WELCOME IN DROP IN AFFORDABLE HOUSING
CENTRE
GREWALS INN NIAGARA NIAGARA REGIONAL
MAR-21 ON 32 $3,545,000 AFFORDABLE HOUSING
& SUITES FALLS HOUSING
SERVICES AND HOUSING
MAR-21 KNIGHTS INN ORANGEVILLE ORANGEVILLE ON 30 $3,415,000 AFFORDABLE HOUSING
IN THE PROVINCE (SHIP)
MAR-21 CANADIANA INN WHITBY ON 26 $3,741,000 -PRIVATE INVESTOR- ALTERNATIVE USE
THE CORPORATION OF
MAR-21 COMFORT INN & SUITES WINDSOR WINDSOR ON 45 $6,350,000 ALTERNATIVE USE
THE CITY OF WINDSOR
APR-21 TRAVELODGE SURREY SURREY BC 29 $8,700,000 BC HOUSING AFFORDABLE HOUSING
APR-21 BEST WESTERN PLUS UPTOWN VANCOUVER BC 68 $32,000,000 BC HOUSING AFFORDABLE HOUSING
APR-21 PATRICIA HOTEL VANCOUVER BC 195 $63,800,000 BC HOUSING AFFORDABLE HOUSING
APR-21 CAPITAL CITY CENTER VICTORIA BC 96 $24,500,000 BC HOUSING AFFORDABLE HOUSING
APR-21 GRAND MOTEL TORONTO ON 24 $5,100,000 CITY OF TORONTO AFFORDABLE HOUSING
DEERHURST RESORT AND CARRIAGE HILLS & RIDGE RESORT
APR-21 SUPER 8 DOWNTOWN TORONTO TORONTO ON 92 $22,250,000 CITY OF TORONTO AFFORDABLE HOUSING
HORSESHOE RESORT
MAY-21 TRAVELODGE CHILLIWACK CHILLIWACK BC 82 CONFIDENTIAL BC HOUSING AFFORDABLE HOUSING
Part of the $210 million acquisition $60 million
CANADA’S BEST VALUE INN
MAY-21 LANGLEY BC 46 $10,100,000 BC HOUSING AFFORDABLE HOUSING
LANGLEY
Where: Where:
JUN-21
LAKEVIEW SIGNATURE INN
CALGARY AB 120 $14,000,000 SILVERA FOR SENIORS RETIREMENT RESIDENCE Muskoka/Barrie/Blue Mountain, Ontario Horseshoe Valley, Ontario
CALGARY AIRPORT
RED LION INN & SUITES
JUN-21
ABBOTSFORD
ABBOTSFORD BC 30 $6,900,000 BC HOUSING AFFORDABLE HOUSING Date: December 2021 Rooms: 250
JUN-21 CARRIAGE HILLS RESORT ORO-MEDONTE ON 172 $41,250,000 -PRIVATE INVESTOR- CONDO APARTMENT
Buyer: Freed Hotels & Resorts Per Room: $240,000
JUN-21 CARRIAGE RIDGE RESORT ORO-MEDONTE ON 78 $18,750,000 -PRIVATE INVESTOR- CONDO APARTMENT
Date: June 2021
Buyer: Sunray Group
JUN-21 OTTAWA INN HOTEL OTTAWA ON 28 $9,925,000 -PRIVATE INVESTOR- ALTERNATIVE USE
JUN-21 WOODBINE MOTEL VAUGHAN ON $9,500,000 -PRIVATE INVESTOR- INDUSTRIAL CONDOS
Takeaway: Transaction included sale of Deerhurst and Takeaway: The two former timeshare properties were not
JUL-21 STONEBRIDGE GRANDE PRAIRIE GRANDE PRAIRIE AB 125 $12,500,000 CITY OF GRANDE PRAIRIE AFFORDABLE HOUSING Horseshoe resorts, along with substantial development lands operating at time of sale. The properties were acquired for
HOLIDAY INN CALGARY at the two resorts and at Blue Mountain Resort, and the conversion to condo units. Receivership sale.
AUG-21 CALGARY AB 151 $9,500,000 -PRIVATE INVESTOR- ALTERNATIVE USE
MACLEOD TRAIL SOUTH roll-in of Muskoka Bay Resort.
AUG-21 ROYAL INN & SUITES GUELPH ON 63 $5,000,000 -PRIVATE INVESTOR- ALTERNATIVE USE
This acquisition establishes Freed as the largest resort
OCT-21 HOTEL BELVEDERE KINGSTON ON 20 $2,300,000 -PRIVATE INVESTOR- ALTERNATIVE USE community owner, operator, and developer in Canada.
NOV-21 SANDS INN & SUITES EDMONTON AB 53 $10,800,000 NON-PROFIT AFFORDABLE HOUSING
AFFORDABLE HOUSING
TRAVELODGE SUITES Despite the ongoing impact of COVID through 2021, we As 2022 begins, the transaction market looks poised to
NOV-21 DARTMOUTH NS 75 $9,541,000 ASSOCIATION OF AFFORDABLE HOUSING
HALIFAX DARTMOUTH
NOVA SCOTIA
saw a modest increase in lender-driven activity in markets see more activity with several significant transactions
THE REGIONAL
NOV-21 COMFORT INN BRAMPTON BRAMPTON ON 107 $19,600,000
MUNICIPALITY OF PEEL
AFFORDABLE HOUSING where the prospects for recovery are less certain and in progress. Investor interest is expected to remain
COMPILED BY CUSHMAN & WAKEFIELD ULC
where challenges existed before the pandemic. high as the sector continues to recover through 2022.
12 C AN AD I A N LO D G I N G OVERVIE W / JANUARY 2022 CUS H MAN & WAK E F IE LD 13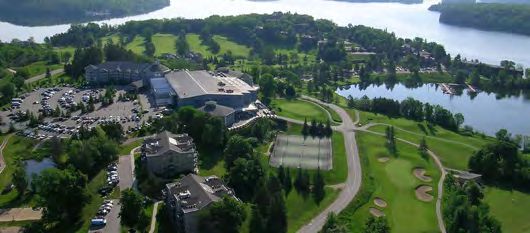
RECOVERY UPDATE
RECOVERY IN 2021 AND THE OUTLOOK FOR 2022
CANADA MARKET RECOVERY MONITOR - Weekly RevPAR Index (indexed to 2019)
The hospitality market did not live up to expectations – largely in leisure oriented markets. For Q3 2021, the
Since the earliest COVID-19 Impact
in 2021, as the slower than expected roll out of vaccines room demand was between 75% and 90% of 2019
and the emergence of new variants stalled the recovery demand quarter-over-quarter. For Q4 2021, the range 100
in the first half of the year. narrowed, with the percentage recovery rate ranging
between 80% and 90% of total demand for occupied
80
In July, most provinces relaxed social distancing room nights for the same period in 2019.
measures, restaurant capacities and mask mandates,
and the hotel industry began to see increased travel The recovery has been uneven based on the type of 60
property as illustrated in the chart below:
INDEX
40
HOTEL OCCUPANCY BY LOCATION
20
80%
69.3% 71.3%
65.5% 64.3%
0
57.8%
07-MAR
21-MAR
04-APR
18-APR
02-MAY
16-MAY
30-MAY
13-JUN
27-JUN
11-JUN
25-JUL
08 -AUG
22-AUG
05-SEP
19-SEP
03-OCT
17-OCT
31-OCT
14-NOV
28-NOV
12-DEC
26-DEC
09-JAN
23-JAN
06-FEB
20-FEB
06-MAR
20-MAR
03-APR
17-APR
01-MAY
15-MAY
29-MAY
12-JUN
26-JUN
10-JUL
24-JUL
07-AUG
21-AUG
04-SEP
18-SEP
02-OCT
16-OCT
30-OCT
13-NOV
27-NOV
11-DEC
25-DEC
60% 55.4%
45.6% 44.2% 45.7% 45.7% WEEK ENDING
41.6%
40% 37.1%
2020 2021
■ WEEKLY ReVPAR INDEX ■ 4 -WEEK MOVING AVERAGE
Source: STR | March through December 2021 results are indexed with the same time period in 2019.
20%
THE OUTLOOK
0%
■ 2019
URBAN
■ 2020
SUBURBAN
■ YTD NOV 2021
AIRPORT INTERSTATE RESORT SMALL METRO/TOWN
Source: STR | Republication or other re-use of this data without the express written permission of STR is strictly prohibited.
In 2021, the Canadian hotel market’s overall demand
recovered to 66% of 2019 levels.
CANADA HOTEL OCCUPANCY AND AVERAGE DAILY RATE Although the outlook varies by type and location
2019
100% $190 of property, a review of budgets provided to us and
discussions with several operators, indicate that
operators are generally budgeting anywhere between
80% $170 75% and 90% of the demand captured in 2019. In a 2020
handful of cases, some hotels and markets in Canada
will fully recover to 2019 levels in 2022.
60% $150
2021
This is a significant improvement and illustrates the
40% $130
ability of the industry to recover relatively quickly
once travel and public health measures relax. Despite 2022F
the setback from the Omicron wave, recovery should
20% $110 continue through the balance of 2022. The chart to the 0 10 20 30 40 50 60 70
right illustrates demand levels for 2020-22 versus 2019.
■ OCCUPIED ROOM NIGHTS (ORN, in Millions)
0% $90
JAN FEB MAR APR MAY JUN JUL AUG SEPT OCT NOV DEC
■ 2019 ■ 2020 ■ 2021 Source: STR | Republication or other re-use of this data without the express written permission of STR is strictly prohibited.
14 C AN AD I A N LO D G I N G OVERVIE W / JANUARY 2022 CUS H MAN & WAK E F IE LD 15
RECOVERY LABOUR CHALLENGES

                                                                              In addition to general inflationary increases, hotels are seeing inflation in the cost of
                                                                              salaries and wages for a variety of reasons: 1) a shortage of labour, 2) competition with
                                                                              other industries, and 3) the rise in minimum wages across the country. Overall, National
                                                                              unemployment was as high as 9.4% in January 2021. In July 2021, the unemployment rate
                                                                              dropped to 7.5% and then down to 5.9% by December 2021. Despite this decrease, many
                                                                              industries are reporting a shortage in available labour – not just the hotel industry.

                                                           With a smaller     At the start of the pandemic, hotels made the decision to lay off staff, retaining a skeleton

                                                            labour force,     team of executive management and employees. Between then and mid 2021, some
                                                                                   staff had found jobs in other industries or made the decision to remain laid off. The
                                                           hotel employees             ongoing risk of another variant and further restrictions, as well as the uncertainty
                                                                                          of sudden spikes in demand levels, kept hotel operators unable to commit to
                                                            in some cases                  rehiring. Unfortunately, when demand began to surge in the summer months,
                                                                                            hotel operators were scrambling to find housekeeping and restaurant staff.
                                                            were working                    Some hotels were forced to keep restaurants at limited capacity, and keep
                                                                                            guestrooms out of inventory due to labour shortages. The net result has
                                                             longer hours                  been an increase in wages and incentives.

                                                             or needed to                 In 2021, operators were budgeting for higher than inflationary increases in

                                                           complete tasks                     salaries and wages. With a smaller labour force, hotel employees in some
                                                                                                            cases were working longer hours or needed to complete

                                                           outside of their                                   tasks outside of their normal duties.

                                                            normal duties                                        Now with the Omicron variant upon us, we expect
                                                                                                                 further delays in return to work as hotels weather
                                                                                                                  the next 2-3 months. January and February tend
                                                                                                                   to be slower months for the hotel industry, and
                                                                                                                    operators are optimistic for the potential of spring
                                                                                                                    break season in March. We do not expect layoffs
                                                                                                                     to the extent seen in the early days of COVID as
                                                                                                                      demand for leisure travel will continue. As recovery
                                                                                                                      expands to the larger urban hotels and as group
                                                                                                                       demand resumes in 2022, there will be challenges
                                                                                                                       in staffing as some younger employees have
                                                                                                                        chosen to find alternative work. The industry will
                                                                                                                        need time to recruit and train staff, likely at higher
                                                                                                                        costs in 2022 and beyond.

16   C AN AD I A N LO D G I N G OVERVIE W / JANUARY 2022                                                                                                      CUS H MAN & WAK E F IE LD   17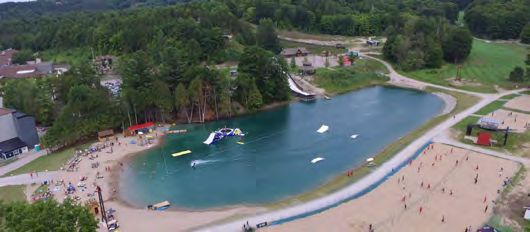
CONCLUSION AND OUTLOOK

                                 In 2021, the accommodation market saw a resurgence in
                                 demand as the latter half of the year saw recovery in leisure
                                 and certain types of group demand.

                                                             Going into 2022, the Omicron
                                                             variant has put a halt to the
                                                             recovery, at least in the near
                                                             term. As this surge passes
                                                             and as vaccination rates and
                                                             immunity levels rise, we expect
                                                             to see continued growth and
                 As we saw in                                recovery through the latter

                  2021, many
                                                             part of 2022. As we saw in
                                                             2021, many travelers are eager

                 travelers are                               to put the pandemic behind
                                                             them and resume travel and
                 eager to put                                normal activities as soon as
                                                             possible. Most forecasts project
                the pandemic                                 market recovery to 2019 levels

               behind them and                               by 2023-24. As Omicron has
                                                             shown, this recovery is not
                resume travel                                expected to be linear.

                  and normal                                 While the impact from COVID
                                                             is severe, the hospitality
               activities as soon                            industry has weathered many

                  as possible                                cycles and challenging times.
                                                             The industry has been forced
                                                             to change and adapt and
                                                             will continue to do so as the
                                                             impact of COVID lessens. It
                                                             is telling that there is such
                                                             strong interest in commercial
                                                             real estate in general, and in
                                                             hotels specifically, suggesting
                                 investors see the longer-term return on investment as
                                 very positive.

18   C AN AD I A N LO D G I N G OVERVIE W / JANUARY 2022                                         CUS H MAN & WAK E F IE LD   19
VALUATION & ADVISORY CANADA - HOSPITALITY & GAMING
OUR SERVICES
Appraisals / Market Studies / Market Research / Expert Testimony
For more information about
Canadian Lodging, please contact:
Brian Flood, AACI P.App., MRICS Gaith Saqqa
Vice President Senior Consultant
Practice Leader +1 416 359 2595
+1 416 359 2387 gaith.saqqa@cushwake.com
brian.flood@cushwake.com
Vanessa Boland
Cindy Schoenauer, AACI P.App., RI Senior Consultant
Vice President +1 778 513 0857
+1 604 640 5862 vanessa.boland@cushwake.com
cindy.schoenauer@cushwake.com
Lauren Arnold
Vadess Johan, AACI P.App. Senior Consultant
Associate Vice President +1 416 359 2478
+1 416 359 2374 lauren.arnold@cushwake.com
vadess.johan@cushwake.com
Daniel Fung
Consultant
+1 416 359 2479
daniel.fung@cushwake.com
TORONTO
161 Bay Street, Suite 1500
Toronto, ON M5J 2S1 | CANADA
VANCOUVER
Pacific Centre
700 West Georgia Street, Suite 700
Vancouver, BC V7Y 1A1 | CANADA
cushmanwakefield.com
cushmanwakefield.comYou can also read