Busting the FOGO myths - PRESENTATION TITLE HERE Waste 2018 Conference
←
→
Page content transcription
If your browser does not render page correctly, please read the page content below
DATE HERE

     PRESENTATION
     TITLE HERE
May 2018
     PRESENTED SUBTITLE HERE

Busting the FOGO myths
Waste 2018 Conference
Presented by Virginia Brunton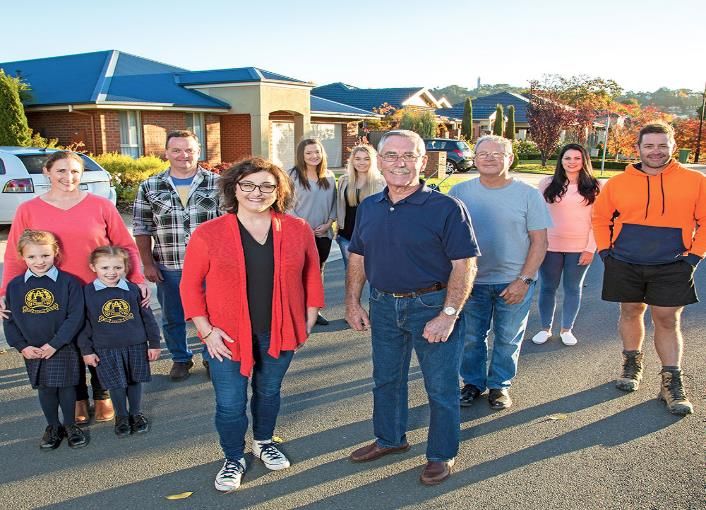
The Case for Food Organics

                              $5,000                                                                             Plastic bags
                                             Green $ Value
         Cost per tonne ($)                  Large Tonnage                                                      Butts

                                                                                                                CDs

                                                                                        E waste           Returned food

                                                                                                         Textiles
                                                                                 Mattresses
                                                                    Wood
                                                                                Glass               Batteries
                   $30-$60                                     Organics- Food
                                                      HDPE     waste, Manure                        Fluoro tubes
                                                                                  Concrete
                                 $0
                                       Efficient        PET                                       Inefficient
                                 Metals            Cardboard

2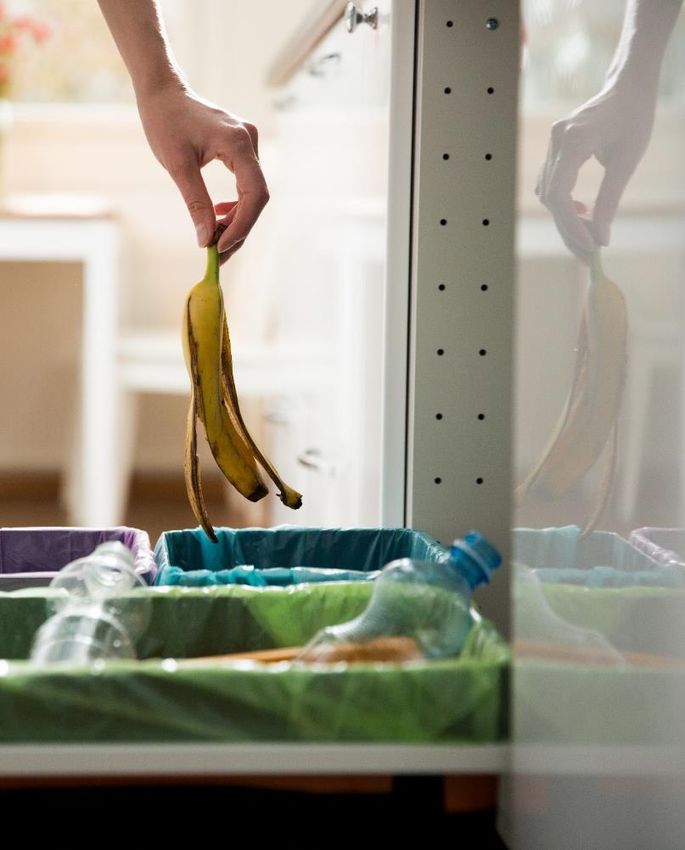
EPA growth projections for total organics in NSW -2021
                                                          Projected organics growth

    2014 recovery
                                  3000
    1.1Mt                                                                                                              ?
                                  2500
                                                                                                                            Ref: NSW EPA Draft WARR Infrastructure Strategy

    Additional                    2000
                    '000 tonnes
    1.4Mt by 2021                 1500

                                  1000     Ref: NSW EPA WARR data 2014-
    2014 disposal                          15 and NSW processors survey

                                   500
    1.6Mt
                                     0
                                         2014        2015            2016        2017           2018   2019   2020   2021
    Total = 2.5Mt                                                                       Years
                                                                            GO     FOGO

3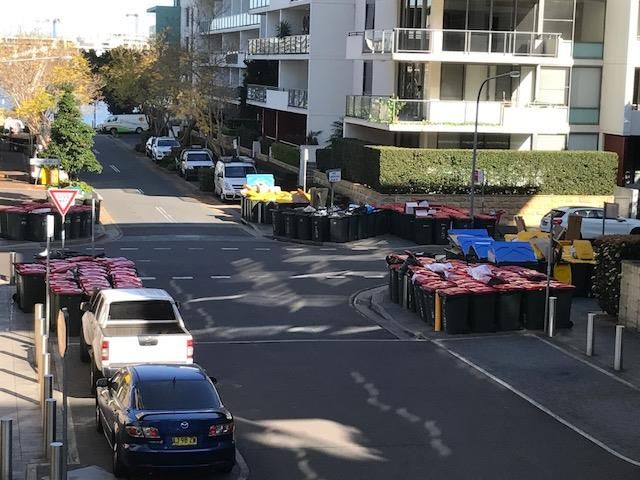
Growth projections for MSW organics in NSW -2021
                                                                        Predicted growth in organics recovery
                                            1200

    Currently                               1000

    (2015) 808Kt
                    '000 Tonnes collected
                                            800

                                            600

    Total = 1.1Mt                           400
                                                                                                                                                                       Ref: NSW EPA WARR data 2014-
                                                                                                                                                                       15 and NSW processors survey
                                            200

                                              0
                                                   2006

                                                          2007

                                                                 2008

                                                                        2009

                                                                               2010

                                                                                       2011

                                                                                              2012

                                                                                                     2013

                                                                                                               2014

                                                                                                                      2015

                                                                                                                             2016

                                                                                                                                    2017

                                                                                                                                           2018

                                                                                                                                                  2019

                                                                                                                                                         2020

                                                                                                                                                                2021
                                                                                                        Year

                                                                                      NSW total             Linear (NSW total)

                    Similar trends for other states
4
Composition of Waste to Landfill – From a general
    waste Bin (Red)
                      80%

                      70%                      5%               Yellow bin
                                               2%
                      60%                     13%
                                               1%
                      50%

          Weight %    40%
                                              17%
                                                                                       Green bin

                      30%
                                                                   53% Organics
                      20%
                                              35%

                      10%

                        0%
                                             MSW
                     Food organics     Garden organics   Wood/timber
                     Paper/cardboard   Textiles          Other organics

                                                                                  Source: Blue Environment,2014
5
What are the options?

                                 2-bin - residual to MBT

3-bin GO only –
BAU – residual to
MBT or landfill

         MBT                     1 or 2-bin to EfW
          Or
         EfW

6                   3-bin FOGO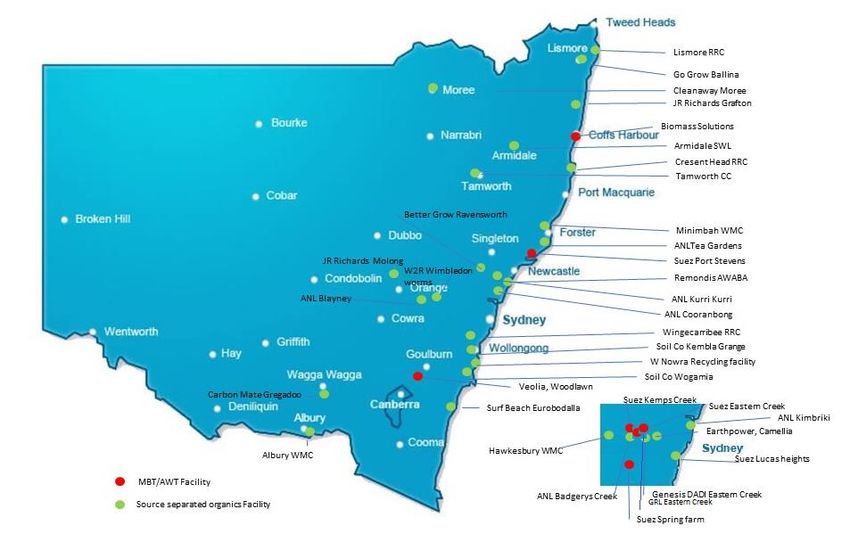
Ready, set, FOGO

                                                FOGO

                                  ~13%          ~ 53%

             ~34%

                    Fortnightly   Fortnightly   Weekly

7
Economics of FOGO
                                              W      F       F

       50% households have 3 bin
       service

                         720L per fortnight

                                              240L   240L   240L
                                                     GO

8
Economics of FOGO
                                                               W      F

       50% households have 3 bin                                             GO
       service with GO

                                   720L per fortnight

                                                               240L   240L

                                                  food

                                           F             W
              720L per fortnight

                                                                   FOGO
                                                                                  In time the bin collection
                                                                                  frequencies are reversed
                                           240L         240L

9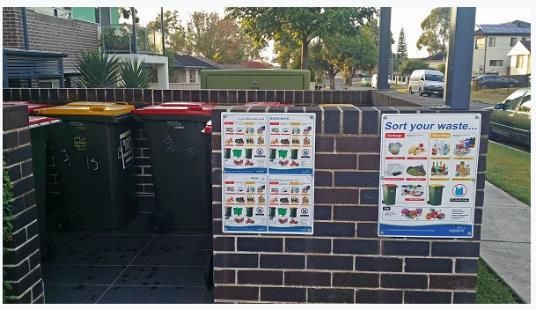
~$300 ~$80
                                                        /tonne /tonne
Economics of FOGO
                                                            W    F

       50% households have 3 bin
       service

                                   720L per fortnight

                                                 food

                                           F            W
              720L per fortnight

                                       ~$300 ~$110
                                      / tonne /tonne

10
FOGO wins on cost- So why not go FOGO?
Comparison of landfill cost v. MBT v. FOGO gate fee ($/tonne)
$350
$300
$250
$200
$/tonne
$150
$100
$50
$-
VIC TAS WA QLD Regional Regional Regional Metro NSW Metro NSW Metro NSW
NSW #1 NSW #2 NSW #3 #1 #2 #3
Landfill FOGO AWT
11~$300 ~$80
FOGO economics stack up /tonne /tonne
W F ~ combined
50% households have 3 bin $249/tonne
service based on average residual
(28,700 t) and organics (8,948 t)
WARR 2014-15
food
~53%
~ combined saving ~$70/tonne
F W
$179/tonne
Average metro council ~$2.6m pa
~$300 ~$110
/ tonne /tonne
12National
NSW
35 FOGO
13NSW 14
Sydney

15
Current NSW FOGO rollout
                                           FOGO
       Regional councils

                           45*   26   34

       Metro councils

                            2    38
                                      1
16
No go FOGO
Waste managers
consider that:
• The community is not interested;
• It is difficult for Multi-Unit Dwellings
(MUDs);
• The contamination rates are too
high; and
• There are no processors capable of
accepting FOGO.
• No market for the output
Its just too hard?
Staffing and capacity constraints?
Contractual arrangements/interests that maintain
the status quo
17Community is not interested
Have they really been asked? If a FOGO service was introduced would you be willing to participate?
Moyne Shire –
Willingness - 56%,
Metropolitan with caddies 70%
Melbourne
Willingness -71% Murray Shire –
66% say it should Willingness- 72%
be compulsory and would pay
between $1 & $2
per week
The FOGO decision starts with council,
generally not requested by the community Albury City
Willingness - 72%
Participation rate
82%
18Community engagement
Establish a community advisory group (CAG)
Begin community education and discussion 1-2 yrs out from deployment
‘Brand’ the change
Increase communication 6 months before
Establish a “FOGO Friendly Force” (FFF)
Develop key messages-what to do
During deployment provide:
Instruction brochures delivered with kitchen caddies
Stickers placed on bins and/or caddies
Use FFF to discourage contamination –Develop a rewards program
Post Deployment
FFF maintain a presence, auditing bins, advising residents
Maintain media
‘Thanks Campaign’
19Community engagement done well
• Many Councils have done
consultation well.
• Lake Macquarie for example
did:
• A comprehensive options
analysis
• Cost Benefit of options
• Community Consultation
program on all options
• Technology assessment
• Recycling and waste strategy
• Selected a preferred option
• Tendered the preferred option
• Regular and consistent
messaging to community
20Difficult with MUDs
High turn-over
Low care-factor
Bin storage and presentation
21Difficult with MUDs
Options for MUDs
• Provide 660L shared food organics bin, replacing 1 out of every 10 red
bins,
• De-contamination costs built in to contracts
• Provide free kitchen caddy and liners
• Well-researched and resourced MUDs communication including
residents survey
? Need to know what the relative costs are compared to landfilling
Fully engage the body corporate in developing the program
South Korea option – RFID food waste bins
22Difficult with MUDs
Work with strata managers and estate agents
• Resourcing new tenants
• Accessing sites and waste infrastructure
Communication is critical
• Keep it simple, and visual
• Use schools, community groups and face to face ;
• Promote positive messages
• Keep educating, consistent and on-going
Still roll-out to SUDs
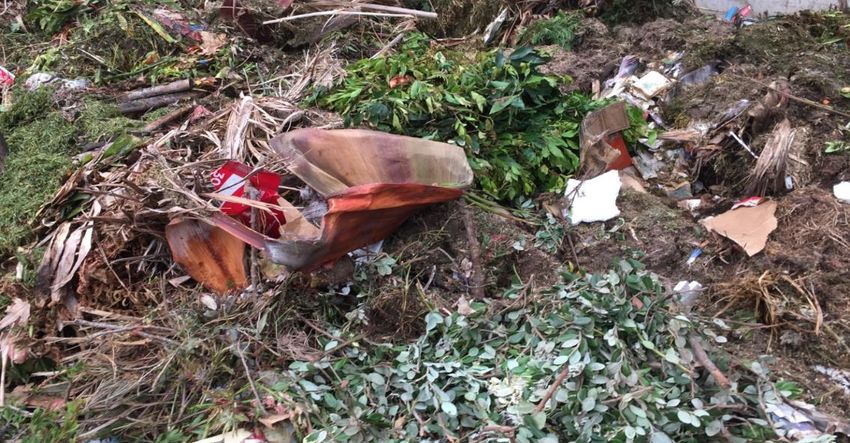
23Contamination rate is too high
A recent survey of FOGO service providers showed that typical levels of
contamination levels were manageably low at an average of 2.2%
Council Area Physical contamination (% by weight)
Penrith 4.7%
Parkes, Forbes, Bathurst 1%
Metro Adelaide 5% on a good day, 10% on a bad day
Regional SA + commercial FONo processors, no capacity, no demand
25
50,000 tonne
FOGO facilityNo market for composted FOGO?
NSW – 50 million ha pastures
– 6.5 million ha crops
85% of soils within 200km
of Sydney have less than
1.5% SOC (2.5% desirable)
Paying $26+ /t , $130/t
51,000 ha applied
26What is required? ?Funding for bins? ? Funding for education? ? Need a comprehensive survey of metro councils to understand and overcome the barriers. 27
Making it work
     Understand
     the business
         case
                    Get the right
                     plans and
                    strategies in
                        place
                                    Communicate &
                                     educate and
                                         keep
                                    communicating
                                      & educating
                                                     Maintain and
                                                     monitor low
                                                    contamination
                                                       and high
                                                     participation
28
Develop the business
case
Cost the Multi-criteria analysis
options
Decide
29Plan strategically
2 step dance
30Communicate
Communicate
before, during and
after
31Making FOGO work bring the
community
along with
you
Do the two-
step dance
Be gradual
Go small Use well-
slowly designed bin
Supply free stickers
caddies and
liners Provide on-
going
Offer differ bins incentives
for different
needs
Reminder
stickers on
residual bins
32Key FOGO points 7.5 million
The opportunity
3.8 million tonnes organic waste annually
NSW recovers 1.6 million tonnes of organics annually with half of
that being GO and only 6% FOGO.
1.8 million tonnes landfilled annually
If all NSW councils shifted to FOGO:
An additional 630,600 tpa of organics would be 630,600 tonnes of FOGO landfilled
recovered annually
The average council would save $2.6 m per annum
The compost sector would nearly double
Need a comprehensive study of what is required to
make it happen
33You won’t be alone… 34
35
You can also read