Approximate noise maps as instrument for evaluation of the city environment quality
←
→
Page content transcription
If your browser does not render page correctly, please read the page content below
Noise Mapping 2021; 8:260–267

   Research Article

   Alexander Ziv* and Elena Solov’eva

   Approximate noise maps as instrument for
   evaluation of the city environment quality
   https://doi.org/10.1515/noise-2021-0021                                 dren’s mental development and school performance [4].
   Received Dec 31, 2020; accepted Jul 07, 2021                            Prioritization and choice of noise protective measures on
                                                                           the city scale require information about spatial and tempo-
   Abstract: The paper discusses noise mapping from the
                                                                           ral distribution of noise levels. Noise maps – current and
   prospective of general evaluation of the state of the city
                                                                           projections - can be very useful, for instance, to city plan-
   environment. Suggested is a noise evaluation procedure
                                                                           ners for designing and approving new construction or for
   based on a two-step spatial discretization - coarse and fine
                                                                           improving the existing living spaces.
   grids. The coarse grid is used for evaluation of average noise
                                                                                Noise mapping is considered in numerous works, var-
   levels (background noise). For this, rather simple method
                                                                           ious computing systems and models are involved, often
   is proposed, where average noise levels are estimated di-
                                                                           in combination with measurements in order to correct er-
   rectly for the whole coarse grid cells instead of averaging
                                                                           rors that are inevitable in mathematical modeling of noise
   the noise levels computed point-wise. The fine grid is used
                                                                           propagation processes. Models differ in details, but most
   for finding the obstacle density to apply in calculations over
                                                                           are based on the concepts of geometric acoustics taking
   the coarse grid. It may be used also for additional noise lev-
                                                                           into account the main features of noise propagation in-
   els detailing in the close vicinity of noise sources where
                                                                           cluding attenuation due to shielding, reflection, weather
   noise propagation is strongly affected by surrounding struc-
                                                                           conditions, etc.
   tures. The detailed results allow correction of the averages
                                                                                Among the most well-known software packages
   over the coarse grid. In comparison with other approaches,
                                                                           are SoundPlan (http://www.soundplan.eu/english/soun
   the suggested procedure takes little computing time to ex-
                                                                           dplan-acoustics/),       CadnaA     (www.datakustik.com),
   ecute for the entire city. Test example shows reasonable
                                                                           NORD2000            (http://eng.mst.dk/topics/noise/traffic-
   agreement with results computed using the ‘Ecolog-Noise’
                                                                           noise/nord2000-nordic-noise-prediction-method),
   software package that has gained popularity in Russian
                                                                           HARMONOISE [5], FHWA TNM (https://rosap.ntl.bts
   Federation since its introduction in 2008. Another exam-
                                                                           .gov/view/dot/48763) developed in the EU and the
   ple describes the application of the proposed method for a
                                                                           USA, ARM Acoustics (http://www.noiseview.ru/conten
   moderate size densely built city.
                                                                           t/3d.html) and Ecolog-Noise (http://integral.ru/shop/c
   Keywords: noise mapping, average noise level, mesh points               argo/141.html) developed in Russian Federation. The lat-
                                                                           est commercial software follow guidelines published
                                                                           in Common Noise Assessment Methods in Europe
                                                                           (CNOSSOS-EU) [6], which partly is the development
   1 Introduction
                                                                           of the former International Standard ISO 9613-2: 1996
                                                                           (ISO) (https://www.iso.org/obp/ui/#iso:std:iso:9613:-2:ed-
   Urban noise is an inherent part of the environment in big
                                                                           1:v1:en).
   cities. It is one of the negative consequences of the develop-
                                                                                Development of noise mapping systems in the last
   ment of the city infrastructure. There are numerous studies
                                                                           decade is driven by Environmental Noise Directive EU
   confirming the negative impact of noise on the quality of
                                                                           2015/996 [7]. For noise mapping purpose, advanced noise
   the life of the population [1, 2, 3]. Noise even affects chil-
                                                                           propagation models get integrated with GIS systems. This
                                                                           allows automatic presentation of noise levels in static and
                                                                           dynamic mode.
   *Corresponding Author: Alexander Ziv: Electrotechnical Univer-               Noise mapping projects for Madrid [8] and Paris [9]
   sity "LETI", Department of Mathematics, 197376 Saint Petersburg,
                                                                           boosted progress in development of noise mapping strate-
   Russian Federation, E-mail: sasha-ziv@mail.ru
   Elena Solov’eva: Saint Petersburg State University of Architec-         gies. The success partly is due to reduction in the cost of
   ture and Civil Engineering, Department of History and Philosophy,       the instrumental part but probably more because of im-
   190005 Saint Petersburg, Russian Federation

  Open Access. © 2021 A. Ziv and E. Solov’eva., published by De Gruyter.                This work is licensed under the Creative Commons
Attribution 4.0 License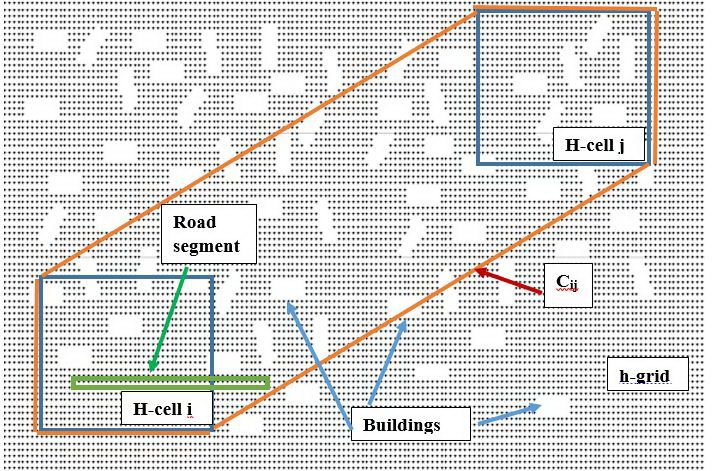
Approximate noise maps as instrument for evaluation of the city environment quality |   261

provement and optimization of computational algorithms. free optimization helps significantly in case of air pollu-
For instance, in DYNAMAP project for Milan [10, 11] static tion mapping. Similar considerations can be applied to the
noise maps were prepared in advance for a set of typical noise mapping, at least in principle.
situations and a predefined set of road stretches, some-           Nowadays, in large cities in calculations of air pollution
thing like the matrix of maps. For any particular moment, for the entire city are regularly carried out using the emis-
the appropriate maps then could be chosen, thus reducing sions inventory from all urban sources. The results are used
computing time significantly. Another time saving feature for evaluation of the state of the city environment, planning
in DYNAMAP was rather simple procedure for assimilation of mitigation of air pollution, etc. The corresponding air pol-
of measurement data. With this approach, moving from lution mapping is based on the concentration data obtained
static to dynamic maps did not take a lot of time. Unfortu- for usually uniform grid. The step size varies depending on
nately, it is not indicated in [10] how long it took to map the city size and the number of air pollution sources. As a
the Milan area on the 10 m grid and what details of the city rule, in big cities it is equal to 500 m. To expand the charac-
environment were accounted for. In another work [12], the teristics of the urban environment by information on noise
spatial-temporal correction was used for interpolation of pollution, it may be useful to supplement the calculations
modelling results and correction of some model parame- of air pollution with calculations of average noise levels,
ters. This approach provided a compromise between model linking the results to the same computational grid.
performance and its computational cost.                            To evaluate whether noise averaged on the grid of this
     The scale and configuration of the scene put forward size (about 500 m) can be a meaningful noise character-
requirements for the set of input data and discretization istic, we turned to studies in the field of environmental
of the sources and computational domain. When compu- psychology. After all, some researches report complex and
tational cost becomes critical, we need to switch off some ambiguous relationship between objective characteristics
features of the software and/or simplify scene parameters. of the environment and the subjective assessments of these
The scale and extent of discretization depend also on the characteristics by residents [22]. To determine how city resi-
aim of calculations. It is rather evident that the contribu- dents perceive such environmental characteristics as noise
tion of road noise is the highest in the close vicinity of the and dust, we conducted a study among the students attend-
road. If we consider the compliance with the standards for ing the University of Architecture and Civil Engineering
allowable noise levels and permissible exposure at a partic- (Saint Petersburg, Russia).
ular place, one can limit the scale of precise discretization      In our study, we utilized the method of mental maps
by road proximity. Here, the discretization of built-up area and a questionnaire. Mental maps are visual geo-images
is a challenge, but this area is quite limited.                that reflect individual ideas about a city or a part of it
     Since city road transport is main cause of noise pollu- [23]. We asked the respondents to draw a map of the area
tion, its treatment in noise propagation models is one of that they perceived as their domain, that is where their
the crucial points. The main problem is the segmentation outdoor life activity predominantly took place, and mark
of the road. The receptor-house-road projection approach on that map the attractive (quiet, clean) and unattrac-
requires recalculation of road partition for each receptor. tive (noisy, dusty) locations. The questionnaire contained
For keeping accuracy without projections, the finer road closed-ended questions about the environmental qualities
partitioning is needed. A slightly different approach is a of their domain area and open-ended questions about the
fixed partitioning of sources, primarily roads, with its link- noisiest and quietest areas in the city and about the least
ing to a GIS grid, on the basis of which or with the help of pleasant city noises.
which noise mapping is carried out [13, 14, 15].                   The analysis of the students’ maps and responses
     City scale computations need simplifications and ap- showed that the size of the subjectively perceived domain
propriate choice of computational domains and sets of grid area varied in the range of 500-800 m in diameter and lit-
points. It seems reasonable to divide the space, on which tle depended on how well the respondents, by their own
the noise assessment is carried out, into separate areas: assessment, were familiar with the area details. The re-
zones located near the noise sources and the rest ones, spondents usually defined the subjective domain area as
where city geometry can be taken into account very approx- the area bounded by the streets that they characterized as
imately [16, 17, 18]. A number of works devoted to the assess- the main sources of noise and dust. If the domain area was
ment of the background noise in the city analyze possible expanded beyond such streets then most often the expan-
errors associated with insufficient consideration of local sion included some kind of green zone - a park or a square,
features [19, 20]. As to the grid choice, it is shown in [21] or some perceived attractive leisure or necessity (shopping,
that both source oriented irregular grid and/or derivative parking) facility.
262 | Ziv and Solov’eva

     Practically all domain areas contained a mix of attrac-      dynamic mode. It is worth to mention the low computa-
tive and unattractive places, but their proportion varied.        tional cost of the proposed method, at least at the stage of
When describing their perception of the noisiness of their        background noise calculations.
domain area as a whole, the respondents easily mentally               The next Section 2 outlines the method and gives a
converted noise variations into a general or averaged char-       simple example of its application. The results are compared
acteristic expressed in such terms as very noisy, mostly          with calculations by full model Ecolog-Noise approved for
noisy, mostly quiet, etc.                                         usage by Russian Environmental Authorities.
     Among the most unpleasant urban noises, the respon-
dents named noise from vehicles, sounds of working con-
struction and repair equipment, crowd noise, shouts of
people and advertising promoters, loud music from car cab-
                                                                  2 Methods
ins. The noisiest areas were the central areas, where the
traffic noise overlapped with the noise of the crowd. The         2.1 Geometry and algorithm in general
quietest were residential areas. Vehicle noise sometimes
was the issue there too, but to a lesser extent than in central   City environment is considered as 2D limited domain. We
areas.                                                            introduce two uniform grids in it with steps H and h (h <
     The results of the study are interesting and promising       H), namely a coarse grid GH and a fine grid Gh . Average
from the prospective of the suggested method of average           noise levels are calculated in the grid cells associated with
noise estimates. The study confirms that characterization         GH , H-cells. The fine grid with corresponding h-cells is an
of city districts by average noise levels can be meaningful       auxiliary one used for discretization of the scene. In partic-
and useful to city residents; it corresponds to the way they      ular, one can mark building projections by h-points. Thus
themselves evaluate noisiness of city neighborhoods. The          we can transit, at least partly, from continuous objects to
suggested step size of the coarse computational grid (about       discrete ones. Geometry sketch is shown in Figure 1.
500 m) is close to the typical size of the areas that residents        We connect two H-cells i and j by the polygon Cij shown
perceive as the domain area of their habitat (500–800 m). It      in Figure 1 and calculate the number N of h-grid points in-
opens a possibility for verification of our model estimates,      side building projections on horizontal plane (white spots).
at least in a relative sense, by surveying residents’ percep-     Building density in the polygon Cij is then set to
tion of noisiness of the areas surrounding their place of
residence or work.                                                                      B ij = Nh2 /A(C ij )                (1)
     In the proposed here methodology of approximate              where A(Cij ) is the area of Cij .
noise mapping in the city scale we calculate the average               Any source of noise in the cell (e.g. a road segment
noise levels (in a sense of logarithmic averaging) in the cells   inside) may be also represented by a set of h-grid points
on the coarse grid using information on the sources (mainly       with evenly distributed noise intensity. However, as it will
roads) and available data about built-up areas. Noise prop-       be shown in Section 2.2, source contributions to the average
agation with simultaneous averaging described in Section          value of noise level inside H-cell can be easily calculated
2.2 accounts for the built–up areas by means of Ahous,1 at-       straightforward. Note that projecting sources and buildings
tenuation as defined in ISO. The other noise propagation          on the Gh would not be needed if accurate enough data are
features can be partially incorporated as well. These av-         available and the discretization is not advantageous from
erage values can be referred to as the background noise           the prospective of computational time.
values in the cell. They can be modified then with the help            Noise sources are distributed over H-cells either by cor-
of more precise calculations on a fine grid in very limited       responding sets of h-points or as line or area segments of
area alongside the road segments inside the cells using a         the roads. The average noise level for a given H-cell is com-
full model and the local scene data.                              puted as a sum of contributions of the noise sources in all
     In the context of noise mapping strategies adopted in        H-cells including the given one. Corresponding formulas
European countries, our work hardly pretends to be in close       are in Section 2.2. To include the attenuation by built-up
connection, although formally we compute static maps as           areas, we use the attenuation term Ahous,1 defined in ISO
multipliers, which can be supplemented by time dependent          9613-2 . It is proportional to a density of buildings, so for
traffic noise intensity, corrected by measurements, etc.          each pair of H-cells i and j, we use the value of density Bij
     Our computations provide estimates of the state of the       (1).
city noise environment. The background noise data can
be useful also for local noise estimates both in static and
Approximate noise maps as instrument for evaluation of the city environment quality |           263

                                                                                       ∫︁ r ∫︁2π
                                                                                 1                         ρ
                                                                    P a (R) =                                         dϕdρ =
                                                                               2π 2 r2            R2 − Rρ cos(ϕ) + ρ2
                                                                                       0 0                                               (3)
                                                                                          r2
                                                                                 (︂            )︂
                                                                          1
                                                                    −         ln    1 −
                                                                        2πr2             R2

                                                                      As a justification for replacing square cells with circles,
                                                                 one can say that we associate results in G-grid points with
                                                                 sound pressure level (SPL) averaged over the area equal to
                                                                 H2 . From this prospective, the replacing is consistent. We
                                                                 have overlapping zones and blind spots, but the combined
Figure 1: Geometry sketch.
                                                                 area of the latter is less than 10%, which can be accepted
                                                                 as we do not look for noise hot spots.
                                                                      By means (2) or (3) one can calculate the contribution
    It should be noted that a similar configuration was in-      to an average value over the circle of radius r of any stretch
troduced in our previous work [24], which will be discussed      of the road or a set of sources uniformly distributed in some
in Section 3.                                                    rectangle. Using coordinate transform, we can always as-
                                                                 sume that a line segment of the length D is located in (-D/2,
                                                                 D/2) along OX axis, a rectangle with the sides D1 and D2
2.2 Averaging functions and calculation                          is located in (-D1 /2, D1 /2)×(-D2 /2, D2 /2) with the center in
    algorithm                                                    the origin, and the center of the circle is in some point(x,
                                                                 y). Thus, in case of (3), the contribution of a line segment
When describing a contribution of noise generated in one         reads
H-cell to noise level in another cell (might be the same as
well), we call the first H-cell the source cell and the other                                        ′
                                                                                                   ∫︁ /2
                                                                                                   D         (︃                     )︃
one the receptor cell.                                                                 1                                 1
                                                                  P a 1(x, y, D) = −                       ln 1 −                        dξ
     We calculate the averages for H-cells by explicit ex-                           2πr20 D′                              2
                                                                                                                  (x′ − ξ ) + y′2
                                                                                                 −D′ /2
pressions but not as mean values (in logarithmic sense) of
                                                                                                                                         (4)
pointwise results. To derive corresponding formulas let’s
                                                                 and the contribution of a rectangle reads
substitute the averaging over a square H-cell with averaging
over a circle of radius r = √Hπ with the same area. Without
loss of generality, we can consider the center of the cell                                              1
                                                                        P a 2 (x, y, D1 , D2 ) = −
at (0, 0) and the source at (R, 0). Assuming point source                                             2πD′1 D′2
                                                                            ′       ′
                   1                                                      ∫︁2 /2 D∫︁1 /2
                                                                          D
function p(x) = 2πx  2 and using polar coordinate system (ρ,
                                                                                           (︃                           )︃               (5)
                                                                                                          1
φ), the average value Pa (R) over the circle of radius r reads                           ln 1 −         2          2
                                                                                                                             dξdη
                                                                                                (x − ξ ) + (y′ − η)
                                                                                                  ′
                                                                        −D′2 /2 D′1 /2

                      ∫︁ r ∫︁2π
              1                      ρ                           where x′ =x/r, y′ =y/r and D′ =D/r, D1 ′ =D1 /r, D2 ′ =D2 /r.
  P a (R) =                                      dϕdρ =
            2π 2 r2     R2 − Rρ cos(ϕ) + ρ2 + α                       It can be shown that for R ≥ 3.3r one can use point
                  0 0
           ⎛                √︁(︀                       ⎞         source functions instead of averaging functions (2), (3) with
                                             )︀2
    1        α2 − R2 + r2 +      α2 + R2 + r2 − 4R2 r2           the relative error less than 5%. It follows also that in this
        ln ⎝                                           ⎠
                                                                 case the sources inside the same H-cell may be aggregated
   2πr2                          2α2
                                                                 in a single point source.
                                                        (2)
                                                                      The calculation procedure for evaluation of the source
where is an auxiliary positive number that makes (2) usable
                                                                 contribution in one cell to the average SPLav over another
if Rr which gives
                                                                      A) Far enough cells (R≥3.3r).

                                                                              SPL av = L0 − 20 lg(r) − 8 − Ahous,1 (R)                   (6)
264 | Ziv and Solov’eva
B) Close but not adjacent cells (r < R < 3.3). expressions (2) and (3) for the source cells and speed up
Formulas (3) – (5) are utilized depending on sources’ the calculations using of appropriate 2D interpolation.
type and configuration. Thus, the contribution of the road Current method may underestimates results also due to
segment with non-zero width S and length D can be ob- ignoring the obstacle-free space around road stretches and
tained by numerical integration noise reflections from the facades of houses alongside the
road. It seems very reasonable to run full model in source
SPL av = L0 − 10 · lg(P(x, y, S, D)) (7) cells for grid points in close proximity to the roads using the
real configuration of built-up areas in the close proximity
where
to the roads. The final average value for the cell is derived
′
∫︁ /2 W
D ′
∫︁ /2 then as weighted mean. Calculation time thus increases but
1 seems not drastically, because the detailed estimates by
P(x, y, S, D) = −
2πS′ D′ full model are needed only for very limited parts of source
−D′ /2 −W ′ /2
(︁ )︁
(8) cells, whereas mutual contributions of other cells are still
ln 1 − ρ(x′ ,y1′ ,ξ ,η)2 computed on the coarse grid by the proposed here proce-
dξdη
100.1·AHous,1 (r·ρ(x′ ,y′ ,ξ ,η)) dure, which is very fast. An example outlined in the next
√︁
ρ x′ , y′ , ξ , η =
(︀ )︀ 2
(x′ − ξ ) + (y′ − η)
2 Section 2.3 shows that the combined algorithm improves
estimates significantly.
(x′ , y′ ) – coordinates of the center of receptor H-cell in trans-
formed coordinate system, L0 = 10·lg(W), W – sound inten-
sity level of the road segment, the apostrophes mean the 2.3 Test example
same as in (4) and (5).
C) Adjacent cells and source cell itself. Simple test example comprises 4 road segments and 112
Calculations are the same as in B), except (2) is used buildings in the area divided into six 500×500 m H-cells. A
instead of (3). sketch is shown in Figure 2. Buildings were mapped on to
A)-C) include function Ahous,1 , which in turn includes the auxiliary 10x10 m h-grid shown in grey. In accordance
Bi,j values calculated for the pairs of H-cells as described with the algorithm outlined in Section 2.2, we determined
in Section 2.1. building densities on the basis of h-grid, as described in
If a road segment is represented by h-points, then the Section 2.1. and calculated contributions of sources in A, B,
sum over these points corresponds to the integrals in (8). C, E cells to all cells A-F using formulas (7) and (8). Road
In case of multiple sources within the same cell, each is segments data were set typical for real streets with La,eq =72
considered separately, and the usual logarithmic summa- dBa (A, C) and 76 dBa (B, E) dBa at 7.5 m. We set α=1 in
tion follows. Note that the building densities Bij correspond (2) corresponding to the minimum distance in the Ecolog-
to the pairs of H-cells, so the road going across several H- Noise (E-N) software, which we used to compare our results
cells gets split into individual segments per each of these with.
H-cells, and the contributions of each segment to all H-cells
are evaluated separately.
As averaging terms in (6)-(8) do not depend on noise fre-
quency band, other factors affecting noise propagation can
be taken into consideration. For instance, one can account
for the attenuation due to absorption in the atmosphere, at-
tributing it to the distance between the centers of the cells,
and subtract it from L0 .
Strictly speaking, the term like
′ ′
100.1·AHous,1 (r·ρ(x ,y ,ξ ,η))
in (8) should have been included in (2) or (3) instead of (8).
However, in this case the explicit expression in (2) could not
have been derived, and computations would take more time.
As current algorithm leads to significant underestimation
of SPL only in case of source cell itself if it has high building Figure 2: Sketch of test example: blue – road segments, gold –
density, we consider the use of (8) suitable. Nevertheless buildings, grey – 10×10 m grid, black – 500×500 m grid, cells are
in the future, it would be preferable to use the corrected marked as A-F.Approximate noise maps as instrument for evaluation of the city environment quality | 265
Contributions of the sources in (A,B,C,E) cells to (A-E) h-grid and calculation of their densities took some time,
cells were evaluated by our model and E-N. In the latter, the but it was very fast as well.
averages were taken from the results over h-grid in every H-
cell. In addition to that, we introduced four auxiliary grids
around sources the each ±10 m from them and calculated
the mean values over them using E-N. Initial contributions
3 Example of the city area
(A to A),..., (E to E) have been corrected (weighted mean)
The next illustrative example is for a dense urban area of
by these additional average noise levels.
about 6×7 km with approximately 5000 buildings and 170
Table 1 shows the differences between the results ob-
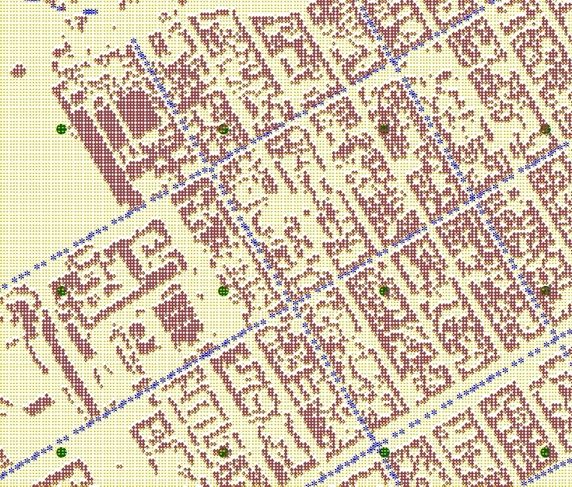
road segments. Digital map comprised all data in shp for-
tained by Ecolog-Noise and by current method. The values
mat and projection of objects on to the h-grid was done
in the last column correspond to averages in H-cells (rows
by Ecolog-Noise software. As a result, 42070 grid points
of the table). Each cell (x,y), x={A, B, C, D ,E ,F}, y={A,B,C,E},
corresponding to houses and 1673 to roads were obtained.
shows contribution of y H-cell to x H-cell. For the source
The fragment of the map is shown in Figure 3.
cells, average SPLs have been estimated both without cor-
rection and with it, hence two differences are shown for
such cells in Table 1. First one corresponds to uncorrected
estimates and the second one to corrected ones.
Table 1: The differences in dBa between E-N results and current
model results.
A B C E Sum
A 6.3, -1.2 6.7 8.4 -0.4 6.3, -1.1
B 7.6 6.7, 0.9 6.4 7.8 6.8,1.3
C 10.3 8.4 5.9, -2.0 -0.4 6.0, -1.7
D 3.3 1.8 -11.5 3.9 3.3
E -0.1 5.8 2.9 5.1, 0.6 5.1, 0.8
F -11.5 -2.1 3.6 5.2 4.1
There are several conclusions from this simple exam- Figure 3: The fragment of urban area with computational grids G
H
ple. The proposed method predicts background noise re- and Gh . Big green dots GH grid points; stars: blue – roads, brown –
sponding poorly to high noise values in points along roads. buildings, yellow Gh grid points.
Corresponding correction gives significantly better results.
This evident result simply followed from logarithmic averag-
ing. Another point worth mentioning is that the account for Cell-to-cell building densities for 69 H-cells were calcu-
building density with Ahous,1 assumes probably that houses lated in 13 minute. The densities vary from zero to 0.55 with
are distributed nearly randomly. If they congregate at some average value equals to 0.25. Final calculations of average
particular place across the noise band, they should rather SPL in H-cells took less than 1 minute. In this case we used
be interpreted as a barrier but not as a built-up area. In our (2), (3) as roads were represented by the sets of points. Un-
example, it is the case of A to F and C to D contributions fortunately, unlike in the previous example we could not
when the B-method (formulas (7) and (8)) overestimates compare these results with calculations by Ecolog-Noise as
E-N results whilst in general the B-method should rather it was not enough data for obstacles and sources to feed in
underestimate full models. However, this particular case the E-N program.
might be partly because the E-N program accounts for sin- Figure 4 shows the SPL dBA map in classed post form
gle reflections only. together with houses and roads.
The time of computing by Ecolog-Noise was about 30′ , We chose also a single cell marked by a large blue circle
and by current method - less than 30′′ (just 24 numerical in Figure 4 to compare the results of three methods: i) the
integrations), rather fast. The projection of obstacles on to current method, ii) the method described in our previous
work [24] and iii) the mixed one.266 | Ziv and Solov’eva
In (ii), we considered polygons connecting source and puted noise levels in neighboring points may be high even
receptor cells (like Ci,j in Section 2.1) referred to as “noise on a fine grid, the very idea of noise mapping as an ap-
bands”, but the grid step there was 25 m instead of 500 proximation of scalar field by smooth functions becomes
m. The nearest to the source (x1 ) shielding of this band by not very clear. Partly for this reason, we began to consider
houses and the farthest one (x2 ) were determined. If no the idea of estimating noise levels averaged within rather
shielding found, the direct noise was computed. Otherwise, large areas. The proposed methodology makes possible to
we computed screened noise using two barriers with the add an indicator of noise pollution to a comprehensive as-
average in the area building height placed at x1 and x2 . sessment of the state of urban environment. According to
our research, the suggested resolution for these estimates
agrees quite well with the subjective zoning of the noise in
the city.
The calculation procedure can be performed as one
and two level discretization each describes the processes
of different scale – urban background noise and noise due
to local sources in quite limited area. It should be noted
the flexibility of the method. We construct, in fact, the set
of source-cell multipliers. Hence the temporal variation of
the sound power of the sources, such as daily variations of
traffic, can be easily accounted for.
The background noise estimates can be useful even if
they are not very accurate. For instance, having such esti-
mates, one can reduce the number of considered sources
(by exclusion of insignificant ones) to save the computa-
tional time when computing noise levels locally with full
model.
Figure 4: Noise map in selected urban area as a classed post. Grey The advantage of the method is that it does not require
pixels show houses and black corresponds to roads. It is for the the detailed information about noise obstacles, and soft-
cell in blue circle three methods of estiamting of average SPL were ware for its implementation is not very complex. However,
applied. the more information is available the more features affect-
ing noise propagation can be included. We realize though
In current work, this approach was simplified by con- that the potential for such improvements is rather limited.
sidering noise bands between h-cells. In the iii) mixed As it is, the proposed methodology makes it possible to
method, we computed point-to-point noise propagation add an indicator of noise pollution in urban area to other
with Ahous,1 attenuation and building density taken from environmental characteristics, such as air pollution, thus
H-cell. In both cases (ii and iii), noise levels were deter- allowing more comprehensive evaluation of the state of ur-
mined in the h-cells external to houses and roads. It would ban environment. According to our research, the suggested
be mentioned that the ii) run took a lot of time in compari- resolution for these estimates agrees quite well with the
son with two others - about 40 minutes vs. about 1 minute. subjective zoning of the noise in the city.
Results for average SPL are as follows i) 61.3, ii) 59.9, iii) 59.1. Test results seem encouraging, so we hope that the
They are rather close, which partly confirms the sugges- proposed methodology can find the appropriate usage.
tion that the current algorithm gives average value without
accounting for high noise levels near the roads. Acknowledgement: The authors express their sincere grat-
itude to the developers of the Ecolog-Noise software, Com-
pany "Integral", www.integral.ru, Saint-Petersburg, Rus-
sian Federation for their support in this work and provided
4 Conclusions materials. The authors also express their deep gratitude
to Dr Irina Krotova for her valuable comments and help in
Noise pollution modelling and corresponding noise map- preparing the manuscript.
ping is challenging in accurate description of noise propa-
gation in surrounding space. Modelling results are highly Funding information: The authors state no funding in-
sensitive to 3D space geometry. As the difference in com- volved.Approximate noise maps as instrument for evaluation of the city environment quality | 267
Author contributions: All authors have accepted responsi- [12] Wei W, Van Renterghem T, De Coensel B, Botteldooren
bility for the entire content of this manuscript and approved D. Dynamic noise mapping: A map-based interpolation
between noise measurements with high temporal resolu-
its submission.
tion. Appl Acoust [Internet]. 2016;101:127–40. Available
from: https://www.sciencedirect.com/science/article/pii/S0
Conflict of interest: The authors state no conflict of inter- 003682X15002194.
est. [13] Tang UW, Wang ZS. Influences of urban forms on traflc-induced
noise and air pollution: Results from a modelling system. Environ
Model Softw [Internet]. 2007;22(12):1750–64. Available from:
https://www.sciencedirect.com/science/article/pii/S1364815
References 20700028X.
[14] Suárez E, Barros JL. Traflc noise mapping of the
[1] Bohatkiewicz J. Noise Control Plans in Cities - Selected Issues city of Santiago de Chile. Sci Total Environ [In-
and Necessary Changes in Approach to Measures and Methods ternet]. 2014;466–467:539–46. Available from:
of Protection. In: Transportation Research Procedia. 2016. http://dx.doi.org/10.1016/j.scitotenv.2013.07.013.
[2] Kim M, Chang SI, Seong JC, Holt JB, Park TH, Ko JH, et [15] Yilmaz G, Hocanli Y. Mapping of noise by using gis in Şanliurfa.
al. Road traflc noise: annoyance, sleep disturbance, and Environ Monit Assess. 2006;121(1–3):103–8.
public health implications. Am J Prev Med [Internet]. 2012 [16] Gulliver J, Morley D, Vienneau D, Fabbri F, Bell M, Good-
Oct [cited 2014 Nov 27];43(4):353–60. Available from: man P, et al. Development of an open-source road traflc
http://www.sciencedirect.com/science/article/pii/S07493797 noise model for exposure assessment. Environ Model Softw
12004448 [Internet]. 2015 Jan [cited 2015 Jan 12]; Available from:
[3] Tobías A, Recio A, Díaz J, Linares C. Health impact assessment http://www.sciencedirect.com/science/article/pii/S13648152
of traflc noise in Madrid (Spain). Environ Res. 2015;137:136–40. 1400379X.
Available from: http://dx.doi.org/10.1016/j.envres.2014.12.011 [17] Pamanikabud P, Tansatcha M. Geographical information
[4] Cohen S, Glass DC, Singer JE. Apartment noise, auditory dis- system for traflc noise analysis and forecasting with the
crimination, and reading ability in children. J Exp Soc Psychol. appearance of barriers. Environ Model Softw [Internet].
1973;9(5):407–22. 2003 Dec [cited 2015 Jan 14];18(10):959–73. Available from:
[5] Salomons E, Van Maercke D, Defrance J, De Roo F. The Har- http://www.sciencedirect.com/science/article/pii/S13648152
monoise sound propagation model. Acta Acust united with Acust. 03000975.
2011;97(1):62–74. [18] Cai M, Yao Y, Wang H. Urban Traflc Noise Maps under 3D Com-
[6] Kephalopoulos S, Paviotti M, Anfosso-Lédée F. (2012) Common plex Building Environments on a Supercomputer. J Adv Transp.
Noise Assessment Methods in Europe (CNOSSOS-EU). EUR 25379 2018;2018.
EN. Luxembourg (Luxembourg): Publications Oflce of the Euro- [19] Wei W, Botteldooren D, Renterghem T Van, Hornikx M, Forssén J,
pean Union. 2012. JRC72550 Salomons E, et al. Urban background noise mapping: The general
[7] Commission Directive 2015/996 establishing common noise as- model. Acta Acust united with Acust. 2014;100(6):1098–111.
sessment methods according to Directive 2002/49/EC of the [20] Hornikx M, Forssén J, Botteldooren D, van Renterghem T,
European Parliament and of the Council, 2016. Wei W, Ögren M, et al. Urban Background Noise Mapping:
[8] Manvell D, Ballarin Marcos L, Stapelfeldt H, Sanz R. SADMAM- The Multiple-Reflection Correction Term. Acta Acust united
Combining measurements and calculations to map noise in with Acust [Internet]. 2014;100(2):293–305. Available from:
Madrid. In: INTER-NOISE and NOISE-CON Congress and Confer- http://www.ingentaconnect.com/search/download?pub=info
ence Proceedings [Internet]. 2004. p. 1998–2005. Available from: bike://dav/aaua/2014/00000100/00000002/art00014&mime
http://www.bksv.it/doc/bn0150.pdf type=application/pdf.
[9] De Coensel B, Sun K, Wei W, Van Renterghem T, SINEAU M, Ribeiro [21] Ziv A. Discretization and Infographics in Regulatory Calculations
C, et al. Dynamic noise mapping based on fixed and mobile of Air Pollution. Proceedings of MGO. 2020; 599: 74–92. Russian.
sound measurements. In: EURONOISE 2015 [Internet]. MAAS- [22] Chiarini B, D’Agostino A, Marzano E, Regoli A. The percep-
TRICHT, France; 2015. p. 6p. Available from: https://hal.archives- tion of air pollution and noise in urban environments: A
ouvertes.fr/hal-01470525. subjective indicator across European countries. J Environ
[10] Zambon G, Cambiaghi M, Confalonieri C, Coppolino C, Eduardo Manage [Internet]. 2020;263(March):110272. Available from:
RH, Angelini F, et al. Uncertainty of noise mapping prediction https://doi.org/10.1016/j.jenvman.2020.110272.
related to Dynamap project. INTER-NOISE 2019 MADRID - 48th [23] Mitin I. Urban mental maps: history of the term and the diversity
Int Congr Exhib Noise Control Eng. 2019. of approaches. Urban Stud Pract [Internet]. 2017;2(3):64–79.
[11] Benocci R, Bellucci P, Peruzzi L, Bisceglie A, Angelini F, Con- Available from: https://doi.org/l 0.17323/usp23201764-79.
falonieri C, et al. Dynamic noise mapping in the suburban area [24] Ziv A, Solovieva E. Noise as part of the urban environment: the
of Rome (Italy). Environ - MDPI. 2019;6(7):1–17. possibility of simplified evaluation of its level. City in the mirror
of sciences. Saint-Petersburg; 2015: 68–74. Russian.You can also read