Analyst Presentation Q4 2021 - January 2022 - Amazon S3
←
→
Page content transcription
If your browser does not render page correctly, please read the page content below

Analyst Presentation Q4 2021

                                                    January 2022

1 | January 2022 | Analyst Presentation Q4 2021
Q4 2021 highlights

                                                                 Orders                                          Delivery orders                                                           GTV
                                                                 274m                                                       119m                                                     €7.3bn
                                                                     +14%                                                       +32%                                                       +17%

                                                  FY 2021 highlights

                                                                 Orders                                          Delivery orders                                                           GTV
                                                              1,086m                                                        474m                                                   €28.2bn
                                                                     +33%                                                       +69%                                                        +31%

                                                  Note: Unless stated otherwise, numbers throughout this presentation are reflecting the combined results of Grubhub, Just Eat and Takeaway.com from 1 January 2020

2 | January 2022 | Analyst Presentation Q4 2021
33% year-on-year Order growth in 2021…

                                                    +14%                       +33%

                                                           274                        1,086

                                                                 YoY                          YoY
                                              240
                                                           92    +6%                  374     +19%
                                                                         816
                                               86

                                                                         314
                                                           77    +17%                 296     +35%
                                               66
                                                                         219

                                                           73    +23%                 289     +52%
                                               59
                                                                         190

                                               29          32    +11%     93          128     +38%

                                           Q4 2020     Q4 2021          FY 2020   FY 2021

 3 | January 2022 | Analyst Presentation Q4 2021
…generating a Gross Transaction Value of €28.2 billion in 2021

                                                       +17%                              +31%
                                                       +13%1                             +31%1

                                                               7.3                               28.2

                                                                     YoY                                YoY
                                                 6.2
                                                               2.9   +11%         21.4           11.5   +17%

                                                 2.6
                                                                                   9.8

                                                               1.9   +20%                        7.2    +42%
                                                 1.6
                                                                                   5.0

                                                               1.7   +27%                        6.6    +47%
                                                 1.4                               4.5

                                                 0.6           0.7   +10%          2.1           2.8    +38%

                                              Q4 2020      Q4 2021               FY 2020     FY 2021

Adjusted EBITDA margin¹ for the full year of 2021 at the midpoint of the guided range of minus 1% and minus 1.5% of GTV
1. On a constant currency basis

   4 | January 2022 | Analyst Presentation Q4 2021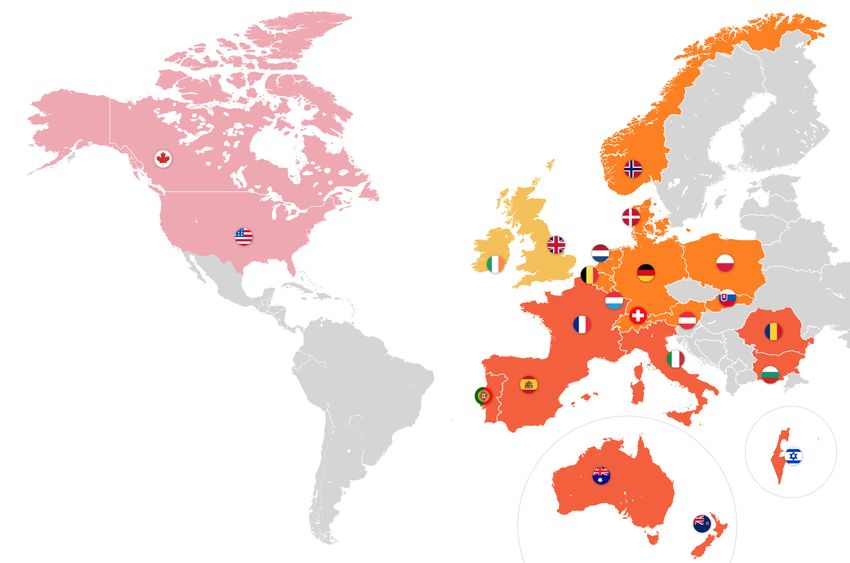
Achieved 2021 guidance for GTV and adjusted EBITDA margin incl. Grubhub

Total company targets                                             Actuals

                                €28 to 30bn GTV (incl. Grubhub)   €28.2bn GTV (incl. Grubhub)

                                -1% to -1.5% Adjusted EBITDA
                                                                  At midpoint of -1% to -1.5% range (incl. Grubhub)
                                as % of GTV (incl. Grubhub)

Excl. Grubhub target

                                >45% order growth y-o-y           >40% order growth y-o-y
                                (excl. Grubhub)                   (excl. Grubhub)

 5 | January 2022 | Analyst Presentation Q4 2021
We see a big opportunity in convenience grocery…
Massive market opportunity
Enhances consumer proposition
We will invest in building
a convenience proposition –
Drives network effects this is already included in our
overall Adjusted EBITDA
guidance
Improved fleet utilisation
(higher density and broader peaks)
Incremental profit opportunity
6 | January 2022 | Analyst Presentation Q4 2021…and we have already made good progress in building our proposition
13,000+
stores
globally
7 | January 2022 | Analyst Presentation Q4 2021New reporting segments improve visibility and understanding of our business
Our new segmentation
UK & Ireland
• Grouping of countries with similar profitability, Northern Europe
characteristics, market structure and North America
geographic location
• Each region of significant size
(>€500m annual revenue)
• Aligns with our organisation structure
• Enhances transparency and
understanding of our markets
Southern Europe
& ANZ
8 | January 2022 | Analyst Presentation Q4 2021Segment highlights
• UK&I fastest growing segment while significantly improving adjusted EBITDA; while we continue to invest heavily, we
expect to further improve profitability in 2022
• In the US, increasing restaurant selection, expansion of GH+ users and launched partnership with Instacart and 7-
Eleven; we remain in discussion with several potential strategic partners to strengthen its US position
• Germany adding 6.9 million incremental orders in Q4 2021 (and 47.5 million incremental orders in FY 2021). This
increased scale led to ongoing profitability improvements.
¹ The Grubhub business was consolidated from 15 June 2021, and the Just Eat business was consolidated from 15 April 2020. These figures are presented as if the combination was completed on 1 January 2020 to provide comparable information for the full year period. These
numbers are unaudited.
9 | January 2022 | Analyst Presentation Q4 2021We deploy the appropriate Delivery model to ensure we adhere to local laws
Assessment of current legal landscape Just Eat Takeaway.com Delivery model
Europe Europe
Americas Americas
Australia & Australia &
New Zealand New Zealand
Israel Israel
Contractors allowed1 Contractor
Use of contractors being challenged2 Both
Contractors not acceptable3 Employed
Source: Company assessment
Note 1: Use of contractors in accordance with laws and regulations.
Note 2: Use of contractors under pressure and/or challenging legal landscape.
Note 3: Use of contractors socially not accepted and/or strong private or public enforcement against its use.
10 | January 2022 | Analyst Presentation Q4 2021Our strategy delivers sustainable growth and profits
Short-Term Long-Term
We will grow GTV in the We will add more than €30bn in
Growth mid-teens in 2022 annual GTV over the next 5 years
2021 will be the peak year of losses, with We will achieve a long-term group
Profitability 2022 group Adj. EBITDA/GTV margin Adj. EBITDA margin in excess of
improving to the range of -0.6% to -0.8% 5% as a percent of GTV
We prioritise long-term growth over short-term profits
11 | January 2022 | Analyst Presentation Q4 2021Q&A 12 | January 2022 | Analyst Presentation Q4 2021
Legal disclaimer

Forward Looking Statements
This presentation contains “forward-looking statements” regarding Just Eat Takeaway.com N.V. (“Just Eat Takeaway.com”). Statements included in this presentation that are not historical facts (including any statements concerning investment
objectives, other plans and objectives of management for future operations or economic performance, or assumptions or forecasts related thereto) are, or may be deemed to be, forward-looking statements, including “forward-looking statements”
made within the meaning of the U.S. Private Securities Litigation Reform Act of 1995. These forward-looking statements may be identified by the use of forward-looking terminology, including the terms “believes”, “estimates”, “plans”, “projects”,
“anticipates”, “expects”, “intends”, “may”, “will” or “should” or, in each case, their negative or other variations or comparable terminology, or by discussions of strategy, plans, objectives, goals, future events or intentions. Forward-looking
statements may and often do differ materially from actual results. Any forward-looking statements reflect the Company’s current view with respect to future events and are subject to risks relating to future events and other risks, uncertainties and
assumptions relating to the Company’s business, results of operations, financial position, liquidity, prospects, growth or strategies. Among the key factors that could cause actual results to differ materially from those projected in the forward-looking
statements are risks from or uncertainties related to the following: innovation, competition, brand & reputation, acquisitions, global strategic projects, technology reliability & availability, social change, legislation & regulation, data security & privacy,
financial reporting, people, operational complexity and integration & transformation. Additional information concerning key factors that could cause actual results to differ materially from those projected in the forward-looking statements can be
found in the Company’s filings with the U.S. Securities and Exchange Commission (“SEC”), including the Company’s registration statement on Form F-4 (Registration Statement No. 333-255540), which was declared effective by the SEC on May
12, 2021, and Current Reports on Form 6-K, which may be obtained free of charge at the SEC’s website, http://www.sec.gov, and the Company’s Annual Reports, which may be obtained free of charge from the Company’s corporate website,
https://justeattakeaway.com.
Past performance is no guide to future performance and persons needing advice should consult an independent financial adviser. Forward-looking statements reflect knowledge and information available at, and speak only as of, the date they are
made, and the Company expressly disclaims any obligation or undertaking to update, review or revise any forward-looking statement contained in this announcement whether as a result of new information, future developments or otherwise.
Readers are cautioned not to place undue reliance on such forward-looking statements.

No Offer or Solicitation
This presentation shall not constitute an offer to sell or the solicitation of an offer to sell or the solicitation of an offer to buy any securities, nor shall there be any sale of securities in any jurisdiction in which such offer, solicitation or sale would be
unlawful prior to registration or qualification under the securities laws of any such jurisdiction.

Non-GAAP Financial Measures and Alternative Performance Measures
This presentation includes certain non-GAAP financial measures as defined by SEC rules and alternative performance measures as defined by European rules. Just Eat Takeaway.com uses these non-GAAP financial measures and alternative
performance measures, respectively, as key performance measures because it believes they facilitate operating performance comparisons from period to period by excluding potential differences primarily caused by variations in capital structures,
tax positions, the impact of acquisitions and restructuring, the impact of depreciation and amortization expense on its fixed assets and the impact of stock-based compensation expense. These non-GAAP financial measures and alternative
performance measures are not measurements of Just Eat Takeaway's financial performance under IFRS and should not be considered as an alternative to performance measures derived in accordance with IFRS and should be read in conjunction
with Just Eat Takeaway.com's financial statements prepared in accordance with IFRS. Just Eat Takeaway.com has provided a reconciliation of those measures to the most directly comparable IFRS measures in Just Eat Takeaway.com's 2020
Annual Report.

 13 | January 2022 | Analyst Presentation Q4 2021
You can also read