Analysis of Historical Non-Destructive Evaluation Probability of Detection Data for Railroad Tank Cars
←
→
Page content transcription
If your browser does not render page correctly, please read the page content below
U.S. Department
of Transportation                               Office of Research,
Federal Railroad                        Development and Technology
Administration                                Washington , DC 20590

   Analysis of Historical Non-Destructive Evaluation
  Probability of Detection Data for Railroad Tank Cars

DOT/FRA/ORD-21/14                           Final Report | April 2021

NOTICE
'01is document is disseminated under the sponsorship of the
Department of Transportation in the interest of information
exchange. The United States Govermnent assumes no liability for
its contents or use thereof.          Any opinions, findings and
conclusions, or recommendations expressed in this material do not
necessarily reflect the views or policies of the United States
Government, nor does mention of trade names, commercial
products, or organizations imply endorsement by the United States
Government. The United States Govenunent assumes no liability
for the content or use of the material contained in this document.

                             NOTICE
The United States Government does not endorse products or
manufacturers. Trade or manufacturers' nan,es appear herein
solely because they are considered essential to the objective of this
repo1t.
Form Approved
                               REPORT DOCUMENTATION PAGE                                                                                   OMB No. 0704-0188

The public reporting burden for this collection of information is estimated to average 1 hour per response, including the time for reviewing instructions, searching existing data
sources, gathering and maintaining the data needed, and completing and reviewing the collection of information. Send comments regarding this burden estimate or any other
aspect of this collection of information, including suggestions for reducing the burden, to Department of Defense, Washington Headquarters Services, Directorate for Information
Operations and Reports (0704-0188), 1215 Jefferson Davis Highway, Suite 1204, Arlington, VA 22202-4302. Respondents should be aware that notwithstanding any other provision
of law, no person shall be subject to any penalty for failing to comply with a collection of information if it does not display a currently valid OMB control number.
PLEASE DO NOT RETURN YOUR FORM TO THE ABOVE ADDRESS.
1. REPORT DATE (DD-MM-YYYY                    2. REPORT TYPE                                                                 3. DATES COVERED (From - To)
         April 2021                               Technical Report                                                              1996 to 2016
4. TITLE AND SUBTITLE                                                                                            5a. CONTRACT NUMBER
 Analysis of Historical Non-Destructive Evaluation Probability of Detection Data for                              DTFR53-11-D00008L
 Railroad Tank Cars
                                                                                                                 5b. GRANT NUMBER
                                                                                                                 5c. PROGRAM ELEMENT NUMBER

6. AUTHOR(S)                                                                                                     5d. PROJECT NUMBER
 Anish Poudel – 000-0002-5811-4284
 Silvia Galván Núñez – 0000-0001-7943-8678                                                                       5e. TASK NUMBER
 Brian Lindeman – 0000-0003-3903-266X                                                                             Task Order F000067
                                                                                                                 5f. WORK UNIT NUMBER

7. PERFORMING ORGANIZATION NAME(S) AND ADDRESS(ES)                                                                        8. PERFORMING ORGANIZATION
 Transportation Technology Center, Inc.                                                                                      REPORT NUMBER
 A wholly owned subsidiary of Association of American Railroads
 55500 DOT Road
 Pueblo, CO 81001-0130
9. SPONSORING/MONITORING AGENCY NAME(S) AND ADDRESS(ES)                                                                   10. SPONSOR/MONITOR'S ACRONYM(S)
 U.S. Department of Transportation
 Federal Railroad Administration
 Office of Railroad Policy and Development                                                                                11. SPONSOR/MONITOR'S REPORT
 Office of Research, Development and Technology                                                                               NUMBER(S)
 Washington, DC 20590                                                                                                        DOT/FRA/ORD-21/14
12. DISTRIBUTION/AVAILABILITY STATEMENT
 This document is available to the public through the FRA website.
13. SUPPLEMENTARY NOTES
 COR: Francisco González, III
14. ABSTRACT
 From 1996 to 2016, Transportation Technology Center, Inc. (TTCI) analyzed historical probability of detection (POD) data for the
 fusion welded tank car butt welds (BW) and fillet welds (FW) inspection using Code of Federal Regulation (CFR)-approved
 nondestructive evaluation (NDE) methods. The research team analyzed a total of 197 POD datasets (i.e., for both the BW and FW)
 using 3 different statistical approaches: traditional statistics, logistic regression based maximum likelihood estimate approach, and
 the National Aeronautics and Space Administration (NASA) design of experiment POD (DOEPOD). The Federal Railroad
 Administration (FRA) sponsored this work and the railroad tank car industry participated by evaluating the capabilities of currently
 CFR-approved NDE methods on the railroad tank cars welds.
15. SUBJECT TERMS
Nondestructive evaluation/testing, NDE, nondestructive testing, NDT, visual testing, VT, liquid penetrant testing, PT, magnetic particle
testing, MT, ultrasonic testing, UT, phased array ultrasonic testing, PAUT, probability of detection, POD, railroad tank car, butt weld,
BW, fillet weld, FW, weld defect, hazardous materials, rolling stock
16. SECURITY CLASSIFICATION OF:                              17. LIMITATION OF          18. NUMBER         19a. NAME OF RESPONSIBLE PERSON
a. REPORT          b. ABSTRACT           c. THIS PAGE
                                                                 ABSTRACT                   OF             Anish Poudel, Ph.D., Principal Investigator I (NDT)
                                                                                            PAGES          19b. TELEPHONE NUMBER (Include area code)
Unclassified                              Unclassified                                         54          719-584-0553
                     Unclassified
                                                                                                                                             Standard Form 298 (Rev. 8/98)
                                                                                                                                             Prescribed by ANSI Std. Z39.18
METRIC/ENGLISH CONVERSION FACTORS
            ENGLISH TO METRIC                                                                       METRIC TO ENGLISH
                LENGTH (APPROXIMATE)                                                                    LENGTH (APPROXIMATE)
                  1 inch (in)        =    2.5 centimeters (cm)                                1 millimeter (mm) = 0.04 inch (in)
                   1 foot (ft)       =    30 centimeters (cm)                                 1 centimeter (cm) = 0.4 inch (in)
                 1 yard (yd)         =    0.9 meter (m)                                                1 meter (m) = 3.3 feet (ft)
                 1 mile (mi)         =    1.6 kilometers (km)                                          1 meter (m) = 1.1 yards (yd)
                                                                                                  1 kilometer (km) = 0.6 mile (mi)

                   AREA (APPROXIMATE)                                                                       AREA (APPROXIMATE)
  1 square inch (sq in, in2)         =    6.5 square centimeters (cm2)                      1 square centimeter = 0.16 square inch (sq in, in2)
                                                                                                          (cm2)
   1 square foot (sq ft, ft2)        =    0.09 square meter (m2)                            1 square meter (m2) = 1.2 square yards (sq yd, yd2)
 1 square yard (sq yd, yd ) 2
                                     =    0.8 square meter (m )      2
                                                                                        1 square kilometer (km2) = 0.4 square mile (sq mi, mi2)
 1 square mile (sq mi, mi2)          =    2.6 square kilometers (km2)                     10,000 square meters = 1 hectare (ha) = 2.5 acres
                                                                                                          (m2)
  1 acre = 0.4 hectare (he)          =    4,000 square meters (m2)

         MASS - WEIGHT (APPROXIMATE)                                                              MASS - WEIGHT (APPROXIMATE)
               1 ounce (oz)          =    28 grams (gm)                                                1 gram (gm) = 0.036 ounce (oz)
                1 pound (lb)         =    0.45 kilogram (kg)                                       1 kilogram (kg) = 2.2 pounds (lb)
1 short ton = 2,000 pounds           =    0.9 tonne (t)                                                 1 tonne (t) = 1,000 kilograms (kg)
                       (lb)
                                                                                                                         = 1.1 short tons

                VOLUME (APPROXIMATE)                                                                    VOLUME (APPROXIMATE)
           1 teaspoon (tsp)          =    5 milliliters (ml)                                       1 milliliter (ml) = 0.03 fluid ounce (fl oz)
       1 tablespoon (tbsp)           =    15 milliliters (ml)                                               1 liter (l) = 2.1 pints (pt)
       1 fluid ounce (fl oz)         =    30 milliliters (ml)                                               1 liter (l) = 1.06 quarts (qt)
                   1 cup (c)         =    0.24 liter (l)                                                    1 liter (l) = 0.26 gallon (gal)
                  1 pint (pt)        =    0.47 liter (l)
                 1 quart (qt)        =    0.96 liter (l)
              1 gallon (gal)         =    3.8 liters (l)
     1 cubic foot (cu ft, ft3)       =    0.03 cubic meter (m3)                               1 cubic meter (m3) = 36 cubic feet (cu ft, ft3)
  1 cubic yard (cu yd, yd3)          =    0.76 cubic meter (m3)                               1 cubic meter (m3) = 1.3 cubic yards (cu yd, yd3)

               TEMPERATURE (EXACT)                                                                     TEMPERATURE (EXACT)
                   [(x-32)(5/9)] °F = y °C                                                         [(9/5) y + 32] °C = x °F

                    QUICK INCH - CENTIMETER LENGTH CONVERSION
                      0                         1                        2                         3                         4                     5
         Inches
    Centimeters 0                1          2        3          4        5          6         7         8          9         10        11     12       13

       QUICK FAHRENHEIT - CELSIUS TEMPERATURE CONVERSIO
      °F -40° -22°        -4°            14°        32°        50°       68°        86°        104°         122°       140° 158° 176° 194° 212°

       °C -40° -30°       -20°           -10°       0°     10°           20°        30°        40°          50°        60°       70°   80°   90° 100°

    For more exact and or other conversion factors, see NIST Miscellaneous Publication 286, Units of Weights and
    Measures. Price $2.50 SD Catalog No. C13 10286                                                              Updated 6/17/98

                                                                               ii
Acknowledgements

The authors would like to thank industry participants who supported this work. This research
would not have been possible without the support and dedication of these individuals. Special
thanks to Mr. Ward Rummel for his input and guidance during the early probability of detection
(POD) development phase of this research. Mr. Rummel’s expertise was invaluable to this
research. Also, authors would like to thank Dr. Edward Generazio, National Aeronautics and
Space Administration (NASA) nondestructive evaluation (NDE) program manager (retired) for
his support on the design of experiment POD (DOEPOD) analysis.

                                              iii
Contents

Executive Summary ........................................................................................................................ 1
1.               Introduction ................................................................................................................. 2
     1.1         Background ................................................................................................................. 2
     1.2         Objectives .................................................................................................................... 3
     1.3         Overall Approach ........................................................................................................ 3
     1.4         Scope ........................................................................................................................... 4
     1.5         Organization of the Report .......................................................................................... 4
2.               Research Methodology ................................................................................................ 5
     2.1         Materials and Test Specimens ..................................................................................... 5
     2.2         NDE Methods .............................................................................................................. 8
     2.3         NDE POD Data Collection........................................................................................ 10
     2.4         False Positive Indications .......................................................................................... 12
3.               Statistical Data Analysis Approach ........................................................................... 13
     3.1         POD Background ...................................................................................................... 13
     3.2         DOEPOD ................................................................................................................... 16
4.               POD Results and Analysis......................................................................................... 19
     4.1         Traditional Statistics .................................................................................................. 19
     4.2         LOGIT/MLE ............................................................................................................. 22
     4.3         DOEPOD ................................................................................................................... 26
5.               Conclusions ............................................................................................................... 40
6.               References ................................................................................................................. 42
7.               Appendix ................................................................................................................... 44
Abbreviations and Acronyms ....................................................................................................... 45

                                                                       iv
Illustrations

Figure 1. Tank Car BW POD Test Panels ...................................................................................... 5
Figure 2. Tank Car FW POD Test Panels ....................................................................................... 6
Figure 3. Contrast MT Revealing Toe Cracking in Welds; (a) BW, (b) FW ................................. 6
Figure 4. Distribution of Cracks for BW ........................................................................................ 7
Figure 5. Distribution of Cracks for FW (dimension in inch) ........................................................ 7
Figure 6. Tank Car Master Gauge Test Panels ............................................................................... 8
Figure 7. Normal Distribution Showing 1st and 10th Percentile Distribution for Computing T99
    and T90 Values....................................................................................................................... 15
Figure 8. Median POH Summary for the FW ............................................................................... 21
Figure 9. Median POH Summary for the BW .............................................................................. 22
Figure 10. FW Median Summary Plot for Mean MLE POD ........................................................ 23
Figure 11. FW Median Summary Plot for Mean MLE POD with 95 percent LCL ..................... 24
Figure 12. BW Median Summary Plot for Mean MLE POD ....................................................... 24
Figure 13. BW Median Summary Plot for Mean MLE POD with 95 Percent LCL..................... 25
Figure 14. Examples of MLE Convergence and Non-convergence ............................................. 26
Figure 15. CASE 1 Example of DOEPOD Analysis for Operator 53 (MT with contrast) ........... 29
Figure 16. CASE 1# Example of DOEPOD Analysis for Operator 32 (MT with contrast) ......... 30
Figure 17. CASE 1* Example of DOEPOD Analysis for Operator 14 (MT with contrast) ......... 31
Figure 18. CASE 2 Example of DOEPOD Analysis for Operator 12 (MT with contrast) ........... 32
Figure 19. CASE 4 Example of DOEPOD Analysis for Operator 26 (MT with contrast) ........... 33
Figure 20. CASE 6 Example of DOEPOD Analysis for Operator 48 (MT with contrast) ........... 34
Figure 21. CASE 7 Example of DOEPOD Analysis for Operator 19 (MT with contrast) ........... 35
Figure 22. DOEPOD Results for FW Using PT – Operator 58 .................................................... 37
Figure 23. Summary Plot Median POD – FW .............................................................................. 38
Figure 24. Summary Plot Median LCL at 95 Percent POD – FW ............................................... 38
Figure 25. Summary Plot Median POD – BW ............................................................................. 39
Figure 26. Summary Plot Median LCL at 95 Percent POD – BW ............................................... 39

                                                                     v
Tables

Table 1. Number of Operator Participants for BW Panels Using Different NDE Methods ......... 10
Table 2. Number of Operator Participants for FW Panels Using Different NDE Methods ......... 11
Table 3. Summary of all Cases and Actions in DOEPOD (Generazio, E. R., 2011) ................... 18
Table 4. Median POH Summary for the FW ................................................................................ 20
Table 5. Median POH Summary for the BW................................................................................ 22
Table 6. Comprehensive DOEPOD Summary of all Cases and Recommendation ...................... 27
Table 7. Summary of DOEPOD Cases for FW ............................................................................ 28
Table 8. Summary of DOEPOD Cases for BW ............................................................................ 28
Table 9. Summary Results for DOEPOD and MLE Methods for FW ......................................... 36
Table 10. Summary Results for DOEPOD and MLE Methods for BW ....................................... 36

                                                           vi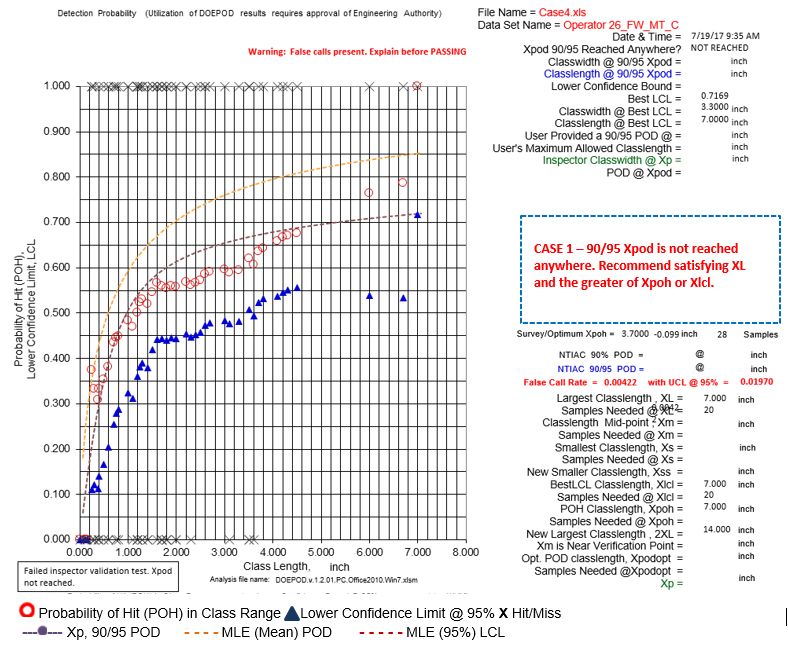
Executive Summary

The Federal Railroad Administration (FRA) sponsored Transportation Technology Center, Inc.
(TTCI) and accepted participation from the North American railroad tank car industry to conduct
statistical assessments using data from 1996 to 2016. An evaluation took place to test the
capabilities of Code of Federal Regulations’ (CFR)-approved nondestructive evaluation (NDE)
methods commonly used on the fusion welded railroad tank cars butt welds (BW) and fillet
welds (FW). For this, TTCI fabricated and provided tank car panel test specimens with defects
that were cut out from retired railroad tank cars. Defects in the BW and FW test panels were
artificially created under cyclic loading conditions to directly imitate typical fatigue defects
(cracks) found in tank car welds in revenue service.
Industry participation in this evaluation process consisted of 70 NDE operators (ASNT SNT-TC-
1A certified Level I – Level III) from different companies that typically apply different NDE
methods to inspect tank car FW and BW in revenue service, manufacturing, and repair
environment. During the inspection process, operators used their own NDE inspection
procedures, equipment, and inspection materials as they would in their own work in their normal
work environment. The research team also briefed participants on the background, purpose, and
the methodology of data collection and analysis. Finally, researchers gave each operator an
incognito operator number during the testing, and the statistical data and graphs in this report
reflect those numbers.
This report summarizes NDE results and the analysis of the probability of detection (POD) test
results for all operators that participated in this study from 1996 to 2016. The POD curves
included in this report provide a quantitative measure of the effectiveness of NDE methods,
which provide an opportunity for a fleet owner to evaluate the need to use one method over
another given the nature (criticality) of the area under observation, and the desired sensitivity.
Results obtained also provide a baseline for each method so that changes to NDE variables
become measurable by performing another study of the capabilities of the method and observing
the resulting change.

                                                1
1. Introduction

Transportation Technology Center, Inc. (TTCI), under the sponsorship of the Federal Railroad
Administration (FRA) and with the support of the tank car industry, recently concluded studies
to analyze the capabilities of current Code of Federal Regulations’ (CFR)-approved
nondestructive evaluation (NDE) methods and procedures to evaluate butt welds (BW) and fillet
welds (FW) in railroad tank cars. For this, TTCI provided tank car panel test specimens with
defects as well as provided supervision during NDE tests.
This report covers a comprehensive analysis of data collected during quantification of the CFR-
approved NDE methods using different statistical metrics. In summary, the results indicate both
the success and difficulties in applying some of the NDE methods to reliably detect and
characterize fatigue cracks in the railroad tank car BW and FW. Data presented in this report
also reflects operator and process variability in the application of the various inspection methods.
The capability of any given NDE method or technique is specific to variables related to flaw
characteristics such as size, orientation, and state of stress (compression or tension). The test
object, inspection equipment, calibration, written procedure and related processes, acceptance
criteria, human factors, and environmental conditions are all variables that affect NDE
capability.
Results obtained from this research demonstrate that the CFR-approved NDE methods were not
capable of achieving or approaching a 90-percent probability of detection (POD) with 95-percent
confidence (90/95 POD) for fatigue cracks in the BW test panels, for the operators that
participated in this research. Evaluation of the FW data showed mixed results, but only the
magnetic particle testing (MT) method reached 90/95 POD. Also, excessive false calls were
observed in both BW and FW inspection results. These results indicate the variability in NDE
tests and calibration procedures, operator variance, and the influence of human factors in the
application of the NDE inspection processes.

1.1   Background
The U.S. Department of Transportation (DOT) no longer considers the hydrostatic pressure test
as an optimum way to qualify fusion welded tank cars for continued service. The main reason
for this is due to the lack of ability of this test in identifying and characterizing fatigue damages
in the tank cars resulting from in-service loadings, stress risers, and weld related defects (Garcia,
G., 2002) (Garcia, G., Welander, L., Rummel, W. D., & Gonzalez, F., 2016) (Garcia, G.,
Rummel, W. D., & Gonzalez, F., 2016). Rulemaking issued by DOT revises the hazardous
materials regulations (HMRs) to replace the hydrostatic pressure test with appropriate NDE
methods to evaluate fusion welded tank cars. This rule change is contained in Title 49 CFR
Section 180.509 (Code of Federal Regulations, 2012). Also, 49 CFR § 179.7 requires all tank
car facilities to have a Quality Assurance Program (QAP), which is approved by the Association
of American Railroads (AAR) and in compliance with AAR specifications for tank cars (Code of
Federal Regulations, 2003) (Association of American Railroads, 2014). This rulemaking
includes procedures for quantitatively evaluating inspection and test procedures, including an
inspection of the accessibility of the area, and the sensitivity of the CFR-approved NDE
methods. The changes in these regulations adopted the NDE methods for consistently,
repetitively, and quantitatively detecting and characterizing internal defects and/or anomalies in

                                                  2
the railroad tank car welds. The CFR currently authorizes the following NDE methods for tank
car structural integrity inspections:
• Visual testing (VT)
• Liquid penetrant testing (PT)
• Magnetic particle testing (MT)
• Ultrasonic testing (UT)
• Radiographic Testing (RT)
• Acoustic Emissions (AE) (i.e., requires a special waiver from FRA)
This report summarizes the results of the 1996 to 2016 POD evaluations consisting of the CFR
approved NDE methods and procedures used by industry personnel.
1.2 Objectives
The major objectives of this research are:
• To evaluate and quantify the capabilities of NDE methods authorized under 49 CFR §
180.509 for use in the qualification of railroad tank cars.
• To develop a quantitative POD approach to evaluate NDE techniques and increase the
reliability of railroad tank car structural integrity inspections.
• To provide direction and insight into the current capabilities of the industry when using
the allowed NDE methods.
1.3 Overall Approach
TTCI provided tank car panel test specimens and cut them out from retired railroad tank cars for
the POD evaluations. Fatigue cracks were artificially simulated (under cyclic bending loading
conditions) at the toe of the butt welds and at the longitudinal termination of the fillet welds in
the cut-out sections of tank car panels. Cracks ranged from 0.15 inch to 3.50 inch for the butt
weld panels and 0.10 inch to 4.50 inch for the fillet weld panels. A variety of cracks from
smallest to largest sizes provided a range of inspection opportunities that were representative of
cracked components from service.
Industry participation for the POD evaluations consisted of several NDE operators (ASNT SNT-
TC-1A certified Level I – Level III) from different companies that usually apply different NDE
methods to inspect tank car BW and FW in revenue service, manufacturing, and repair
environments. During the inspection process, operators used their own NDE inspection
procedures, equipment, and inspection materials as they would do in their normal work
environment. Also, the operators briefed the participants on the background, purpose, and the
methodology of data collection and analysis. Finally, each operator received an incognito
operator number during the testing, and the statistical data and graphs presented in this report
reflect those numbers.
The process implemented during tank car NDE POD evaluations also required each operator to
inspect and size the EDM notches and fatigue cracks in the master gauge test panels before, at
intervals during, and after completing the inspection of the larger tank car test panels. This was
3specifically done to aid the operators involved in POD evaluations to reinforce their familiarity
with flaw responses from the test panels. Also, this served to ensure repeatability and
reproducibility of the test process involved.
Researchers recorded the inspection results for the larger (blind) tank car test panels as hit or
miss data for statistical analysis. For all BW inspections, NDE operators manually wrote the
flaw size from start to end and location of the crack identified on a magnetic tape located from
one end of the BW to the other end on each panel. A TTCI employee then measured and
recorded the operator’s response from the magnetic strips onto the data collection sheet.
Subsequently, researchers entered all data results into the POD data template for further
statistical analysis. Similarly, for all FW inspections, operators verbally identified the location of
a crack and estimated its size, and a TTCI employee recorded the operator’s response onto the
data collection sheet. Subsequently, researchers entered all data results into the POD data
template for further POD analysis.
1.4 Scope
TTCI conducted studies to evaluate a variety of CFR-approved NDE methods. The main goal of
this study was to summarize prior work, understand the capabilities and limitation of currently
approved CFR NDE methods and help the industry to achieve higher reliability of railroad tank
car structural integrity inspections. FRA documented previous work in research reports (Garcia,
G., 2002) (Garcia, G., Rummel, W. D., & Gonzalez, F., 2016) (Garcia, G., Welander, L.,
Rummel, W. D., & Gonzalez, F., 2016) (Archuleta, M., Poudel, A., Rummel, W. D., &
Gonzalez, F., 2016). Previous work included manufacture and validation of physical tank car
test specimens that are representative of components inspected by the industry as well as the
results obtained from the prior POD studies. The use of these test specimens were to baseline
industry detection capabilities. This report provides a comprehensive assessment of industry
NDE inspector performance capabilities in detecting and characterizing fatigue cracks in the
railroad tank car BW and FW using POD metrics.
1.5 Organization of the Report
This report presents the research findings in a progressive order. The next three sections present
the results of the research methodology. Section 2 describes the research and test methodology
implemented for this study. Section 3 provides insight into the consideration of background
information on different statistical data analysis approaches for the analysis of historical NDE
POD data obtained for the tank car BW and FW panels. Section 4 presents POD results obtained
using different statistical data analysis approaches. Finally, Section 5 summarizes the work
performed and provides recommendations for further work. The appendix lists all the data and
detailed analysis results for the BW and FW panels.
42. Research Methodology
This section describes the research and test methodology implemented for this study.
2.1 Materials and Test Specimens
TTCI established a defect library containing sample artifacts, such as railroad tank cars and
sections of railroad tank cars. Samples included tank cars donated by the tank car industry and
manufactured artifacts developed at the FRA’s Transportation Technology Center (TTC) in
Pueblo, CO. Manufactured artifacts consisted of test panels used for POD study, along with
master gauges developed for inspection sensitivity verification. The combination of specimens
contains discontinuities developed in revenue service as well as manufactured flaws simulating
locations and types of discontinuities expected in revenue service.
2.1.1 Tank Car Defect Library
TTCI developed realistic tank car panel test specimens that were cut from retired railroad tank
cars (DOT 111A) for the POD evaluations. Tank car test panels are representative of ASTM
A515 Grade 70 Steel material. Figure 1 and Figure 2 show a POD test setup for the tank car BW
and FW test panels.
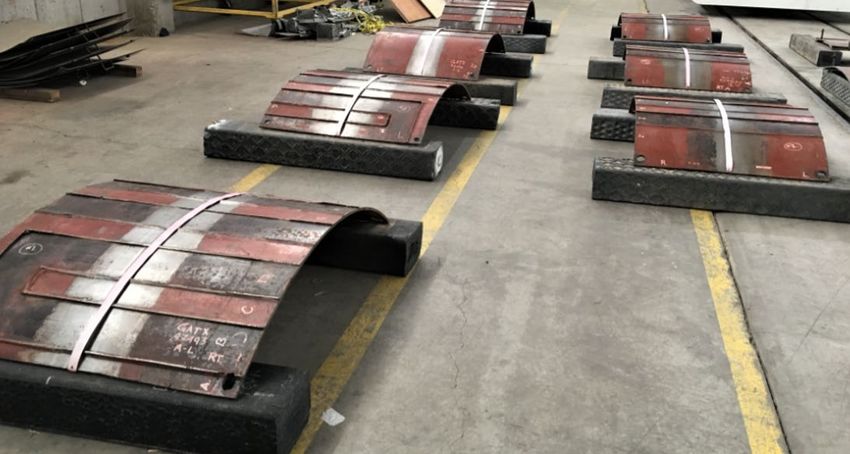
Figure 1. Tank Car BW POD Test Panels
5Figure 2. Tank Car FW POD Test Panels
For this test, researchers artificially initiated fatigue cracks (some were tightly spaced closed
fatigue cracks) at the toe of the BW and at the longitudinal termination of the FW in the cutout
sections of tank car panels as shown in Figure 3.
(a) (b)
Figure 3. Contrast MT Revealing Toe Cracking in Welds; (a) BW, (b) FW
Details on the tank car defect panel preparation can be found in the previous work conducted by
Garcia et al. (Garcia, G., 2002) (Garcia, G., Rummel, W. D., & Gonzalez, F., 2016) (Garcia, G.,
Welander, L., Rummel, W. D., & Gonzalez, F., 2016). Development of the defect library
provided the tank car industry with resources such as those established in the aerospace and
nuclear industries. It offers the industry a facility to perform comprehensive, independent, and
quantitative evaluations of existing approved NDE methods and test procedures, new and
enhanced inspection, maintenance, repair techniques, and for operator training.
Figure 4 and Figure 5 show the distributions of the frequency of cracks (fatigue cracks) in the
BW and FW tank car panels used in this study. The figures show that a right-skewed distribution
describes the data, where smaller cracks had higher frequency than bigger cracks. It is called a
6right-skewed distribution because the location of the tail is on the right side. The selection of
measure of central tendency (e.g., mean, median, and mode) for a skewed distribution might
differ from a symmetric distribution. For a symmetrical distribution, the mean, median, and
mode values lie on the same location. On the other hand, for a skewed distribution, the mode
might not be a good representative because the location can be close to the left or right of the
distribution. The mean value might be located at a place that is not the “center” of the
distribution, although it might be close enough in some cases. Finally, the median value is a
value that contains 50 percent of the data (50th percentile) and it is not susceptible to the
skewness or outliers in the data (National Institute of Standards & Technology, 2012). In this
research, the selection of median value was used as a measure of central tendency to the data.
Figure 4. Distribution of Cracks for BW
Figure 5. Distribution of Cracks for FW (dimension in inch)
72.1.2 Master Gauges
The creation of master gauges containing both notches, used electrical discharge machining
(EDM) and fatigue cracks of varied sizes were manufactured by TTCI, as baselines for
inspection sensitivity verification during the POD evaluations of industry NDE operators. The
primary measures of reliability in NDE are repeatability (i.e., obtained through process control)
and reproducibility (i.e., achieved through rigorous calibration). Unless reproducibility and
repeatability are in control, NDE capabilities data (POD) is not in control and data is not
representative of the inspection process. For NDE methods, such as PT and MT inspections,
both the consistency of the inspection materials used and the sequence of application are critical
to process repeatability. Similarly, for inspection methods, such as eddy current or ultrasound,
which involves human pattern recognition and/or signal observation, there is a requirement for
consistency in the threshold level used in detection (i.e., NDE process acceptance criteria).
Researchers developed master gauges from the test tank cars for use to perform a response
comparison to calibration artifacts used in the field. The Transportation Technology Center
(TTC) stores the master gauges to preserve and periodically revalidate response linearity of the
calibration artifacts, as shown in Figure 6. For this study, each operator had a master gauge
specimen every time before starting an assessment sequence to become familiar with the test
specimen configuration and responses from the artificial fatigue cracks. The process
implemented during tank car NDE POD evaluations required each operator to inspect and size
the cracks and slots in the master gauge test panels before, at intervals during, and after
completing the inspection of the larger tank car section panels.
Figure 6. Tank Car Master Gauge Test Panels
2.2 NDE Methods
This project evaluated the performance/capability of the current NDE techniques for fatigue
crack detection in railroad tank car fusion welds (BW and FW). Applicable methods were
limited to VT, PT, MT, UT, and phased array ultrasonic testing (PAUT). A more in-depth
description of the NDE methods used in this study can be found in the previous reports and
outside literature (Garcia, G., 2002) (Garcia, G., Rummel, W. D., & Gonzalez, F., 2016) (Garcia,
8G., Welander, L., Rummel, W. D., & Gonzalez, F., 2016) (Archuleta, M., Poudel, A., Rummel,
W. D., & Gonzalez, F., 2016).
2.2.1 Visual Testing
Performing VT took place with the unaided eye or with the use of some tools to enhance the
detectability of discontinuities. The main advantage of the VT method is that it requires an
operator to have limited training and equipment, whereas the main limitation of this method is
the visual acuity of the observer or inspector.
2.2.2 Liquid Penetrant Testing
PT relies on capillary action principles where the liquid enters the surface cavities and later
emerges as visual evidence of discontinuities such as defects within the panels. The main
advantage of the PT method is that it is a rapid, simple method where large coverage is possible,
whereas the main limitation of this method is subsurface discontinuities that are not exposed
cannot be detected and characterized.
2.2.3 Magnetic Particle Testing
Usually, generating magnetic fields in test specimens takes place by direct or indirect
magnetization processes. The underlying physics behind this technique is whenever there is a
flaw in the test piece, it interrupts the flow of the magnetic lines of force, thus forming opposite
magnetic poles. When the research team sprays fine magnetic particles onto the surface of the
test specimen, the magnetic poles attract these particles, thus giving a visual representation of the
indication. The advantage of the MT method is that it can detect surface and subsurface defects,
whereas the limitations of this method are that it is only applicable to ferromagnetic materials
and cannot be implemented if thick paint coating is present.
As with other NDE methods that use visual assessment to determine the integrity of the
inspection area, MT can be enhanced by providing a greater contrast between the discontinuity
and surrounding areas of the test article. Note that operators conducted the tests by both
applying and by not applying a coating to the tank car specimen prior to inspection.
2.2.4 Ultrasonic Testing
In the UT approach, a thin layer of couplant is usually applied to the test object and the
transducer scans over the part. This transducer sends out a pulse of energy and either the same
or a second transducer listens for reflected energy (e.g., an echo). Reflections occur due to the
presence of discontinuities and the surfaces of the test object. The main advantage of the UT
method is that the depth of penetration for flaw detection or measurement is superior to other
NDE methods. This makes it highly accurate in determining flaw location and estimating size
and shape, whereas the main limitations of this method are that the surface must be accessible to
transmit ultrasound and limitation to flaw detection capabilities due to fixed angled approach. In
conventional UT, inspection parameters such as focal point and angle of incidence are
mechanically fixed. The focal point in the material is the depth the inspection is performed, and
the angle of incidence is the angle at which the ultrasonic signal is emitted into the material.
92.2.5 Phased Array Ultrasonic Testing
PAUT is an advanced ultrasonic NDE method that uses multiple elements (transducers) in a
single probe housing with the capability to send an array of sound, in a wide range of angles,
through the tested material. The main advantage of the PAUT method is that it uses multiple
elements within a single transducer assembly to steer, focus, and scan beams which reduces
inspection times and improves productivity, whereas the main limitations of this method is
focusing the beam at a too shallow depth on the material, which means that deeper
discontinuities may be missed.
2.3 NDE POD Data Collection
Industry participation for the POD evaluations consisted of 70 NDE operators (ASNT SNT-TC-
1A certified Level I – Level III) from different companies that usually apply different NDE
methods to inspect tank car BW and FW in revenue service, manufacturing, and repair
environments. During the inspection process, operators could use their own NDE inspection
procedures, equipment, and inspection materials as they would do in their normal work
environment. Also, the research team briefed participants on the background, purpose, and the
methodology of data collection and analysis. Finally, each operator received an incognito
operator number during testing, and the statistical data and graphs in this report reflect those
numbers. Table 1 and Table 2 shows the breakdown of all operators that participated for each
NDE method and weld type. Tables 22 and 23 in Appendix I shows the breakdown of each
individual operator who participated in multiple methods for both BW and FW panels.
Table 1. Number of Operator Participants for BW Panels Using Different NDE Methods
NDE Method Number of Operators
VT 24
PT 25
MT with Contrast 19
MT without Contrast 11
UT 25
PAUT 3
Total 107
10Table 2. Number of Operator Participants for FW Panels Using Different NDE Methods
NDE Method Number of Operators
VT 26
PT 27
MT with Contrast 24
MT without Contrast 10
UT 3
PAUT 0
Total 90
The process implemented during tank car NDE POD evaluations also required each operator to
inspect and size the EDM notches and fatigue cracks in the master gauge test panels before, at
intervals during, and after completing the inspection of the larger tank car test panels.
Specifically, this occurred to aid the operators involved in POD evaluations to reinforce their
familiarity with flaw responses from the test panels. Also, this served to ensure repeatability and
reproducibility of the test process involved.
Researchers recorded inspection results for the larger tank car test panels as hit or miss data for
statistical analysis. The use of this data was used as an indicator of potential variation in the
applied operator discrimination level during completion of the inspection sequences. When
finding a large variation in discrimination and sizing, the false call number for that operator was
usually high, and validity of the inspection sequence was therefore in question.
For all BW inspections, NDE operators manually wrote the flaw size from start to end and
location of the crack identified on a magnetic tape located from one end of the BW to the other
end on each panel. A TTCI employee then measured and recorded the operator’s response from
the magnetic strips onto the data collection sheet. Subsequently, the operator entered all data
results into the POD data template for further statistical analysis. Similarly, for all FW
inspections, operators verbally identified the location of a crack and estimated its size, and a
TTCI employee recorded the operator’s response onto the data collection sheet. Subsequently,
all data results were entered into the POD data template for further POD analysis.
Researchers followed these guidelines to determine a hit, miss, or false call for the BW and FW
panel nondestructive testing (NDT) evaluations:
1. Determining a hit: The location DOES contain an actual crack (any length) and the NDT
operator finds a crack of any length within +/- 0.5-inch of the actual crack location, it
would count as a hit.
2. Determining a miss: The location DOES contain an actual crack (any length) and the
NDT operator DOES NOT find a crack of any length within +/- 0.5-inch of the actual
crack location, it would count as a miss.
3. Determining a false call: If an NDT operator finds a crack of any length in a location that
IS NOT within +/- 0.5-inch of the actual crack location, it would count as a false call.
Finally, related to human factors is the operator’s ability to inspect an item within a given period,
under a job quota and maintain production levels, thereby introducing an inherent need to inspect
at a given rate. Consequently, the operator’s ability to discriminate flaws at a standard
11inspection rate influences the POD curve. For example, if two operators evaluate a test sample,
one operator may spend 15 minutes, while another operator may spend 30 minutes, depending on
their comfort level for the decision-making process during flaw discrimination. Operator
variability can also be seen for each operator depending on his/her status in the company and in
the application of the various inspection methods and the effect of false calls on detection
capability.
2.4 False Positive Indications
The NDE inspection process often challenges NDE operators to discern a flaw signal from the
background response (noise) of the material that is inherent to the measurement. If the threshold
discrimination is set too high, the operator will miss the flaw and the POD reduces. If the
threshold discrimination is set too low, a false positive (i.e., noise interpreted as a signal) will
result in instances where the signal and noise distributions overlap. The definition of a false call
is this situation when an NDE operator identifies or records a flaw during an inspection that does
not exist. False calls do not directly influence the POD curve (i.e., when based solely on a
hit/miss approach). An operator could theoretically have a high POD and a correspondingly high
false call rate. Optimal results should manifest a high POD with a low false call rate. Because
false calls may lead to further inspections using additional NDE methods, fleet owners may
experience costs associated with unnecessary maintenance, downtime, and repairs. Selection of
the NDE method and technique should, therefore, be balanced between the POD results and the
number of false calls.
123. Statistical Data Analysis Approach
Researchers considered three different statistical data analysis approaches for the analysis of
historical NDE data obtained for the tank car BW and FW panels. The first approach focused on
the traditional approach of calculating the probability of hits (POH) by obtaining the total
number of hits in a given flaw size interval. This is to show the relationship between crack
length ranges and the number of operators that obtained POH in the given crack length range.
Note that this approach lacks accuracy because the resulting probability can be interpreted that
each crack will have the same probability of being detected. In addition, for this POH to be true,
it is important to account for an “infinite” amount of observations to obtain the “true”
probability.
The second approach focused on calculating the POD values as a function of crack length. This
approach uses the Logistic Regression (LOGIT) statistical model to estimate the parameters of a
LOGIT model using the Maximum Likelihood Estimation (MLE) approach. The MLE is a
frequentist method that calculates a posteriori probability of the parameters of a model given the
observations, by maximizing the likelihood of observing the data given the parameters.
The third statistical data analysis approach is the National Aeronautics and Space
Administration’s (NASA) Design of Experiments for Probability of Detection (DOEPOD).
DOEPOD uses a binomial distribution model for a set of flaws that are grouped into classes,
where each class has a width. It also utilizes the concept of point estimate POH at a given flaw
size and the lower confidence levels (LCL) of the observed estimated POH. It is the most
conservative approach compared to the others mentioned earlier.
This section provides a quick background and history on the POD.
3.1 POD Background
A fatigue and fracture mechanics-based approach in the design, maintenance, and life extension
of engineering systems provides quantification of confidence in the safety and structural
integrity. Also, the emergence of a damage tolerance approach to determine inspection intervals
for an engineered structure, such as railroad tank cars, requires the quantification of the
detectable flaw size for the NDE methods used during inspection. The National Transportation
Safety Board (NTSB) issued Safety Recommendations R-92-21 through R-92-24 suggesting a
process of performing a reliable inspection of railroad tank cars based on a damage tolerance
approach (National Transportation Safety Board, 1992). Damage tolerance design and
maintenance requirements aim to improve the reliability and confidence level of tank car
acceptance and maintenance.
A frequently used statistical metric to quantitatively measure the performance and capability of
the NDE process/procedures is the POD. Researchers generated the POD graphs to relate the
output of the NDE process/procedure to some characteristic of the test object, typically “cracks.”
This is done by subjecting a statistically significant number of flaws of varying size through an
inspection procedure and plotting the detection/miss results as a function of flaw size (i.e.,
length, depth, depth-to-length ratio, depth-to-panel thickness ratio). However, many controllable
and uncontrollable variables influence POD results. These include flaw characteristics (i.e.,
shape, size, and orientation), test object (i.e., material, thickness, and geometry), NDE
methods/materials applied, NDE equipment, accept/reject criteria, NDE
13procedure/process/calibration, NDE personnel (i.e., education, training, experience),
environmental condition, and human factors involved during the inspection process. In addition,
repeated inspection of the same type and size of flaws also does not necessarily yield consistent
results. There will typically be a spread in the detection results for the same flaw type and its
size. These variations are inherent to any NDE process because of the variations in equipment
setup, calibration, material properties, and flaw characteristics. Therefore, presenting NDE
detection performance/capability is usually in a statistical term such as POD.
POD functions for quantifying the capabilities of NDE technique have been the subject of
various investigations and have also experienced impressive advancement since its inception in
late 1960s and early 1970s by NASA for its Space Shuttle Program (Pettit, D. E., & Hoeppner,
D. W., 1972) (Rummel, W. D., Todd, P. H., Frecska, S. A., & Rathke, R. A., 1974) (Rummel,
W. D., Rathke, R. A., Todd, P. H., & Mullert, S. J., 1975) (Rummel, W. D., Rathke, R. A., Todd,
P. H., Tedrow, T. L, & Mullen, S. J, 1976), and followed by the Air Force aircraft programs
(Lewis, W. H., Dodd, B. D., Sproat, W. H., & Hamilton, J. M., 1978) (Berens, A. P., & Hovey,
P. W., 1983). The POD is now considered to be a standard method for demonstrating the
capability of NDE processes and is widely accepted and integrated by many industries and
agencies. Two standard approaches for analyzing the NDE test data and producing POD graphs
have been proposed and both include (a) hit/miss data (binary response); and (b) a/â (quantitative
signal response) (U.S. Department of Defense, 2004). In the hit/miss approach, recording the
outcome of NDE results is a binary value, i.e., whether the flaw was detected (1) or not (0).
Similarly, in the a/â approach, NDE signal response (i.e., â, ‘a hat data’) is recorded and is
related to the flaw size (a). Next, hit/miss or a/â data are analyzed using different probabilistic
statistical models to produce the POD(a) function. Some of the standard approaches include
LOGIT, probit regression model (PROBIT), Bayesian, and Binomial Point Estimate Methods.
Details on these probabilistic statistical models are well described in the literature (Rummel, W.
D., Todd, P. H., Frecska, S. A., & Rathke, R. A., 1974) (Rummel, W. D., Rathke, R. A., Todd, P.
H., & Mullert, S. J., 1975) (Rummel, W. D., Rathke, R. A., Todd, P. H., Tedrow, T. L, &
Mullen, S. J, 1976) (Lewis, W. H., Dodd, B. D., Sproat, W. H., & Hamilton, J. M., 1978)
(Berens, A. P., & Hovey, P. W., 1983) (U.S. Department of Defense, 2004) (Generazio, E. R.,
2009) (Generazio, E. R., 2011) (Generazio, E. R., 2014).
The two parameter LOGIT model assumes that the POD is always increasing with the
discontinuity size and is commonly expressed as:
(1)
where, ɑ is the discontinuity size and α/β are the two parameters that are to be estimated using
the MLE procedure. Although the function shown in Equation 1 describes a cumulative
distribution (i.e., assumes a random Gaussian distribution); this function should not be confused
with cumulative probability functions and the discontinuity size is not a random variable. The
LOGIT model may also be described as:
(2)
where, α/β are parameters to be fit to the data and F is an increasing function with respect to
crack size, a.
14A standout amongst the usually acknowledged metric of a sufficient NDE inspection process is
that there should be 90 percent or greater probability of detection with 95 percent confidence for
a given flaw size and greater (90/95 POD) (Generazio, E. R., 2009). The origin of implementing
90/95 POD as a metric for NDE inspection capability, derived from Mil-HDBK-5H where the
90/95 bound (T90 value) for acceptable B-basis material properties defined by U.S. Department
of Defense (1998). The T90 is the value at which at least 90 percent of the population is expected
to equal or exceed with 95 percent confidence. Figure 7 shows that the statistically computed
value of T90 which represents a 95 percent LCL on the 10th percentile of the distribution; using a
confidence limit assisted with calculating the value to provide a margin in the POD value.
Figure 7. Normal Distribution Showing 1st and 10th Percentile Distribution for
Computing T99 and T90 Values
Note: if the sample cannot be described by a normal or Weibull distribution, the T99 and T90
values must be computed by nonparametric (distribution free) means, which can only be done if
there are at least 299 observations.
Maximum false call percentage (FCP) of 5 percent is allowed for use with multi-parameter MLE
curve fits. The Advisory Group for Aerospace Research and Development Group (AGARD)
suggested this 5 percent FCP for use with multi-parameter MLE curve fits (Advisory Group for
Aerospace Research and Development Group, 1993). Note that the acceptance of FCP of 5
percent for use in multi-parameter MLE curve fits is still not clear whether this suggestion was
for LOGIT, PROBIT, or for a/â curve fit approaches and whether this suggestion was for Wald
or Likelihood ratio bounds. These are all important in deciding this acceptance level.
15The first POD study conducted under a NASA program generated 118 Al 2219-T87 test panels
containing 328 tightly closed fatigue cracks of varied size (Rummel, W. D., Todd, P. H.,
Frecska, S. A., & Rathke, R. A., 1974). The use of the binomial point estimate approach for
hit/miss data was to generate POD graphs with confidence level as a function of crack size. The
data was insufficient to plot the 95 percent confidence level (i.e., 60 observations), therefore,
researchers computed the 90 percent confidence level (i.e., 29 observations in each data group).
These data size requirements for POD assessment triggered several investigations in this field by
various researchers seeking to develop alternative analysis procedures. Two notable procedures
were then developed using smaller data sets and evolved as the baseline methods for use. These
include NASA 29/29 procedure and Berens (LOGIT/PROBIT) model procedures (Rummel, W.
D., April 16-20, 2010).
The initial NASA approach for generating the POD, also described in the tutorial handbook
(Rummel, W. D., 1997), has been the foundation of the railroad tank car NDE POD work
performed under the sponsorship of FRA. This method established many of the requirements in
current specifications and identified as a possible goal for use in railroad tank car NDE
inspections during the initial discussions of the HM-201 rulemaking.
3.2 DOEPOD
DOEPOD is a methodology based on the design of experiment (DOE) and is implemented via
software to provide a detailed analysis of POD test data, guidance on establishing data
distribution requirements, and resolving test issues (Generazio, E. R., 2009). It uses a binomial
distribution model for a set of flaws grouped into classes, where each class has a width. It also
utilizes the concept of point estimate POH at a given flaw size and the LCL of the observed
estimated POH (Generazio, E. R., 2015). DOEPOD expands the prior NASA POD work based
on binomial distribution by including the concept of LCL for establishing that there is 95 percent
confidence that the POD is greater than 90 percent (90/95 POD). DOEPOD, moreover, fulfills
the requirement for critical applications where validation of NDT systems, procedures, and
operators are required even when a predicted POD curve is estimated (Generazio, E. R., 2015).
DOEPOD does not assume random Gaussian distribution about the value to predict POD value
like multiple-parameter curve fitting or model optimization approaches. The detailed description
on the DOEPOD methodology, concepts, confidence bound, and false call rate analysis are well
described in the literature (Generazio, E. R., 2009) (Generazio, E. R., 2011) (Generazio, E. R.,
2014) (Generazio, E. R., 2015).
During operation, DOEPOD statistically analyzes the NDT inspection data, identifies different
cases for the results obtained, and provides direction on what to do next depending on the case,
including how to modify the DOE to continue to efficiently validate the inspection system. For
example, if 90/95 POD is reached at a given flaw size, then DOEPOD will direct the operator to
identify locations that need additional validation for other flaw sizes. If 90/95 POD is not
reached, then DOEPOD will use best lower confidence value to identify where options are
available to reach 90/95 POD. DOEPOD classifies the POD result into one of seven different
cases, such as CASES 1, 2, 4, 5, 6, 7, 1 and survey datasets. Once the case is determined,
1
CASE 3 (i.e., multiple discontinuity sizes where 90/95 POD is observed for a fixed class width) and CASE 0 (i.e.,
all hits) are included in CASES 1 and 2 in DOEPOD.
16DOEPOD provides recommendations which, if successfully pursued, will help for the full
system validation. Table 3 lists the DOEPOD analysis summary and recommendations for all
cases.
Finally, DOEPOD yields a warning when the upper confidence bound of the FCP exceeds
0.03448. The observed 90/95 POD results, when the upper confidence bound of the FCP
exceeds 0.03448, is not considered valid. The 3.448 percent is the quantitative upper Clopper-
Pearson 95 percent bound at which the probability of false call (FCP) may produce a “Lucky
Hit” that is added to the Number of Hits, resulting in an erroneous higher estimate of the POD.
17Table 3. Summary of all Cases and Actions in DOEPOD (Generazio, E. R., 2011)
90/95 Large
Does Is POH = 1 Is
POD at Flaw
CASES XPOH everywhere XPOH ≤ DOEPOD Analysis Summary and Recommendations
XPOD Validation
exist? > XBest_LCL? XL/3?
reached? Complete?
90/95 POD at XPOD has been reached.
CASE 1 YES YES YES N/A YES
Actions: Address any false call warnings.
90/95 POD at XPOD has been reached.
CASE 1+ YES YES NO N/A YES Actions: Misses above XPOD need to be explained and resolved. Address any
false call warnings.
90/95 POD at XPOD has been reached.
CASE 1# YES YES YES N/A NO Actions: Further validation at flaw sizes greater than XPOD is required. Add
large flaws. Address any false call warnings.
90/95 POD at XPOD has been reached.
Actions: Further validation at flaw sizes greater than XPOD is required. Add
CASE 1* YES YES NO N/A NO
large flaws. Misses above XPOD need to be explained and resolved. Address
any false call warnings.
90/95 POD at XPOD has been reached. However, there are excessive number of
Misses above XPOD.
CASE 2 YES YES NO N/A N/A
Actions: Add validation at identified flaw sizes is required. Add flaw per
instructions.
90/95 POD at XPOD has not been reached.
CASE 4 NO YES YES N/A N/A
Actions: Increase number of flaws at XPOH = 1 or XBest_LCL
90/95 POD at XPOD has not been reached and there are misses above XBest_LCL.
CASE 5 NO YES NO YES N/A
Actions: Increase number of flaws at XPOH = 1
90/95 POD at XPOD has not been reached. The POH is fluctuating above
XBest_LCL and XPOH is greater than XL/3. The inspection system is unstable for
CASE 6 NO YES NO NO N/A
the flaw size range analyzed.
Actions: Increase the flaw size range by a factor of two.
90/95 POD at XPOD has not been reached. The inspection system is unstable for
the flaw size range analyzed.
CASE 7 NO NO N/A N/A N/A
Actions: The inspection system may not be appropriate or increase the flaw
size range by a factor of two.
The optimized class width exceeds 1/3 XL and XPOD has not been reached. The
Survey class width optimization has determined that there is a class width for which
NO YES N/A N/A N/A
Cases the smallest XPOH = 1 class length is identified.
Actions: Add flaws at Survey/Optimum XPOH
18You can also read