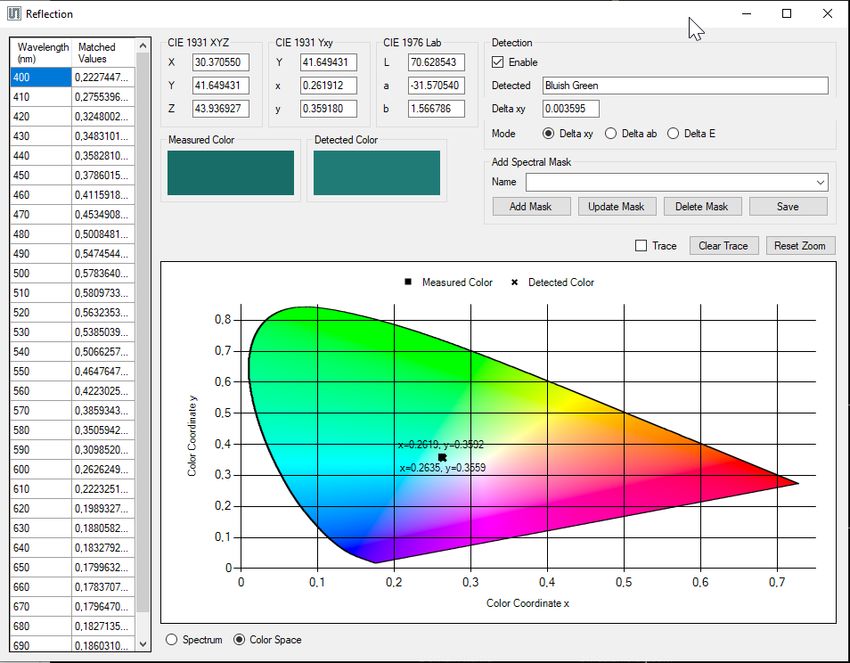
AS7343 User Guide 14-Channel Multi-Spectral Sensor For Spectral and Color Measurement - Mouser Electronics
←
→
Page content transcription
If your browser does not render page correctly, please read the page content below
User Guide
UG001009

AS7343
14-Channel Multi-Spectral Sensor For Spectral and
Color Measurement

Manual Evaluation Kit
v1-02 • 2022-Jan-10
Document Feedback AS7343
 Content Guide

Content Guide

1 Introduction ................................... 3 6.3 Hot Keys ..................................................... 25
 6.4 Sensor Board Test...................................... 27
1.1 Kit Content .................................................... 3 6.5 Offset Compensation .................................. 27
1.2 Alternative Sensor Board Interfaces and 6.6 Operation Mode .......................................... 29
 Housings....................................................... 4 6.7 Main Tab ..................................................... 30
1.3 Ordering Information .................................... 7 6.8 ALS Light Detection .................................... 35
2 Getting Started .............................. 8 6.9 Reflection Mode .......................................... 41
 6.10 Window Log ................................................ 44
2.1 System Setup ............................................... 8 6.11 Flicker Log .................................................. 44
2.2 Software Installation ..................................... 9 6.12 Detection Log ............................................. 44
 6.13 Flicker Detection ......................................... 44
3 Hardware Description ................. 11 6.14 Register Mapping ....................................... 48
3.1 Hardware Architecture ................................ 11 6.15 Tracer ......................................................... 49
3.2 Power Supply ............................................. 12
3.3 Onboard Example LEDs............................. 12 7 Error Message List ...................... 52
3.4 Connector Pinout Description..................... 13 8 Additional Documents ................. 55
4 Optical Diffuser............................ 15 9 Revision Information ................... 56
5 Correction and Calibration ......... 18 10 Legal Information ......................... 57
6 Software ....................................... 19
6.1 Initialization Files ........................................ 19
6.2 EVM Graphical User Interface.................... 24

Eval Kit Manual • PUBLIC
UG001009 • v1-02 • 2022-Jan-10 57 │ 2
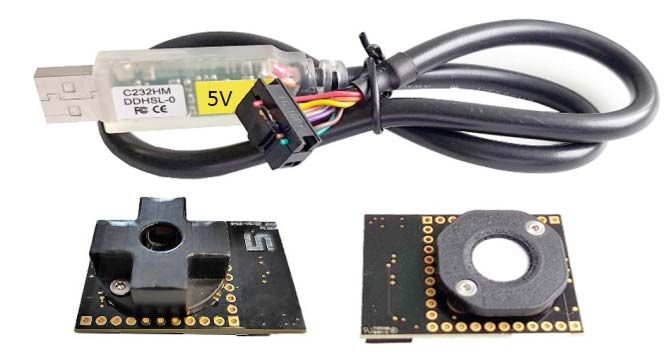
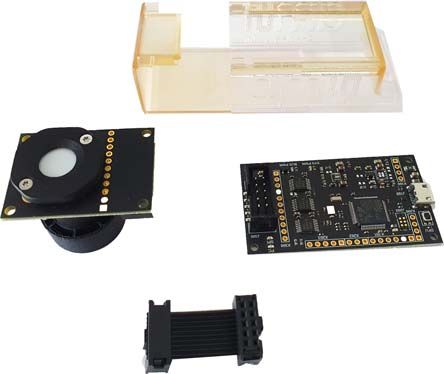
Document Feedback AS7343
 Introduction

1 Introduction
 This AS7343 Evaluation Kit (EVK) is a platform to evaluate the spectral sensor applications and to
 demonstrate different use cases. It realizes basic functions to get the sensor’s ADC counts based on
 alternative setups and includes special functions - to demonstrate application-specific tasks (ALS
 Ambient Light Sensing, Reflection Mode, Flicker Detection and Spectral, and Color Mask Compare).
 Perhaps, these functions need a hardware adaptation (e.g. LED on board for reflection) or an
 additional optional mechanical interface, which must be ordered separately. In general, there are two
 standard evaluation kits available, which are different in use case and optical adapters.
 ● The standard ALS kit is for measuring contactless ambient lighting or light sources - includes
 the hardware version without LEDs on board, but with a diffuser in front of the sensor with a
 maximum field of view. It represents the standard kit (see Figure 1) for light measurement
 /detection or liquid measurements in transmission.
 ● The extended kit, reflection mode, is for contact measurement of colored surfaces (see
 Figure 2) and consists of the sensor hardware, but with pre-assembled LED (broad band white
 LED) and a special adapter in front of the sensor with 0° (Sensor) /45° (LEDs) geometry.

 This user manual describes the features and functions for both variants, all supported sensor types,
 and sensor hardware connected to a PC with an I²C-FTDI Interface. The software and driver are
 limited to a PC with MS Window. Other interfaces for the sensor boards are in preparation. Ask our
 support team for more details.

1.1 Kit Content
 The Evaluation Kit contains the following items, shown in Figure 1.

 Figure 1
 Kit Content Of EVK Variant ALS

 Item 1 Item 2 Item 3 Item 4
 FTDI EVK with Diffuser in Front Adapter USB Stick Special Backside Adapter

Eval Kit Manual • PUBLIC
UG001009 • v1-02 • 2022-Jan-10 57 │ 3
Document Feedback AS7343
 Introduction

 Item No.: Item Comment

 1 FTDI - USB Cable USB – I²C Cable with 10-pole IDC Connector, 5 V
 AS7343 AS7343 EVK Evaluation Kit with pre-assembled Front Adapter and
 2
 ALS Diffuser
 3 USB Data Stick Documents, software, firmware and drivers.
 Special Backside Adapter 3D-Printing part, used to adapt the 16 mm holder into:
 4 EVAL Linos 16 ● 16 mm Linos-Nano-Bank (above)
 EVAL Linos 16-25 ● 25 mm Linos-Nano-Bank (below)

 Figure 2 :
 Kit Content Of EVK Variant Reflection

 Item 2
 Item 1 Item 3 Item 4
 EVAL KIT with LED
 FTDI USB Stick Special Backside Adapter
 and 0°/45° Optical Front Adapter

 Item No.: Item Comment

 1 FTDI - USB Cable USB – I²C Cable with 10 pole IDC Connector, 5 V
 AS7343 AS7343 EVK Evaluation Kit with pre-assembled LED and 0°/45° Front
 2
 Reflection Adapter (without diffuser(1)).
 3 USB Data Stick Documents, software, firmware and drivers.
 Special Backside Adapter 3D-Printing part, used to adapt the 16 mm holder into:
 4 EVAL Linos 16 ● 16 mm Linos-Nano-Bank (above)
 EVAL Linos 16-25 ● 25 mm Linos-Nano-Bank (below)

 (1) Customers should add a diffuser in front of the sensor in case of a none diffusible application

1.2 Alternative Sensor Board Interfaces and Housings
 The current standard delivery form for ALS and reflection is the sensor board with FTDI as I²C to USB
 conversion and connection via Com-Interface on PC and Windows. In addition, other electronic
 interfaces are possible, which are supported by the test software.

Eval Kit Manual • PUBLIC
UG001009 • v1-02 • 2022-Jan-10 57 │ 4
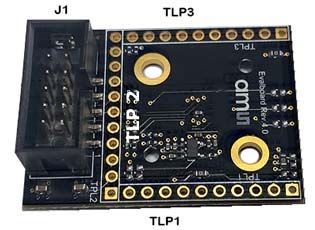
Document Feedback AS7343
 Introduction

 Information

 Please note that when using these, own drivers may have to be installed. Further driver details are
 listed in chapter.

1.2.1 Unicom Interface Board

 While the FTDI interface is a pure I²C to USB converter and works time limited, the Unicom in
 standard form factor. The following figures show both Unicom versions, which differ only in form factor
 and interface. Both run with the same firmware, but offer differentiated interfaces on the contact strips
 and connectors. Figure 3 shows the standard version and Figure 4 a miniaturized version.

 In general, this board is a data logger with controller on board. Depending on the programming,
 Unicom can work as a simple converter or as a data logger. In logger mode very high measuring
 speeds are possible, if this is supported by the software on the host side. The standard GUI works
 under Windows and is not real-time capable. The GUI does not fully utilize the Unicom in terms of
 frequency. Here the Unicom board works only as a simple converter, but with supported software on
 MC. The following figures show both Unicom versions, which differ only in form factor and interface.
 Both run with the same firmware, but offer differentiated interfaces on the contact strips and
 connectors.

 Figure 3:
 Unicom Interface (Standard Version) With Fully Interfaces And Full Sized

 Figure 4:
 Unicom Interface (Tiny Version) With Limited Interfaces And Small Size

 Both boards also differ in the mounting of the sensor board or in the mounting in a housing. The
 following figures show some examples from which ams can deliver design and manufacturing data’s.

Eval Kit Manual • PUBLIC
UG001009 • v1-02 • 2022-Jan-10 57 │ 5
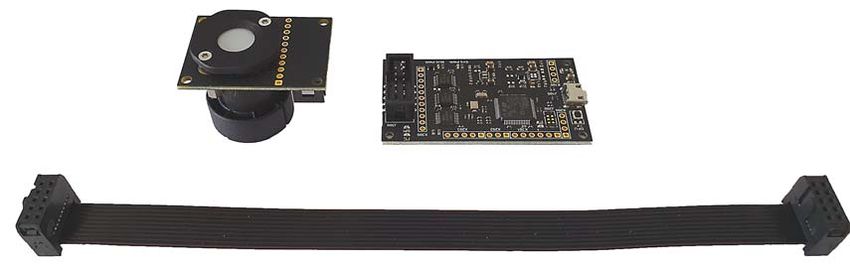
Document Feedback AS7343
 Introduction

 Figure 5:
 Sensor And Standard Unicom Board, Connected Via Ribbon Cable, USB-Interface

 Figure 6:
 Sensor And Standard Unicom Board, Connected Via Ribbon Cable, USB-Interface, Insert-able
 In Plastic Housing

 Figure 7:
 Sensor And Tiny Board, Direct Plugged With USB-Interface, Insert-able In Plastic Housing

Eval Kit Manual • PUBLIC
UG001009 • v1-02 • 2022-Jan-10 57 │ 6
Document Feedback AS7343
 Introduction

1.3 Ordering Information

 Ordering Code Description

 AS7343 EVK ALS
 14-Channel Spectral Sensor Evaluation Kit for ALS
 AS7343 EVK ALS
 14-Channel Spectral Sensor Evaluation Kit for
 AS7343 EVK REFLECTION
 Reflection Mode

 Attention

 Please order optional parts separately.

 Information

 It is also possible to print or modify the customized adapters. See the document path of the USB stick
 for the 3D models.

Eval Kit Manual • PUBLIC
UG001009 • v1-02 • 2022-Jan-10 57 │ 7
Document Feedback AS7343
 Getting Started

2 Getting Started

2.1 System Setup
 The evaluation kit consists of the FTDI cable (I²C to USB converter) and the sensor board with pre-
 mounted adapters. Adapters on the front side are necessary to meet the optical requirements of the
 sensor filter specification or to adapt the sensor to application specific requirements (FOV field of view
 or 0°/45° geometry). Adapters on the rear side are used to mount the EVK in mechanical test systems.

 The sensor board has an I²C interface. The FTDI-adapter 5V with a USB interface and a COM-Port
 driver converts the sensor signals into the PC GUI. Figure 8 shows the FTDI cable (above) and the
 sensor board for Reflection Mode (below left), and the standard version e.g. for ALS Light Detection
 (right).

 Figure 8:
 Evaluation Kit With Sensor Hardware, Optical Adapters (Front) And FTDI Adapter(1)

 (1) Accessories may differ from the picture

 To get started with the evaluation kit, perform the following steps:

 Select the correct evaluation KIT for your application.

 Install the GUI (MSI) and all drivers from USB stick, please read details in chapter 2.2

 Plug the FTDI cable into the socket of the sensor board. Then connect the kit to the PC.

 If there is an issue during the installation process, please read the details in chapter 2.2.

Eval Kit Manual • PUBLIC
UG001009 • v1-02 • 2022-Jan-10 57 │ 8
Document Feedback AS7343
 Getting Started

2.2 Software Installation
 The GUI is compatible with Window 10 - where .NET Framework 4.5.2 or a later version is pre-
 installed. It is mandatory to install the 32-bit Visual C++ redistributable for visual studio 2015 runtime.
 The ‘vc_redist.x86.exe” setup is included with the evaluation kit. Before connecting the FTDI adapter
 to the computer, the specified FTDI driver must be installed. Start the ‘CDM21216_Setup.exe” and
 follow the step-by-step instructions. Then connect the EVK to the computer via the FTDI adapter.

 Figure 9:
 Typical(1) Main Tab With Expert Mode And Status Bar With Connect Sensor Hardware

 (1) The software is used for different test systems based on the AS7343. The GUI may consider this with additional
 information or changed functions or other release. Filter names may vary in the interest of progress.

 Start the software installation from the USB stick ‘*.msi” and then start the GUI directly from the
 program directory ‘C:\Program Files (x86)\ams-OSRAM\AAS7343 Demo”. Afterward, it should show
 the Main Tab and the successful connection to the EVK in the status bar and footer line (see
 Figure 9).

 The GUI needs some initialization files, which will be installed during the setup in the user directory
 ‘C:\Users\user\AppData\Roaming\ams-OSRAM\AAS7343 Demo\” (see Figure 10).

Eval Kit Manual • PUBLIC
UG001009 • v1-02 • 2022-Jan-10 57 │ 9

Document Feedback AS7343
 Getting Started

 During the time of installation, the standard initialization files are generated in the folder ‘UserData’
 (C:\Users\user\AppData\Roaming\ams-OSRAM\AAS7343 Demo). The GUI checks each time if these
 standard files still exist in this area. If not, the GUI will install the missing files again.

 Consider saving the previously used initialization files if needed. For more details, see chapter 6.1.

 Attention

 A de-installation process will also delete the standard initialization files. Therefore, create a backup
 or copy of such files in case you want to use them after de-installation, or use alternative file names
 for the initialization files.

 Figure 10:
 Typical User Directory With ALS Initialization Files

Eval Kit Manual • PUBLIC
UG001009 • v1-02 • 2022-Jan-10 57 │ 10
Document Feedback AS7343
 Hardware Description

3 Hardware Description

3.1 Hardware Architecture
 The Evaluation Kit includes an LDO to provide the 1.8 V supply voltage for the sensor chip, ESD
 protection diodes for the I²C bus and GPIO lines, and a placeholder for optional LEDs. The LEDs1 can
 be powered - either from the FTDI adapter or externally via the connector TLP1. This is achieved with
 a 10-pole IDC socket for connecting the FTDI adapter cable (J1) and 1/10 inch rows of holes for
 mounting on a 1/10 inch hole grid plate or by directly contacting signals (TLP1 to TLP2).

 Figure 11 :
 AS7343 Board Block Diagram

 1
 Must be soldered by the customer or use AS7343 / AS7343 EVK Reflection. The function of LED current, light intensity, and/or
 maximal driver current depends on the used LEDs and the connected power supply. Check the LED datasheet before using this
 LED setting. A LED current can destroy the LEDs if it is too high.

Eval Kit Manual • PUBLIC
UG001009 • v1-02 • 2022-Jan-10 57 │ 11
Document Feedback AS7343
 Hardware Description

3.2 Power Supply
 In general, the FTDI converter produces the 5 V power supply for the sensor board. The converter is
 part of the original package of the EVK. Customers can use onboard alternative pre-designed power
 supplies. For more details, see Figure 14.

 Information

 Make sure to use the original adapters and converters before connecting the hardware to the USB.

3.3 Onboard Example LEDs
 The LEDs on this Evaluation Board are broad banded white light LEDs. The typical spectral
 distribution is shown in Figure 12:

 Figure 12:
 Typical Spectral Distribution Of LED

 If the Evaluation Board power supply is 5 V, it will not be possible in connection with the series resistor
 to get a current bigger than 200 mA through both LEDs and 100 mA for one LED. This limit is given by
 a 5 V power supply and both 10 Ohm series resistors.

 It is possible to connect the Evaluation Board to a bigger power consumption voltage. Pin1 on TLP1 is
 for external LED voltage distribution. (Pin2 TLP1 is GND). R11 is to be disassembled and fitted as
 R13.

Eval Kit Manual • PUBLIC
UG001009 • v1-02 • 2022-Jan-10 57 │ 12
Document Feedback AS7343
 Hardware Description

3.4 Connector Pinout Description
 Figure 13:
 Connector Pinout Description

 Figure 14:
 Overview Connectors And Interfaces

 Designator Comment

 J1 10-pole IDC Socket, connect to PC via FTDI Adapter (3.3 V)
 TLP 1 VEXT, LDR, GND, 1V8
 TLP 2 5V0, (3V3), I²C, INT, GPIO
 TLP 3 GND

Eval Kit Manual • PUBLIC
UG001009 • v1-02 • 2022-Jan-10 57 │ 13
Document Feedback AS7343
 Hardware Description

 Figure 15:
 Connectors

 Pin Number Net Name Function

 TLP1 1 VEXT Supply the optional fitted LEDs from an external source.
 TLP1 2 GND Ground
 TLP1 3 LDR Constant current sink from the sensor chip.
 TLP1 4…9 NC Not connected.
 TLP1 10 1V8 External power supply - before using this pin, disassemble the LDO.
 TLP 2 1 GND Ground
 5V0 power input if there is no power on J1 (FTDI adapter) or 5V0 power output, if
 TLP 2 2 NC
 the power comes over J1.
 TLP 2 3 3V3 3V3 power output from the LDO.
 TLP 2 4 GND Ground
 TLP 2 5 SDA I²C data signal
 TLP 2 6 SCL I²C clock signal
 TLP 2 7 INT Sensor chip interrupt signal
 TLP 2 8 GPIO 2 GPIO signal, bridged to the FTDI adapter.
 TLP 2 9 GND Ground
 TLP 2 10 GPIO 3 GPIO signal, bridged to the FTDI adapter and sensor chip.
 TLP 2 11 SDA2 Is normally bridged to SDA, only needed for FTDI adapter.
 TLP 3 1..5, 7..10 NC Not connected.
 TLP 3 6 GND Ground
 J1 1 NC Not connected.
 J1 2 3V3 3V3 power input from the FTDI adapter.
 J1 3 GND Ground
 J1 4 SDA I²C data signal
 J1 5 SCL I²C clock signal
 J1 6 INT Sensor chip Interrupt signal.
 J1 7 GPIO 2 GPIO signal, bridged to TPL 2.
 J1 8 GND Ground
 J1 9 GPIO 3 GPIO signal, bridged to the sensor chip.
 J1 10 SDA2 Is normally bridged to SDA, only needed for FTDI adapter.

Eval Kit Manual • PUBLIC
UG001009 • v1-02 • 2022-Jan-10 57 │ 14
Document Feedback AS7343
 Optical Diffuser

4 Optical Diffuser
 For non-diffuse applications2, as light detection from a light source, a translucent diffuser in front of the
 AS7343 EVK is required - which uses scattering centers to spread incoming directed light in
 pseudorandom directions. These scattering centers can be tiny surface structures on the top (e.g.
 grounded glass) or small white particles inside (e.g. opal glass) the diffuser. This property divides
 diffusers into two main groups of surface diffusers and volume diffusers. The selection of a diffuser
 depends on the use case, the irradiance, the angular distribution of the light and the needed flexibility
 of the setup in a fixed or mobile application.

 A surface diffuser with high transmission and a radiation pattern as wide as possible should be used in
 case of low light measurement applications.

 Narrowing the radiation pattern for higher transmission efficiency is only possible for detecting large
 and homogenous light sources or if the conditions for calibration are the same as measurement
 geometry and stability. Calibration can compensate for stable conditions, chromatic effects, deviations,
 and others. In applications under changing conditions, regarding size, direction, and/or orientation of
 the light source, a volume diffuser with nearly Lambertian and achromatic characteristics is the best
 choice to create a sensor system that is not affected by the direction of incoming light.

 In addition to the technical aspects, its material thickness, surface (robustness), availability and price
 also play an important role in the selection of the diffuser. It may be that compromises are necessary.

 The following table lists the recommended diffuser parameters and/or the parameters of the diffuser
 Kimoto in the EVK (=recommended parameters for a similar diffuser).

 Figure 16:
 Recommended Diffuser Parameters3

 Parameter Value Value

 Diffuser Material Kimoto 100 PBU Kimoto OptSaver L-57
 Diffuser Thickness 125 Microns 100 Microns
 Transmission 66 % 60%
 Haze 89.5 % 93.1 %
 Half-Angle 35.5° 57°

 The AS7343 EVK includes currently a Kimoto 100 PBU diffuser directly above the sensor. This
 diffuser has good technical parameters (see Figure 16), taking into account price and availability. It is
 located in two simple plastic shells and screwed onto the Evaluation Kit (see Figure 19).

 2
 e.g. ‘ALS’ Ambient Light Sensing in contrast to reflections which are mostly diffused.
 3
 The EVKs can either contain the 100 PBU or are equipped with the L-57 type. Information about this can be obtained from the
 ams support.

Eval Kit Manual • PUBLIC
UG001009 • v1-02 • 2022-Jan-10 57 │ 15
Document Feedback AS7343
 Optical Diffuser

 One effect of the diffuser PBU-100 is somewhat dependent on the incident angle of the light. Figure 17
 shows the spectral change for different irradiation angles of the PBU-100 which can lead to deviations
 in dynamic applications depending on the application.

 Figure 17:
 Angle Dependence Of Kimoto 100-PBU For Spectral Scanning

 For such cases, alternative diffusers can be used, which differ, for example, in angular dependence
 and possibly other parameters. One such diffuser is the 'Kimoto OptSaver L-57' type, which has better
 angular consistency but similar other technical parameters.

 Figure 18:
 Angle Dependence Of Kimoto OptSaver L-57 For Spectral Scanning

Eval Kit Manual • PUBLIC
UG001009 • v1-02 • 2022-Jan-10 57 │ 16
Document Feedback AS7343
 Optical Diffuser

 Figure 19:
 Installation Of Diffusor Holder ALS(1)

 (1) The assembly is similar for AS7343 AS7343 EVK Reflection and/or the backside adapters.

 Information

 The diffuser specification depends on the customer application. Therefore, check the technical
 parameters of the standard diffuser for technical details before you start any tests. Changing the
 diffuser is possible. Be careful not to touch the diffusers with your fingers, in case of any mounting
 activities. The surface of the diffusers is sensitive, and any touches, mechanical stress, or dirt can
 dramatically change the optical behavior. Changing the diffuser and re-assembling typically
 changes the calibration parameters and requires recalibration for optimal results.

 For more details, please order [2].

Eval Kit Manual • PUBLIC
UG001009 • v1-02 • 2022-Jan-10 57 │ 17
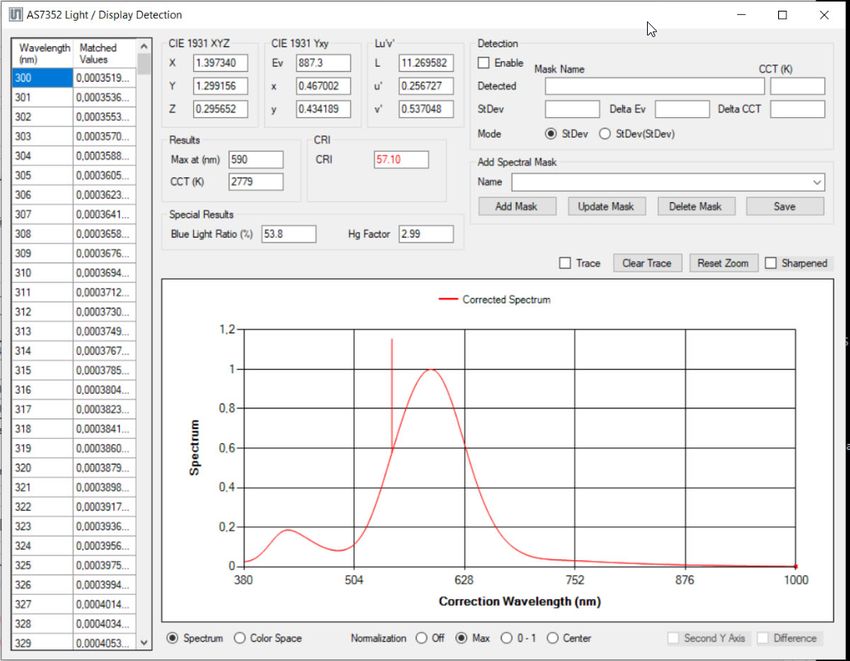
Document Feedback AS7343
 Correction and Calibration

5 Correction and Calibration
 The purpose of correction and calibration is to compensate for product-, production- and situation-
 related disturbances, influences and deviations of the sensors in the application. These can be fixed
 and unchanged values as well as influences over time. Here, especially the independent sensor signal
 correction as well as the equal purchase of all sensors of a series are the target. Furthermore, the
 matching, i.e. the conversion of the sensor signals into the unit of measurement of the application with
 optimal accuracy, is another goal of the correction or calibration.

 The AS7343 is a 14-channel spectral sensor. The sensor can be calibrated with a spectral calibration
 matrix which includes correction data’s to get a reconstructed spectrum or directly via XYZ correction
 data’s per channel in the visible range VIS into to get XYZ coordinates as sensor results. Of course,
 balance methods are also possible at any time to evaluate spectral fingerprints with the sensor.

 All algorithms and examples for these standard calibration modes are described in sensor documents
 and can be used for the AS7343 after adjusting the number of channels. The same applies to the
 simple spectral use of individual channels or groups absolutely or in comparison of their ratios.
 Examples for the correction and use of such spectral fingerprints are also included in these documents
 and are not described verbally here.

 Compared to other spectral sensors, the AS7343 not only contains overlapping narrowband band
 passes4, distributed at more or less equal intervals over the visible wavelength range. It also contains
 3 color channels following the CIE1931 XYZ color standard plus overlapping narrowband spectral
 channels to the left and right of each color channel for their adjustment and parameterization or
 correction.

 Summarized, band passes were designed in the AS7343 as XYZ functional channels plus
 complementary band passes for parameterization. As a result, the AS7343 contains necessary XYZ
 channels with the possibility of their parameterizations for a high accurate CIE1931 based color
 measurement and derived variables like CCT and lux. It further includes band passes for spectral
 reconstruction and fingerprint band passes as well as further function channels for flicker, Hg+
 (fluorescence peak) and NIR detection to identify better special light sources. Thus, the AS7343 fulfills
 all requirements to perform a spectral reconstruction, but it is designed to perform especially CIE1931
 measurements very well. Therefore, its focus for calibration is on color measurement. Therefore, the
 appropriate method here is the direct XYZ calibration of the color channels plus their parameter
 trimming channels by means of standard observer function for ALS and by means of color targets for
 reflection.

 4
 Functional channels such as flicker, NIR and clear, which play a minor role for the spectral reconstruction or XYZ calibration
 considered, are excluded from the comparison here.

Eval Kit Manual • PUBLIC
UG001009 • v1-02 • 2022-Jan-10 57 │ 18
Document Feedback AS7343
 Software

6 Software

6.1 Initialization Files
 The initialization files (see Figure 10) supply important parameters for the GUI. Customers can adapt
 these files, but note, changes of any specified parameters in these files can dramatically affect the
 sensor results and accuracy. It is recommended to create a backup file of the initialization files before
 changing.

 The initialization files5 are saved on the hard disk in the directory
 ‘C:\Users\user\AppData\Roaming\ams-OSRAM\AAS7343 Demo” after the installation of the GUI. In
 the case of an AAS7343 demo with an onboard EEPROM the parameters from all initialization files
 are located in the EEPROM and are loaded from there.

 ● ‘Init_file.txt” - necessary for all the GUI functions. It includes values to control functions and
 limitations, e.g. sensor signal correction, light detection.
 ● ‘CM_x1_v1_0_0.csv” – Correction matrices for x = L Light measurement and x = R Reflection
 mode.
 ● ‘Mask_x_v1_0_0.csv” – Database for x=L Spectral Mask Compare (Light measurement)
 and x=R Color Recognition (Reflection mode).

 Comments are not considered by the GUI and can be done as any comment in all initialization files
 with the characters ‘//’ at the beginning of a line.

 All initialization files must be checked/adapted/changed before the GUI starts running. The GUI will not
 consider adapted parameters in these files by active running GUI. It will not change the initialization
 files or correction matrix files but adapt or create mask files in case this function is active and a new
 mask is created and saved. Check your adaptations of these files if the GUI prints out a syntax error.
 The syntax and format of all parameters are fixed and are depend on the MS Window region on the
 computer used.

6.1.1 Init_file.txt

 ‘Init_file.txt” can include the following commands and parameters.
 ● xxxxxxFile: xxxxxx.csv: are the standard or user-defined files for calibration (see the previous
 section), spectral compare, and other functions, which are used by the GUI as input files (in
 case of no EEPROM hardware version). Otherwise, the GUI will generate a file selection dialog
 box to select these files after choosing the application light or Reflection mode.
 ● ChannelOrder={Fx;F…}: defines the channel assignment as used in the GUI for all correction
 values and in the input data from the channel order (default is
 F1;F2;FZ;F3;F4;FY;F5;FXL;F6;F7;F8;NIR;VIS)

 5
 Change the AppData directory properties in case the directory or subdirectories are not visible or read-only.

Eval Kit Manual • PUBLIC
UG001009 • v1-02 • 2022-Jan-10 57 │ 19
Document Feedback AS7343 Software ● ‘Offset’: Use this to correct constant issues in the sensor setup for tests. The specified values for the single channels F1 to F8, Clear, and NIR in the Init_file will be added/subtracted from Basic_Count after gain correction. The result will be the corrected count. Therefore, offset must be specified in the form of gain-corrected Basic_Counts (see Figure 32). Use the offset correction, for example, to compensate for ambient light, optical overcrossing, or other constant deviations. The offset in the Init_file refers only to all functions in the basic window. The offset for ALS and Reflection Mode is defined in the calibration data files separately. If not mentioned in the calibration files, offset will be used from the Init_file or can be measured and set by CTRL+O key combination6. When offset values are not defined in any of the files, the default value zero is considered for each channel. ● ‘CorrectionFactor’: Is the scale sensor response by multiplication of the single Correction Factors (=balancing). The specified factors for the single channels will be multiplied (see Figure 32). Use this correction factor as vector for customized calibration (see chapter 5), e.g. to compensate for the effects of diffusers or other balance operations. The correction factor in the Init_file only refers to the functions in the basic window. The correction factors for ALS and Reflection Mode are defined in the calibration data files separately. If not mentioned in these files, it will choose from the Init_file. When the correction factors are not defined in any of the files, the default value ‘1’ is taken for each channel. ● ‘CorrectionGain’: (Vector Based – see Figure 20) Use this to correct the GainError. The given numbers per gain stage are used for all channels as averaged correction value. When the correction parameters for gain are not defined in the Init_file, the default value ‘1’ is taken for each channel and gain. Figure 20: Example Correction Gain Vector – For Gain = 0.5 The Value 1.05 Is Used For All Channels // The correction factor (averaged values in vector) for gain error // Averaged values for each gain stage // 0.5x;1x;2x;4x;8x;16x;32x;64x;128x;256x;512x;1024x;2048x CorrectionGain=1.06792;1.06715;1.05953;1.05246;1.09292;1.09269;1.08115;1.07461;1.0 6792;1.05969;1;1.01668;0.98010 ● ‘Gain;’: (Matrix Based – see Figure 21) Use this to correct the GainError. The given numbers per gain stage are used for all channels as averaged correction value. When the correction parameters for gain are not defined in the Init_file, the default value ‘1’ is taken for each channel and gain. 6 In this case, the latest measured sensor results will be used as the offset. It will temporarily overwrite all other defined offset values until the GUI is stopped, and the process asks to save the new offset in the init_file or EEPROM. Eval Kit Manual • PUBLIC UG001009 • v1-02 • 2022-Jan-10 57 │ 20
Document Feedback AS7343
 Software

 Figure 21:
 Example Correction Gain Matrix – For Gain = 64 And Channel F1 The Value 1.05 is Used

 // The correction factor matrix for gain error;;;;;;;;;;;;;
 Gain;//F1;F2;FZ;F3;F4;FY;F5;FXL;F6;F7;F8;NIR;VIS
 0.5;1;1;1;1;1;1;1;1;1;1;1;1;1
 1;1;1;1;1;1;1;1;1;1;1;1;1;1
 2;1;1;1;1;1;1;1;1;1;1;1;1;1
 4;1;1;1;1;1;1;1;1;1;1;1;1;1
 8;1;1;1;1;1;1;1;1;1;1;1;1;1
 16;1;1;1;1;1;1;1;1;1;1;1;1;1
 32;1;1;1;1;1;1;1;1;1;1;1;1;1
 64;1.05;1.05;1.05;1.05;1.05;1.05;1.06;1.05;1.05;1.05;1.05;1.05;1.05
 128;1.05;1.05;1.05;1.05;1.05;1.05;1.05;1.05;1.05;1.05;1.05;1.05;1.05
 256;1.03;1.03;1.03;1.03;1.03;1.03;1.03;1.03;1.03;1.03;1.03;1.03;1.03
 512;1;1;1;1;1;1;1;1;1;1;1;1;1
 1024;1.03;1.03;1.03;1.04;0.99;1.03;1.02;0.99;1.02;1.04;0.99;1.02;0.99
 2048;0.99;0.98;0.95;0.99;0.93;0.96;1.01;0.94;1.01;1.03;0.93;1.00;1.04

 ● ‘MaxAutogain’: Use this to define a maximum for gain in the mode automatic setup optimization.
 The specified value will be used as an initialization value but can be changed in the GUI.
 ● ‘MaxAutoTINT’: Use this to define a maximum for TINT in the mode automatic setup
 optimization. The specified value will be used as an initialization value but can be changed in
 the GUI.
 ● ‘Corr_lx’: Conversion factor from Y (based on the calculated XYZ from the corrected spectrum)
 to Y(lx). This factor affects only the output of the results for Y(lx) in light detection. If not stated
 in the initialization file, the default value is ‘683’.
 ● ‘Limit_mask’: Will limit the wavelengths for diagram output and Spectral Mask Compare. The
 lower and upper limits of the wavelength are considered. By default, the value ‘381’ is taken as
 the lower limit, and ‘781’ is taken as the upper limit.
 ● ‘Limit_Delta_xy’: XYZ masks with a higher ‘Delta_xy’ than defined here will not be recognized.
 ● ‘Limit_Compare’: Spectral masks with a higher deviation in percent than defined here will not be
 recognized.
 ● ‘NIR_Correction’: Activate the Dynamic NIR compensation algorithm for light detection and
 Spectral Mask Compare – should be used for Light Detection but not for Reflection mode. If not
 declared in the file, the default value ‘ON’ is taken into consideration from the Main Tab.
 ● Limit_Hg_Factor: The ratio of the corrected counts between the channels FY and F5 is checked
 for the value defined here. If the ratio is smaller than the defined value (typ. = 3), then there is
 probably a peak at 546nm Hg+ and the last measurement is a fluorescent light source (peak is
 then displayed symbolically in the reconstructed spectrum in the diagram).
 ● ‘Delta_uv’ / ‘LowerLimit_u’ / ‘UpperLimit_u’ / ‘UpperLimit_v’ / ‘minCCT’ / ‘maxCCT’: Specifies the
 parameters, which are the conditions and limitations for CCT calculations in light detection.
 These values directly affect the CCT calculation. When not mentioned in the Init_file the
 following default values are taken:

 Deltauv = 0.2000, LowerUlimit = 0.1807, UpperUlimit = 0.3988, LowerVlimit = 0.3624,
 UpperVlimit = 0.5408, MinCCT = 2000, MaxCCT = 7000

Eval Kit Manual • PUBLIC
UG001009 • v1-02 • 2022-Jan-10 57 │ 21
Document Feedback AS7343
 Software

6.1.2 Calibration_matrix_file

 The calibration matrices are CSV files, which include correction and calibration data for application-
 specific analysis – ALS Light Detection and/or Reflection mode:
 ● ‘LEDCurrent’: Only for Reflection mode, these values will be used for actual measurements.
 ● ‘LEDxxx’: Toggle LED on/off (xxx=[Left, Top, Bottom]).
 ● ‘CorrectionWhiteBalance’: Can be used for balancing calibrated XYZ values from the
 reconstructed spectrum to white or another usual target.
 ● ‘CorrectionGain’: (Vector and Matrix Based – see chapter 6.1.1
 ● ‘WaitTime’: This is defined in the GUI as waiting time between two measurements in ms and
 possible steps in 10 ms increments. The function does not use the WTIME (LONG) function of
 the sensor chip.
 ● ‘ReferenceWhiteBalance’: If a white balance is made in the GUI with the command ‘Ctrl+B’ - the
 GUI uses the comparison values XYZ to calculate the white balance.
 ● ‘CorrectionWhiteBalance’: If available, these values are generally applied as white balance and
 correction vector for XYZ.
 ● ‘ConversionXYZ2RGB’: Here, a general 3x3 matrix is specified for the conversion of the
 measured XYZ into RGB colors for the screen print in Reflection Mode.
 ● Calibration matrix: Will be used for the calibration process by matrix multiplication. A special
 syntax in the calibration file is used to define the calibration matrix (see ‘CM*.csv’ file after
 software installation in the directory for the initial data’s or later in this chapter).
 ● ‘Offset’: Use this to correct constant issues in the sensor setup for tests. The specified values
 for the single channels F1 to F8, Clear, and NIR in the Init_file will be added or subtracted from
 Basic_Counts after gain correction. The result will be Corrected_Counts. Therefore, offset must
 be specified in the form of gain corrected Basic_Counts (see Figure 32). Use the offset
 correction, for example, to compensate for ambient light, optical overcrossing, or other constant
 deviations. Offset in the Init_file refers only to all functions in the basic window. The offset for
 ALS and Reflection Mode is defined in the calibration data files separately. If not mentioned in
 calibration files, offset will be used from the initialization files, or can be measured and set with
 ‘CTRL+O’ key combination7. When offset values are not defined in any of the files, the default
 value zero is considered for each channel.
 ● ‘Correction Factor’: This is the scale sensor response by multiplying the single Correction
 Factors (=balancing). The specified factors for the single channels F1 to F8, Clear, and NIR in
 the Init_file will be multiplied (see Figure 32). Use this correction factor for customized
 calibration (see chapter 5), e.g. to compensate for the effects of diffusers or other balance
 operations. The correction factor in the Init_file only refers to the functions in the basic window.
 The correction factors for ALS and Reflection Mode are defined separately in the calibration
 data files. If not mentioned in these files, it will choose from the Init_file. When correction factors
 are not defined in any of the files, the default value ‘1’ is taken for each channel.

 7
 In this case, the latest measured sensor results will be used as an offset and temporarily overwrite all other defined offset values
 until the GUI will be stopped and the process asks before to save the new offset in the Init_file or EEPROM.

Eval Kit Manual • PUBLIC
UG001009 • v1-02 • 2022-Jan-10 57 │ 22
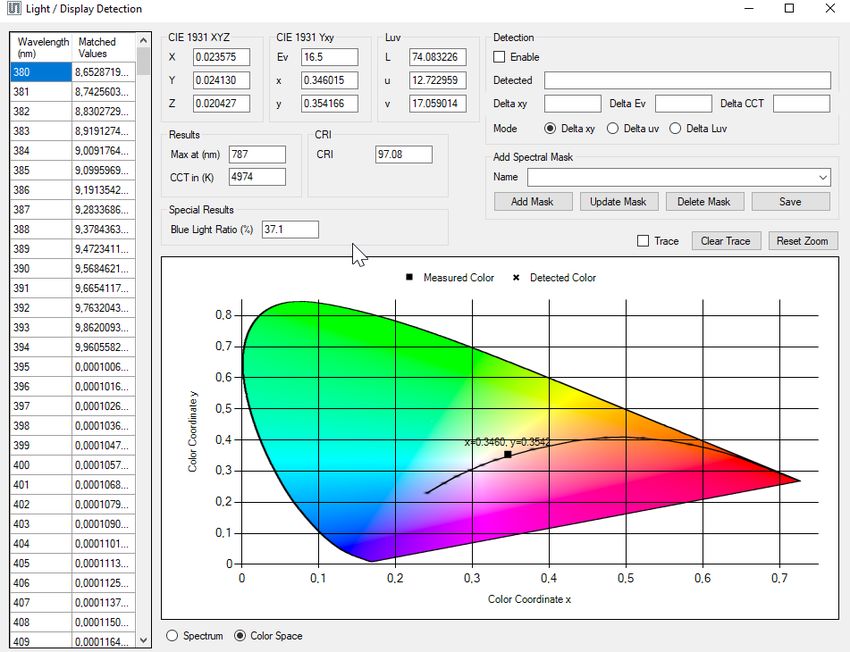
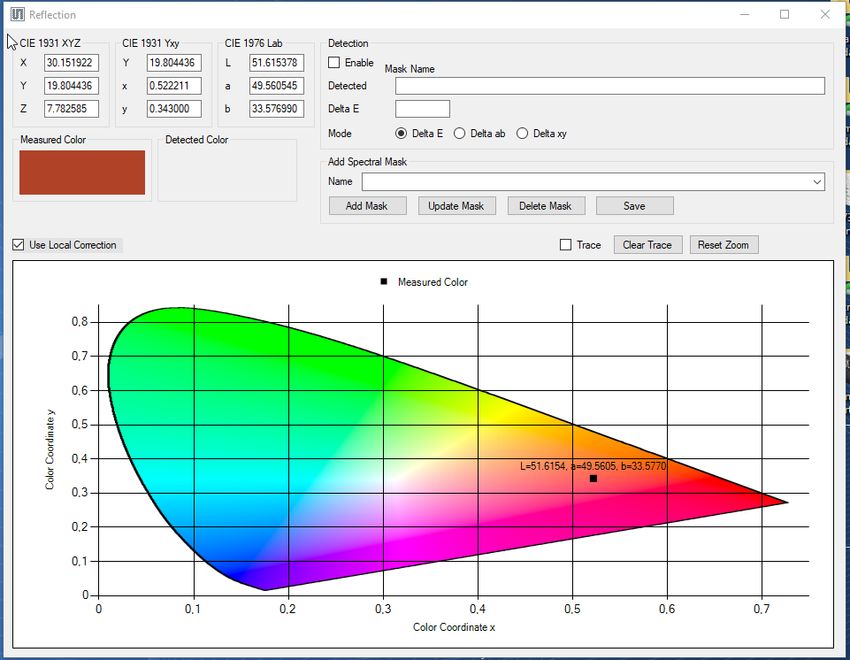
Document Feedback AS7343
 Software

 Information

 Here, defined parameters replace the specified values from ‘Init_file.txt’ (see chapter 6.1.2).

 The calibration matrices are part of the software setup and represent general solutions for
 demonstration of the Evaluation Kits. They are based on the specified AS7343 filter definitions,
 components on the evaluation kits, and the existed conditions during calibration. They do not consider
 any real existing series deviations. Therefore, deviations in the sensor results compared with
 spectrometers are possible8.

 In spectral matrices, the maximum and minimum of the used wavelengths and step sizes determine
 the dynamic (min and max) and spectral steps of the reconstructed spectrum. In general, the
 calibration matrix determines the dimension of the corrected vector values after matriculation
 according to the mathematical rules for matrix multiplication.

6.1.3 Mask_files

 A spectrum in ALS Light Detection can be used to detect the type of luminary or to calculate CIE1931
 xyz standard values, xyz, uv, Y (lux), CCT, and CRI. In Reflection mode, the result of the comparison
 can be a recognized and/or identified color in the CIE1931 color space. The aim is to identify the
 measured quantities in a set of defined masks in all applications. Such masks are defined in the file
 ‘Mask_x_v1_0_0_.csv”. These masks were predefined in a format, which must also be used in the
 calibration file (XYZ or spectrum). The dimensions of the mask file depend on the corrected sensor
 values and calibration matrix CM. Changes in the CM make it necessary to adapt the mask file.

 The process for Spectral Mask Compare is a simple algorithm based on the sum of standard
 deviations by comparison of each wavelength of two normalized spectra, the reconstructed spectrum
 from the last measurement with a masking spectrum from the Mask Compare database. Each mask
 will be checked in its dimensions (wavelengths or Tristimulus values; strictly the data from the mask
 file are taken) for deviations from the actual sensor values. The recognized result is the mask with the
 smallest deviation given in the mask file, or the process will stop without recognition in case of all
 calculated deviations are greater than ‘Limit_Compare’ from the Init_file. It is possible to create or
 adapt the mask file in the GUI. See chapter 6.8. for more details.

 The GUI uses the calibration and mask files from the standard installation or selected by the user with
 a pop-up selection window. Users can teach or also add spectral masks in case of the selection of
 ALS or Reflection mode. The new spectral mask data are saved into the previously selected mask’s
 CSV file.

 8
 Calibration, effort, and accuracy always depend on customer-specific requirements. Use alternative calibration methods to
 increase accuracy in general. A device to target calibration, where sensor and reference values are calculated to get the device-
 specific Calibration matrix, will achieve the highest accuracy. A good compromise between effort and accuracy is to use the
 general calculation matrix with a peak adjustment to a Golden device before.

Eval Kit Manual • PUBLIC
UG001009 • v1-02 • 2022-Jan-10 57 │ 23
Document Feedback AS7343
 Software

 Figure 22:
 Example Of A MaskFile for Ambient Lighting

6.1.4 Temperature Compensation File

 If the sensor board supports temperature correction with an on-board temperature sensor and if the
 temperature per channel is to be corrected, the option can be actively selected for correction in the
 GUI. In this case, it opens a selection window for selecting the temperature compensation and the
 corresponding file. The file in CSV format contains in column 1, the temperature in °C, and the
 correction values for the all sensor channels in the following columns. The temperatures must be
 entered in an orderly sequence ‘from low to high’ in range per line for one temperature.

 Figure 23:
 Activated Temperature Compensation In GUI – Main - Tab

6.2 EVM Graphical User Interface
 Connect the sensor board hardware to the system via an FTDI cable and double-click the software
 icon to open the GUI. If there are more than two FTDI cables connected to the computer, a pop-up
 window will appear, as shown below in Figure 24. Please select the correct cable used for the sensor
 board and click OK. If there is only one FTDI cable, the software will automatically select the cable

Eval Kit Manual • PUBLIC
UG001009 • v1-02 • 2022-Jan-10 57 │ 24
Document Feedback AS7343
 Software

 connected. When the connection is good, the bottom section in the GUI will display the positive status
 of the FTDI connection, FTDI cable series number, auxiliary sensor ID, revision, and part number.

 Figure 24:
 Window For FTDI Cable Selection If Multiple FTDI Cable Connected

 Check the part number, including any 0x-code, in case of any issues. A code 0x zero indicates no
 connection to the sensor hardware. In case of a problem, check the USB driver installation and
 connections start the software again, or use the scan function in the menu File. The GUI will
 automatically open when launching the software. If no device is connected, an error message will pop
 up. When the GUI starts showing a red indicator at the bottom section of the FTDI connection, connect
 a device, navigate to the ‘File’ window in the top corner of the GUI, and click ‘Scan and Connect’. The
 GUI will relaunch with the device connected. Use the ‘Disconnect’ button to terminate the connection.
 Click the ‘Exit’ button to end the GUI application.

6.3 Hot Keys
 The following hotkeys as ‘CTRL-functions’ are inserted in the GUI. Alternative, the ctrl-functions are
 implemented as context menu which can be opened by clicking the right mouse button in the main tab.

 Figure 25:
 Commands Evaluation Kits And Demonstrators)

 CTRL function Description

 Start detection logging (only active in case of using ALS or reflection
 Ctrl + A
 mode)
 Use XYZ reflection XYZ from last shot as white balance (only active in
 Ctrl + B
 case of using reflection mode)
 Stop Script Processing (only active in case of using trace mode and
 Ctrl + C
 activated process)
 Disable EEPROM, GUI uses data directly from directory (EEPROM
 Ctrl + D
 commands only active for EEPROM compatible devices)

Eval Kit Manual • PUBLIC
UG001009 • v1-02 • 2022-Jan-10 57 │ 25
Document Feedback AS7343
 Software

 CTRL function Description

 Initialize or re-write EEPROM with the files from directory (EEPROM
 Ctrl + E
 commands only active for EEPROM compatible devices)
 EEPROM clear (EEPROM commands only active for EEPROM
 Ctrl + F
 compatible devices)
 Write initialization data from memory to EEPROM or initialization file
 Ctrl + I
 (EEPROM commands only active for EEPROM compatible devices)
 Save Log9 file during the active session (only active in case of using ALS
 Ctrl + L
 or reflection mode)
 Read a new calibration file (only active in case of using ALS or reflection
 Ctrl + M
 mode)
 Ctrl + O Use Basic_Counts with gain correction from last shot as offset values
 Ctrl + R Read mask file (only active in case of using ALS or reflection mode)
 Save detection logging (only active in case of using ALS or reflection
 Ctrl + S
 mode)
 Readout initialization files from EEPROM to the directory (EEPROM
 Ctrl + W
 commands only active for EEPROM compatible devices)
 Ctrl + Z Make a screenshot from a diagram
 Ctrl + left mouse
 Zoom-in diagrams
 button

 Figure 26:
 Use The Context Menu ‘Ctrl-Function’ (Click Right Mouse Button In Main Window To Open It)

 9
 Set in file AS7343_Demo.config in the user directory the option to activate log files.

Eval Kit Manual • PUBLIC
UG001009 • v1-02 • 2022-Jan-10 57 │ 26
Document Feedback AS7343
 Software

6.4 Sensor Board Test
 To check the function of the EVK, start the measurement by pressing the ‘Read Once’ button (see
 Figure 27). One measurement step will be executed using ‘Easy Mode. It should show measured
 values in the table based on the sensor’s location to a luminary in front of the sensor and its spectrum
 in another window. Change the mode to ‘Expert Mode’, adjust the Integration time and gain, to change
 the digits based on application requirements. More details about sensor functions and the parameters
 are listed in the sensor’s datasheet or later in this manual. Select one of the plot options, ‘Line Graph’
 or ‘Spectrum’ to see the results (Corrected_Counts) as graphical output. Table shows the ‘RAW’,
 ‘Basic’, and ‘Corrected’ values. Check the given results on reasonableness and logic. Normally in
 Easy and Expert mode, by default, the optimization for Gain and Integration time is switched-on. In
 Expert mode, optimization can be turned off to increase the parameters for conversion in case of zero
 digits or decrease in case of saturation.

 An increase/decrease should change the counts and values in the table or diagrams. Look for the
 printed values and check them with the specified commands and parameters in the Init_file to ensure
 that the GUI works well with all the initialization files.

 Figure 27:
 First Sensor Board Test – Output Of First Results In Main Tab(1)

 (1) Filter names may vary

 Always check the stability of a test setup before the actual measurements begin. Set the target to its
 minimum and maximum to check the required dynamic range. Make sure the parameter setup for gain
 and integration time can realize the full dynamic range. Verify any potential drifts like temperature
 effects and interferences like ambient lighting, which affects measurements. Verify and delete or
 compensate for all effects before starting measurements for accuracy.

6.5 Offset Compensation
 Offset is an effect that should be corrected at the beginning after completion of the setup and definition
 of all sensor parameters to obtain the best possible sensor results. In Reflection mode, such an offset
 is caused, for example, by direct irradiation of the LEDs via the optics onto the sensor. This offset is
 measured directly with the 'set and switched on' LEDs as the sensor result without target (reflection) in

Eval Kit Manual • PUBLIC
UG001009 • v1-02 • 2022-Jan-10 57 │ 27
Document Feedback AS7343
 Software

 front of the sensor; for example, a setup where the sensor looks into a dark room with activated
 LEDs).

 In general, a measured value can also be defined as an offset in order to detect deviations from it as
 the actual signal. This is the case, for example, with backlight compensation, where extraneous light is
 first measured as an interference source and then compensated as an offset from the actual
 measured signal. Figure 28 shows a measurement result as RAW value (black), Basic_Counts (blue),
 and Corrected_Counts (red, with preset standard offset for the kit in correction), where the sensor
 measures into a dark room with the activated LEDs.

 Although no result is expected from a target in reflection, the sensor naturally shows digital counts as
 a result, which are caused by internal reflections directly from the LED to the sensor. This error, as the
 offset, is constant with and without a target, independent of the color the sensor later measures. Since
 the red line is not on the zero line directly, the preset offset must be corrected nor not, depending on
 its absolute size and required accuracy.

 Figure 28:
 Sensor Results Without Correct Offset Correction (See Red Line)

 In general, this correction can be carried out by sensor steps without an offset definition, and entering
 these values as offset in the INIT file. Alternatively, use ‘CTRL+O’, to directly measure Offset, and/or
 ‘CTRL+O’ will start a measurement, and the measured values will be used as Offset. Then, the GUI
 will ask to save this Offset into the Init_file before the GUI is closed. If noise causes negative values
 due to offset compensation, the spectrum is automatically shifted to the positive by the GUI to prevent
 negative partial spectra.

Eval Kit Manual • PUBLIC
UG001009 • v1-02 • 2022-Jan-10 57 │ 28
Document Feedback AS7343
 Software

 Figure 29:
 Sensor Results With Correct Offset Correction (Corrected Values Are On Zero Curve)

6.6 Operation Mode
 The GUI has two modes of operations – Easy and Expert mode. By default, Easy mode is selected.
 Users can switch modes by selecting the radio button of Expert mode. In Easy mode, most of the
 parameter settings are automatically set. The user has limited permission to make modifications of
 parameter settings in Easy mode. The parameters like Gain, Integration time, LED settings, channel
 configuration etc. cannot be changed in Easy mode.

 However, optimization of gain and integration time is active during the ‘Easy mode’ measurements.
 Easy mode has limitations and restrictions in the application-specific analysis window. Expert mode
 overcomes all restrictions in Easy mode. Users can control all parameter settings in Expert mode. In
 this mode, the optimization of max AGAIN and Max TINT to control the gain and integration time is
 automatically turned off.

 Switch them on manually to use it in Automatic mode. For operating the GUI in Expert mode by
 default, users can use the ‘xxx Demo Version.bat” batch file with the below command and execute the
 file in

 ‘C:\Program Files (x86)\ams-OSRAM\AS7343 Demo’

 or creating a shortcut icon of this batch file in desktop.

 The software version can be edited with this batch file.

 Start ‘...\AAS7343_Demo_Software.exe’ –Expert – Version=x.xx.00.

Eval Kit Manual • PUBLIC
UG001009 • v1-02 • 2022-Jan-10 57 │ 29
Document Feedback AS7343
 Software

6.7 Main Tab
 The Main Tab in Expert mode contains the user interface with control buttons, fields, selection boxes,
 and output values for the identified device connected. The Main Tab permits the configuration of the
 sensor device and initializes the default setting to the devices. It allows the user to modify and
 configure the integration time setting, gain setting, LED setting, ‘AutoZero’, ‘Dynamic Conversion’
 (Optimization), and some other application-specific sensor functions and demos.

 Figure 30:
 Main Tab GUI

 Information

 The higher the counts (before saturation), the better the accuracy. Changing gain or TINT will affect
 counts. Both parameters will have different effects like FSR, noise, linearity’s, time, and others.

 Integration Time (TINT): Integration time is one parameter to affect the sensor result (= digital counts
 or digits). The Integration time directly affects the saturation (FSR 16-bit = 2^16 is reached for the first
 time at 182 ms = 2.78 µs * 2^16). The Integration time is set using ATIME (0x81) and ASTEP (0xCA,
 0xCB) registers. The Integration time is displayed in milliseconds. It is calculated using the equation –

Eval Kit Manual • PUBLIC
UG001009 • v1-02 • 2022-Jan-10 57 │ 30
Document Feedback AS7343
 Software

 Equation 1:

 1 1 2.78 μ .

 GUI uses Integration Time ‘TINT’ parameter in ms.

 The Integration time ‘TINT’ parameter, like the ‘ATIME’ and ‘ASTEP’, can be set by clicking the up or
 down arrow button. ATIME sets the number of integration steps from 0 to 255. Set the ‘Integration
 time’ per step in increments of 2.78 μs. ASTEP sets the Integration time from 1 to 65534 steps. The
 default configuration in the GUI for these two registers are ASTEP = 0 and ATIME = 65534, which
 results in an Integration time of 182 ms. The Sensor specification does not allow both settings –ATIME
 and ASTEP – to be set to 0.

 The integration time has a significant influence on the measurement time, since several measurement
 cycles with the defined integration time are needed in one measurement. This is due to the limited
 ADC channels on the sensor chip and that several cycles must be converted over the integration time
 to digitize all optical channels (number greater than ADC channels – factor 2 …3 depending on the
 selected channels for output).

 On the other hand, when using the automatic gain, at least two measurements (over several cycles)
 are necessary to determine the optimized parameters for the ADC. Considering these facts, the
 measuring time of a measurement is very fast a multiple of the integration time tint (Measuring time >
 2 x (3 x tint)). Therefore, the software calculates the expected measurement time based on the
 settings and displays the measurement progress as a loading bar or writes out a warning if the
 measuring time is longer than one second.

 Figure 31:
 Calculated Measuring Time And Loading Bar In Main Tab If Measuring Time > 1 sec

 Gain is the second parameter to affect the Sensor result (= digital counts). The Gain control ‘AGAIN’
 allows the user access to the Gain settings in the 0xAA Register (4:0 bits). The Gain amplifies the
 signal of the six integrated ADCs to increase sensitivity by switching to a higher Gain value. The Gain
 options include eleven alternative Gain stages between 0.5x and 512x. Select these options from the
 list box when the down arrow is pressed.

 Enable Optimization: An algorithm of the GUI will be switched on, which analyzes the sensor output
 and parameter setting to find an optimal ADC parameter, set for gain and TINT at given maximum
 values. The target for optimization is to achieve a maximum number of digits at high accuracy.
 Usually, measurements in noise and saturation should be prevented by using this mode. By default,
 this is ON in case of Easy mode and OFF in case of EXPERT mode. Optimization of gain is enabled
 by checking Max AGAIN and denoting the maximum gain value to be considered in the list box
 besides the checkbox. Similarly, optimization of Integration time is enabled by checking Max TINT and
 mentioning the maximum value to consider in the list.

Eval Kit Manual • PUBLIC
UG001009 • v1-02 • 2022-Jan-10 57 │ 31
Document Feedback AS7343
 Software

 Wait Time: It is defined in the GUI as the waiting time between two measurements in ms and possible
 steps in 10 ms increments. The function does not use the WTIME (LONG) function of the sensor chip.

 LED Setting (LED Current): If LEDs are mounted on the sensor board for Reflection mode, enable
 the switch on the LED and set LED currents. The current can be set using the up-down control. It has
 a range of 1% up to 100% of the supported LED current10. Activate Flash mode if the LED is only
 switched-on during the measurement process.

 Auto Zero: Sets options and the frequency at which the device performs auto zero of the spectral
 engines to compensate for changes in the device temperature.

 SMUX Configuration: The device integrates a multiplexer (SMUX). With the SMUX, it is possible to
 map all available photodiodes to one of the six available light-to-frequency converters (ADCx). After the
 power-up of the device, the SMUX needs to be configured before a spectral measurement begins. Here
 in the GUI, SMUX is pre-configured to work with all spectral channels, exclude VIS and NIR which can
 be selected separately.

 Measurement Setting: Select Read Once or Read Continuous to measure systematically or in
 Continuous Mode (alternative with a specified number of steps), and/or to stop a Continuous Mode
 after n steps. The ADC results are printed after each measurement as numeric values presenting
 RAW_Counts or calculated Basic_Counts or Corrected_CountsValue.

 Raw_Counts: Raw_Counts represent the counts from the ADC depending on the setup used (SMUX
 Configuration, Offset, Gain, Integration time, LED-current, etc.).

 Basic_Counts: The Basic_Counts are calculated based on the RAW measurement values and the
 corresponding Gain and Integration time at that time - to get sensor results not dependent on the
 parameter setup (Gain, TINT).

 Equation 2:

 _ Raw_Counts / Gain ∗ TINT

 Corrected_Counts: These are the results of calculations based on specified parameters in init_list,
 e.g. Gain_Correction” or Correction_Factor and Offset

 Equation 3:

 _ _ ∗ _ ∗ _

 Figure 32 shows the used data flow and shows the order make corrections.

 Select Line Graph or Spectrum if the sensor results as RAW, Basic, or Corrected_Counts, they should
 be presented as diagrams. The diagram window include some functions to adapt the graphical output

 10
 LED current, light intensity and/or maximal driver current are depending on the used LEDs and connected power supply. Check
 the LED datasheet before using this LED setting. A very high LED current can destroy the LEDs.

Eval Kit Manual • PUBLIC
UG001009 • v1-02 • 2022-Jan-10 57 │ 32
You can also read