Photovoltaic Qualification and Approval Tests - MDPI
←
→
Page content transcription
If your browser does not render page correctly, please read the page content below
Review
Photovoltaic Qualification and Approval Tests
Andrés Firman * , Manuel Cáceres                     , Alexis Raúl González Mayans             and Luis Horacio Vera

                                          Renewable Energy Group, Northeast National University UNNE, Corrientes W3400BCH, Argentina;
                                          mcaceres@exa.unne.edu.ar (M.C.); raulgonzalezmayans@exa.unne.edu.ar (A.R.G.M.);
                                          luis.horacio.vera@comunidad.unne.edu.ar (L.H.V.)
                                          * Correspondence: afirman@exa.unne.edu.ar

                                          Abstract: This paper presents the main aspects of implementing a laboratory for testing qualification
                                          and approval related to crystalline silicon terrestrial photovoltaic devices. In this aspect, a simplified
                                          review-based IEC 61215 standard methodology for mechanical and electrical tests is presented
                                          from a practical-experimental view. The instrumental requirements and uncertainties are discussed.
                                          Specially focused on the nowadays high-size PV modules.

                                          Keywords: photovoltaics; tests; standard

                                          1. Introduction
                                               This work aims to help manufacturers understand the key concepts and standards
                                          involved in the photovoltaic (PV) module certification. In this manner, previous verifica-
                                          tions can be made before appealing to an accredited laboratory for its final certification.
                                          All procedures and the main concepts are presented condensed in an easy-to-read and to
                                          understand guide in order to be useful for readers to quickly identify relevant information.
                                     Throughout this paper, it is considered the reader is familiar with the electrical, me-

                                          chanical, and environmental quantities required to understand the standards described.
Citation: Firman, A.; Cáceres, M.;             The IEC 61215 standard [1] lays down requirements for the design qualification and
González Mayans, A.R.; Vera, L.H.
                                          type approval of terrestrial photovoltaic modules suitable for long-term operation [2]. This
Photovoltaic Qualification and
                                          paper describes the procedures referred to that particular standard and does not include PV
Approval Tests. Standards 2022, 2,
                                          modules used with concentrated sunlight, neither bifacial nor flexible technology, making
136–156. https://doi.org/10.3390/
                                          an effort to focus on typical crystalline silicon (C-Si) PV modules.
standards2020011
                                               This testing guide is considered from a practical point of view. Among the several
Academic Editor: Francesco Nocera         PV devices referred to in the standard, we will center on C-Si PV modules of several
                                          Watt-peak because these are the most commonly available in the actual market [3]. The
Received: 20 January 2022
Accepted: 28 February 2022
                                          method employed in each test is the easiest to implement or is typically implemented in
Published: 21 April 2022
                                          PV modules from tens to hundreds of Watt-peak.
                                               Thus, this paper exposed the main aspect presented in the IEC 61215-2 standard [4],
Publisher’s Note: MDPI stays neutral      where all these tests are precisely detailed, following an ordered sequence and test proce-
with regard to jurisdictional claims in
                                          dures. Here, we include advice from our practical experience getting from implementing
published maps and institutional affil-
                                          them. We do not intend to review the different ways to perform specific tests. Otherwise,
iations.
                                          we point to re-order and re-write the concepts presented, assisted with simple graphics.
                                               Passing these tests, we can assume the PV module can withstand prolonged weather
                                          exposure. Further, from this, reliable technical information is extracted [5]. Thanks to the
Copyright: © 2022 by the authors.
                                          implementation and application of the mentioned standard, the actual market may adopt
Licensee MDPI, Basel, Switzerland.        20 or more years of warranty in their products [6].
This article is an open access article         For further details, we highly recommend evaluating the original text.
distributed under the terms and
conditions of the Creative Commons
                                          2. Preparation
Attribution (CC BY) license (https://         It is recommended each PV module must have a clear and unique identification and
creativecommons.org/licenses/by/          must be time perdurable—this is helpful for further references or test repetitions. The label
4.0/).                                    must highlight the manufacturer’s logo or name, following the model and serial number.

Standards 2022, 2, 136–156. https://doi.org/10.3390/standards2020011                                     https://www.mdpi.com/journal/standards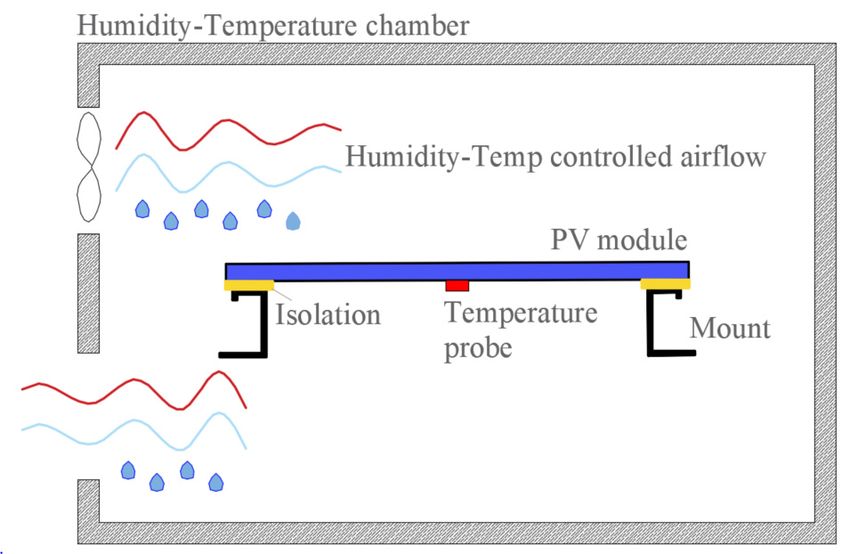
Standards 2022, 2                                                                                               137

                         The absolute maximum ratings can be labeled too (if they are known); otherwise, it
                    must be verified before the testing starts by a sector manager in order to avoid electrical or
                    mechanical risks.
                         First of all, as is indicated in the IEC 61215-2, the PV module must be submitted
                    through a so-called “preconditioning process” (see Test 19). This process suggests the
                    module in open circuit condition must be under solar radiation, natural or artificial, into
                    the range of 5 kWh/m2 to 5.5 kWh/m2 . In other words, if we assume a mean irradi-
                    ance of 800 W/m2 , we must leave the module for about 7 h to achieve the energy level
                    recommended.
                         Finished the preconditioning process, the tests can start. The latest mentioned IEC
                    standards [4] lists 21 tests that can be carried out, and several of them, to ensure good
                    performance in its service life. The following sections describe this set of tests in detail.
                         Each of the modules must successfully pass the so-called test criteria. The principal
                    aspect related to the pass criteria are:
                    •    The maximum power output must be in the range indicated by the manufacturer and
                         does not present a difference higher than 8% between tests.
                    •    The module does not exhibit any open-circuit state or insulation deficiencies when a
                         test is performed.
                    •    It must pass a visual inspection. This inspection is related to “major visual defects” [7]
                         that can be detected by a trained operator, involving: broken, bent, misaligned cells,
                         frame or junction boxes, defects related to glue or substrate (such as bubbles or
                         delaminations).

                    3. Tests
                         The objectives to be achieved with each test, the hardware used for it, the methodology
                    to be followed, and the pass condition are described below.

                    3.1. Test 01—Visual Inspection
                         This test is in the easy difficulty level and does not necessarily require complex
                    equipment or apparatus to carry out.
                         Objective. Look for visible defects in the module, including cells, frame, junction box,
                    cables, glue, encapsulating, and so on, carrying out an analysis of all constructive aspects
                    of the PV module.
                         Hardware. To carry out this test PV module must be carefully observed under light
                    with an intensity of at least 1000 lux [8].
                         Methodology. A close examination with the naked eye must be performed on the
                    whole of the module surfaces. The examiner must look for defects in the manufacturing
                    process. Although there is a large spectrum of flaws that can be found in a PV module, the
                    so-called major defects are:
                    •   Misaligned, broken, bent, or not correctly ensemble frames.
                    •   Adhesive bonds are not correctly positioned.
                    •   Broken or cracked cells. Interconnection improperly implemented.
                    •   Junction-box defects or exposed live electrical parts, or bypass diodes improperly
                        welding or installed.
                    •   Bubble detection or delamination, especially observed between frame and cells. This
                        type of defect can point out to an electrical isolation problem.
                    •   Any other manufacturing defect that can affect the PV module performance.
                         Some of the more common defects that might be found in the PV module are presented
                    in Figure 1. This figure shows a pair of misaligned PV cells, a cell with a bubble on it, and a
                    broken cell.
Standards 2022, 2, FOR PEER REVIEW 3
Some of the more common defects that might be found in the PV module are pre-
Standards 2022, 2 138
sented in Figure 1. This figure shows a pair of misaligned PV cells, a cell with a bubble on
it, and a broken cell.
Figure
Figure 1.
1. PV
PV cell
cell defects
defects illustration.
illustration.
The module
Pass. The
Pass. module isis approved
approved and
and passes
passes the
the test
test ifif any
any defects
defects (known
(known as
as major
major
defects) are not present.
defects) are not present.
3.2. Test
3.2. Test 02—Maximum
02—Maximum Power Power Determination
Determination
This test
This testprobably
probablyisisone one ofofthethe most
most sophisticated
sophisticated andand complicated
complicated to carry
to carry out. Itout.
is
It is necessarily a complex device and equipment simultaneously
necessarily a complex device and equipment simultaneously with a high level of personal with a high level of
personal preparation.
preparation. This determination
This determination is made is madeand
before before
afterand after
each each environmental
environmental test
test to de-
to determine any deviation. It is considered acceptable if the difference between the tests is
termine any deviation. It is considered acceptable if the difference between the tests is less
less than 5%. In most cases, the translation is carried out to the Standard Test Condition
than 5%. In most cases, the translation is carried out to the Standard Test Condition (STC)
(STC) (measured at 1002W/m2 , Tc = 25 ◦ C, and spectral distribution AM 1.5) [9,10], finding
(measured at 100 W/m , Tc = 25 °C, and spectral distribution AM 1.5) [9,10], finding out
out the nominal power delivered for the PV module or Watt-peak.
the nominal power delivered for the PV module or Watt-peak.
Objective. Found the module maximum power output under standard test conditions
Objective. Found the module maximum power output under standard test condi-
(STC), determining its power in Watt-peak. Find deviations related to environmental expo-
tions (STC), determining its power in Watt-peak. Find deviations related to environmental
sure.
exposure.
Hardware. First, a radiant source is needed. It can be natural or artificial sunlight as a
Hardware. First, a radiant source is needed. It can be natural or artificial sunlight as
class B solar simulator or better, according to IEC 60904-9 Classification of solar simulator
a class B solar simulator or better, according to IEC 60904-9 Classification of solar simula-
characteristics [11].
tor characteristics [11].
A PV reference cell or a PV reference module for irradiance determination. Preferably
it mustPV
A be reference
manufactured cell orwith
a PVthe reference
same cell module for irradiance
technology determination.
[12] to guarantee the same Preferably
spectral
itresponse.
must be manufactured
In some cases, with the same
an identical cell technology
third-party [12] to
calibrated guarantee
module maythe same spectral
be used.
response. In some cases,
A temperature sensor anor identical
probe must third-party calibrated
be attached to the module may be used.
module backside, right behind
a cell, with an accuracy of ±1 C and repeatability of ±0.5 C to determine theright
A temperature sensor or probe
◦ must be attached to the ◦module backside, behind
cell temper-
aature.
cell, with an accuracy of ±1 °C and repeatability of ±0.5 °C to determine
Usually, it is attached with tape and silicone grease [13] to assure proper thermal the cell temper-
ature. Usually,For
conductivity. it is attacheda with
example, PT100tape probe andis silicone
frequently grease
used[13]
[14].to assure proper thermal
conductivity.
ElectronicsForinstruments
example, ato PT100 probe is frequently
simultaneously measure theused [14]. and the voltage with an
current
accuracy of ±0.2% of the reading to obtain a data set suitable for its I–Vand
Electronics instruments to simultaneously measure the current therepresentation.
curve voltage with
an accuracy of ±0.2% of the reading to obtain a data set suitable
For example, a pulse train can synchronize these instruments with an external trigger for its I–V curve represen-
input,
tation. For example,
as described by [15]. a pulse train can synchronize these instruments with an external trig-
ger input, as described by [15].
The measuring range must be suitable to register the module Isc (short-circuit current)
and The measuring range
Voc (open-circuit must be
voltage). suitable
Often, to register
a calibrated the resistance
shunt module Iscis(short-circuit
used for indirect cur-
rent)
currentand Voc (open-circuit
determination. voltage).
The sweep time Often,
mustabe calibrated
fast enoughshunt resistance
to obtain is used
the entire for set
data indi-
so
rect
thatcurrent
irradiancedetermination. The sweep
and cell temperature cantime
be must be fastchangeless
considered enough to [16].obtain the entire
There data
are several
set so that
options irradiance
to do this sweep. and cell temperature can be considered changeless [16]. There are
several options to do
The sweep can mainly this sweep.
be implemented with a four-quadrant programmable source, a
The sweep
controlled can mainly
electronic load, orbea implemented
capacitive analog withload
a four-quadrant
[17–19]. programmable source,
a controlled
A rack orelectronic
mount to load, or a capacitive
support the module analog
underload
test [17–19].
and the reference cell.
A rack or mount
Conveniently, thetosupporting
support the moduleshould
structure under allow
test andthethe reference cell.
reorientation of the entire set
into the sun (or sun simulator) radiation normal to the incidence plane.
Methodology. The I–V curve must be traced between the cell temperature range of
25–50 ◦ C, and the irradiance level range of 700–1100 W/m2 . According to IEC 60904-1
“Measurement of photovoltaic current-voltage characteristics” [20], natural or artificial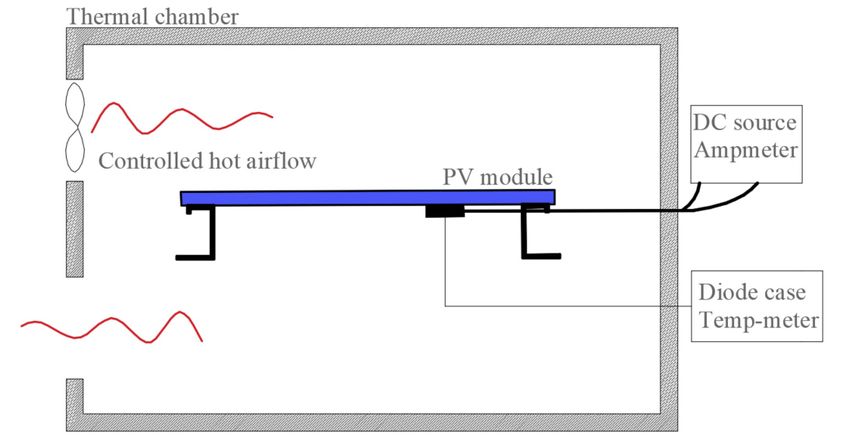
Conveniently, the supporting structure should allow the reorientation of the entire
set into the sun (or sun simulator) radiation normal to the incidence plane.
Standards 2022, 2 Methodology. The I–V curve must be traced between the cell temperature range 139 of
25–50 °C, and the irradiance level range of 700–1100 W/m2. According to IEC 60904-1
“Measurement of photovoltaic current-voltage characteristics” [20], natural or artificial
sunlight
sunlight can
canbebeemployed.
employed.ToToperform
performa comparison,
a comparison, thethe
maximum
maximum power-point
power-point must be
must
translated to the STC according to IEC 60891 [21], which indicates three
be translated to the STC according to IEC 60891 [21], which indicates three different different proce-
dures for irradiance
procedures and and
for irradiance temperature
temperaturecorrections
correctionsof of
thethecharacteristics
characteristicsI–V
I–Vcurve.
curve. The
The
methodological
methodological setupsetup for
for the
the maximum
maximum powerpower determination
determination test
test can
canbebeseen
seenininFigure
Figure2.2.
This
This figure
figure represents
represents the
the PV
PV module
module with
with the
the temperature
temperature probe
probe attached
attached to
to its
its backside
backside
and the reference
and the referencecell-attached
cell-attachedcoplanar
coplanartotoitsits frame.
frame. TheThe
“IV“IV tracer
tracer measure
measure unit”
unit” indi-
indicates
cates the set of instruments, control and commutation devices, and variable
the set of instruments, control and commutation devices, and variable load required for theload required
for
I–Vthe I–Vdata
curve curve data acquisition.
acquisition.
Figure
Figure 2. Methodological
Methodological setup
setup for
for maximum
maximum power determination test.
Among the proposed
Among proposedmethods
methodsmentioned
mentionedininthe IEC
the standard
IEC standard61215 (2016
61215 version)
(2016 [1],
version)
one is simpler to apply because it does not require correction parameters as input
[1], one is simpler to apply because it does not require correction parameters as input toto carry
out a linear
carry out a interpolation/extrapolation. Two I–V
linear interpolation/extrapolation. Twocurves
I–V are needed
curves to adjusttothe
are needed constant
adjust the
“a” value parameter and perform the translation, given in Equations (1)–(4).
constant “a” value parameter and perform the translation, given in Equations (1)–(4).
VV33==VV1 1+ +a(V 2 − V
a(V 2 −1)V1 ) (1)
(1)
II33==I1I1+ +a(Ia(I2 I−
2 − 1) I1 ) (2)
(2)
G3 = G1 + a(G2 − G1 ) (3)
Standards 2022, 2, FOR PEER REVIEW G3 = G1 + a(G2 − G1) 5
(3)
T3 = T1 + a(T2 − T1 ) (4)
T3 = Tbe
The pair (V1 , I1 ) and (V2 , I2 ) must 1 + a(T2 − T1)
chosen that the differences between the current (4)
2. Now,
valuesThe wesame
bepair
the onlyI₁)that
(V₁, need to difference
andthe translate
(V₂, I₂) mustthe temperature.
between
be chosen the theFrom
short
that the
circuit twobetween
values,
differences new
so I2curves
−the deter-
Isc2 −
I1 =current
Isc mined,
values
1 (seebe the same that the difference between the short circuit values, so I₂ − I₁ = using
apply
Figure 3). Equation
The (4)
subindex to find
in a
thesenew “a”
equationsvalue doing
denotes T₃
the = 25
values°C. Finally,
measured at the
Isc₂ −
same Equations
time. The(1) and
parameter(2), calculate
“a” is the
constant values
for for
the I and
whole V.
process of interpolation.
Isc₁ (see Figure 3). The subindex in these equations denotes the values measured at the
same time. The parameter “a” is constant for the whole process of interpolation.
Note that G₃ and T₃ cannot be independently chosen because it refers to linear inter-
polation, and therefore we only can translate to a different environmental condition over
a linear path. The problem to translate to any G y T condition can be solved by acquiring
four I–V curves and translating them three times, so:
1. From Equation (3), calculate the “a” value with G₃ = 1000 W/m2 from two I–V exper-
imental curves and perform the translation applying Equations (1) and (2). Next, cal-
culate the resulting temperature from Equation (4) for that I–V curve. Repeat the pro-
cess with the other two I–V experimental curves. Thus, we have two translated I–V
curves to 1000 W/m2 but different temperature values.
Figure
Figure3.
3.Method
Methodto
totranslate
translatean
anI–V
I–Vcurve
curveby
bylinear
linearinterpolation
interpolation within
within two
two measured
measured curves.
curves.
In consequence, this is the I–V curve for the desired condition of 1000 W/m2 and 25
°C. Finally, the maximum power point at STC can be calculated. This linear interpolation
procedure for a single point is shown in Figure 3, where the dashed line represents the
translated I–V curve.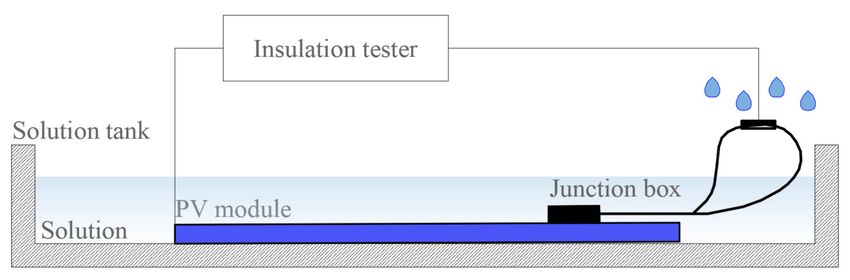
Standards 2022, 2                                                                                                            140

                                     Note that G3 and T3 cannot be independently chosen because it refers to linear inter-
                                polation, and therefore we only can translate to a different environmental condition over a
                                linear path. The problem to translate to any G y T condition can be solved by acquiring
                                four I–V curves and translating them three times, so:
                                1.     From Equation (3), calculate the “a” value with G3 = 1000 W/m2 from two I–V
                                       experimental curves and perform the translation applying Equations (1) and (2). Next,
                                       calculate the resulting temperature from Equation (4) for that I–V curve. Repeat the
                                       process with the other two I–V experimental curves. Thus, we have two translated
                                       I–V curves to 1000 W/m2 but different temperature values.
                                2.     Now, we only need to translate the temperature. From the two new curves determined,
                                       apply Equation (4) to find a new “a” value doing T3 = 25 ◦ C. Finally, using Equations
                                       (1) and (2), calculate the values for I and V.
                                     In consequence, this is the I–V curve for the desired condition of 1000 W/m2 and
                                25   ◦ C.
                                       Finally, the maximum power point at STC can be calculated. This linear interpolation
                                procedure for a single point is shown in Figure 3, where the dashed line represents the
                                translated I–V curve.

                                3.3. Test 03—Insulation
                                       From an electrical point of view, the insulation test is helpful to find out if the module
                                  is properly isolated. Hence, it prevents the risk of electric shock during its normal opera-
                                  tion [22]. Personnel also should avoid the risk of electric shock during its manipulation
                                  because of the voltages used during the test.
                                       Objective. Determine if the value of its insulation resistance is higher than 400 MΩ.
                                       Hardware. A high voltage DC power supply until 1000 V.
                                       An instrument to measure the insulation resistance. Practically, this hardware can be
                                  replaced by an insulation meter that includes a DC source and performs the test automatically.
                                       Methodology. First, the electrical output terminals of the PV module must be con-
                                  nected between them (short circuit). Next, connect one insulation meter probe to the cables
Standards 2022, 2, FOR PEER REVIEW                                                                                             6
                                  and the other ends to the module metallic parts (such as the frame) and energize it. Figure 4
                                  shows a schematic for the insulation test, highlighting the connection method.

                               Figure
                               Figure4.
                                      4.Schematic
                                         Schematicfor
                                                   forthe
                                                       theinsulation
                                                           insulationtest
                                                                      testand
                                                                          andconnection
                                                                              connection method.
                                                                                         method.

                                     Pass.
                               3.4. Test   The PV moduleofpasses
                                         04—Measurement          if the insulation
                                                           Temperature   Coefficientsresistance exceeds the value of 400 MΩ.
                                     This test allows finding the values of the temperature coefficients of the PV module
                                3.4. Test 04—Measurement of Temperature Coefficients
                               electrical parameters as current, voltage, and peak power. These coefficients let us imple-
                               ment This   test allows
                                      an alternative I–Vfinding the values methodology
                                                          curve translation of the temperature  coefficients
                                                                                         [23] already        of the
                                                                                                       explained  in PV
                                                                                                                     Testmod-
                                                                                                                          02.
                                ule electrical
                                     Objective. Determine the temperature coefficients of current (α), voltage (β),let
                                               parameters   as current, voltage, and  peak power.   These  coefficients    us
                                                                                                                         and
                               peak power (γ).
                                     Hardware. This test requires the same equipment listed in Test 02. Again, with natu-
                               ral sunlight or class B sun simulator or better, according to IEC 60904.
                                     A PV reference cell (or PV reference module) is required for irradiance measure. Pref-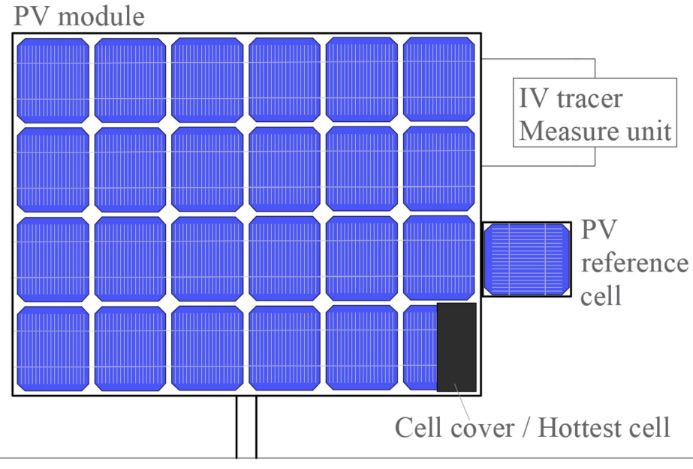
Standards 2022, 2                                                                                            141

                    implement an alternative I–V curve translation methodology [23] already explained in
                    Test 02.
                         Objective. Determine the temperature coefficients of current (α), voltage (β), and
                    peak power (γ).
                         Hardware. This test requires the same equipment listed in Test 02. Again, with natural
                    sunlight or class B sun simulator or better, according to IEC 60904.
                         A PV reference cell (or PV reference module) is required for irradiance measure.
                    Preferably it must be manufactured with the same cell technology to guarantee the same
                    spectral response. In some cases, an identical third-party calibrated module may be used.
                         Temperature probe with an accuracy of ±1 ◦ C and repeatability of ±0.5 ◦ C. Electronic
                    instruments for measuring simultaneously current and voltage to an accuracy of ±0.2% of
                    the reading.
                         The measuring range must be carried out from Isc (short-circuit current) until Voc
                    (open-circuit voltage). The sweep time shall be fast enough to obtain the entire current–
                    voltage (I–V) data set, and the irradiance and cell temperature can be considered changeless.
                    There are several options to do this sweep. Similar to before, it can be performed by a
                    programmable four-quadrant source, or an electronically controlled load, or a capacitive
                    analogic load. Suitable mount or rack for supporting the hole devices.
                         Finally, in this case, equipment destined to control the temperature of the PV module.
                    In most cases, it can be achieved by simple sun exposure [24].
                         Methodology. First, expose the PV module under natural or artificial sunlight. The
                    irradiance level must be in the range of ±2%, and the wind speed must be below 2 m/s.
                         In all cases, the reference device must be coplanar with the PV module, and both
                    be normal to the sun direction within ±5◦ with its temperatures stabilized. Take several
                    I–V curves for different cell temperatures in steps of 5 ◦ C to cover a wide operational
                    range (according to the climate to be exposed). Thus, we will obtain a set of I–V curves
                    from the PV module at the same irradiance levels but with different temps. To find out
                    the coefficients α, β, and γ, plot the values of Isc, Voc, and maximum power (Pmax),
                    respectively, as a function of the temperature and fit the data point linearly to obtain its
                    slope by the least-squares method [25].
                         In this test, the angular direction could be changed between the limits to keep the
                    irradiance changeless. Further, this test must be performed on a clear sunny day.

                    3.5. Test 05—Measurement of Nominal Operating Cell Temperature (NOCT)
                         This test allows determining the value of the nominal operating cell temperature
                    (NOCT). The NOCT is the temperature that reaches the module in open circuit under an
                    in-plane irradiance of 800 W/m2 , ambient temperature of 20 ◦ C, and wind speed of 1 m/s.
                    These parameters are known as standard reference environments (SRE). NOCT is helpful
                    to understand how the module behaves environmentally [26].
                         Objective. Determine the temperature NOCT.
                         Hardware. A PV module supporting an open rack with low heat conduction that can
                    be positioned at 45 ± 5◦ .
                         A reference cell installed coplanar at the module (or pyranometer).
                         An instrument to measure wind speed, and its direction, installed 0.7 m over the top
                    of the module. The lower PV module edge must be at least 0.6 m above ground level.
                    Further, it must have 0.6 m free space for surrounding objects and avoid reflectance from
                    near objects.
                         An instrument to measure ambient temperature and a temp probe for the cell temper-
                    ature, both with an accuracy of ±1 ◦ C.
                         Methodology. Figure 5 shows a diagram of the arrangement employed to measure
                    the nominal operating cell temperature (NOCT).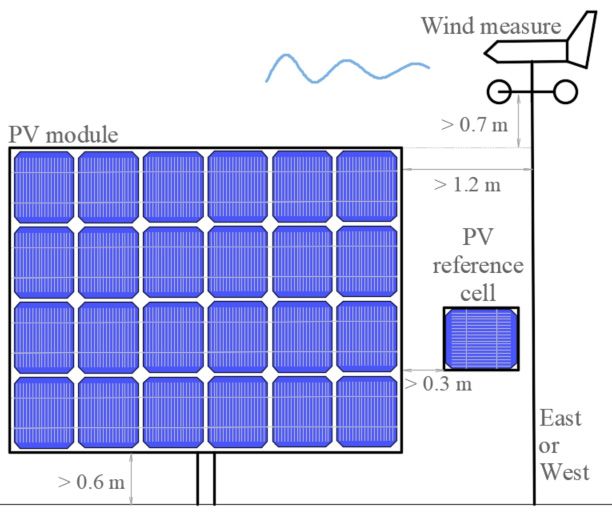
the nominal operating cell temperature (NOCT).
                                        From a clear day recorded data set, extract only those corresponding to irradiance
                                   values higher than 400 W/m2, with 10 min irradiance variation under 10%, wind speed
                                   within 0.75–1.0 m/s, wind direction into ±70° of north or south, and finally, with the am-
                                   bient temperature in the range of 5–35 °C.
Standards 2022, 2                       At least 10 data points must be extracted and must include morning and afternoon   142
                                   information.

                                  Figure5.
                                  Figure 5. Schematic
                                            Schematic for
                                                       for the
                                                            the measurement
                                                                measurementof
                                                                            ofnominal
                                                                              nominaloperating
                                                                                      operatingcell
                                                                                                celltemperature
                                                                                                     temperature(NOCT)
                                                                                                                 (NOCT)test.
                                                                                                                        test.

                                       From   a clear
                                        Plot cell     day recorded
                                                  temperature           data set,
                                                                (Tc) minus     theextract
                                                                                    ambient  only those corresponding
                                                                                               temperature              to irradiance
                                                                                                            (Ta) as a function  of irra-
                                  values  higher  than 400  W/m    2 , with 10 min irradiance variation under 10%, wind speed
                                   diance (G), so (Tc − Ta) = f(G) and fit the data by linear regression analysis. From there,
                                  within  0.75–1.0                                   ±70  ◦ of north or south, and finally, with the
                                   determine   (Tc −m/s,
                                                    Ta) atwind   direction
                                                            800 W/m           into 20
                                                                       2 and add        °C, finding the so-called preliminary NOCT’
                                  ambient   temperature   in thefor
                                                                 range    of 5–35  ◦ C.
                                   value. Calculate  the mean       ambient     temperature     and wind speed to carry out the wind
                                       At leastNext,
                                   correction.   10 data
                                                      withpoints
                                                           these must     be extracted
                                                                  two values,     extractand   must includecorrection
                                                                                           the temperature   morning and    afternoon
                                                                                                                       factor from the
                                  information.
                                   diagram presented in Figure 6.
                                       Plot cell temperature (Tc) minus the ambient temperature (Ta) as a function of irra-
                                  diance (G), so (Tc − Ta) = f (G) and fit the data by linear regression analysis. From there,
                                  determine (Tc − Ta) at 800 W/m2 and add 20 ◦ C, finding the so-called preliminary NOCT’
Standards 2022, 2, FOR PEER REVIEWvalue. Calculate the mean for ambient temperature and wind speed to carry out the wind              8
                                  correction. Next, with these two values, extract the temperature correction factor from the
                                  diagram presented in Figure 6.

                                             Temperaturecorrection
                                  Figure6.6.Temperature
                                 Figure                  correctionfactor
                                                                    factorfor
                                                                           forwind
                                                                              windand
                                                                                   andambient
                                                                                       ambienttemperature.
                                                                                               temperature.

                                        Next, add the temperature correction factor to the preliminary NOCT’ value resulting
                                       Next, add the temperature correction factor to the preliminary   NOCT’ value result-
                                  in the estimated NOCT value corrected for temperature of 20 ◦ C and wind speed of 1 m/s.
                                 ing in the estimated NOCT value corrected for temperature of 20 °C and wind speed of 1
                                        The final NOCT value will be determined by the average of those obtained in three
                                 m/s.
                                  consecutive tests.
                                       The final NOCT value will be determined by the average of those obtained in three
                                 consecutive tests.

                                 3.6. Test 06—Performance at STC and NOCT
                                      This test is helpful to figure out the behavior of the PV module under the Standard
                                 Test Condition (STC) (measured at 1000 W/m2, Tc = 25 °C, and spectral distribution AM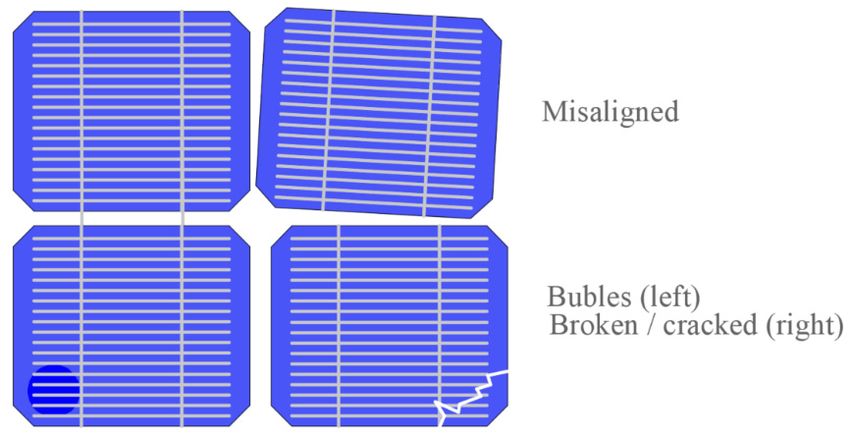
Standards 2022, 2                                                                                            143

                    3.6. Test 06—Performance at STC and NOCT
                         This test is helpful to figure out the behavior of the PV module under the Standard Test
                    Condition (STC) (measured at 1000 W/m2 , Tc = 25 ◦ C, and spectral distribution AM 1.5),
                    and into Nominal Operating Cell Temperature NOCT (SRE: determined at 800 W/m2 ,
                    ambient temperature Ta = 20 ◦ C, and wind speed Ws = 1 m/s).
                         Objective. Determine the module performance (I–V characteristic curve) at STC and
                    SRE-NOCT.
                         Hardware. Sun source (natural or artificial).
                         Set of instruments to measure irradiance (G), cell temperature (Tc), and to register
                    current (I)–voltage (V) simultaneously. Moreover, a variable load to obtain the I–V curve
                    (such as in Test 02).
                         Methodology. STC: Trace the I–V characteristic curve when the irradiance is 1000 W/m2 ,
                    and the cell temperature is 25 ◦ C (or translate them).
                         NOCT: Trace the I–V characteristic curve when the irradiance is 800 W/m2 , the cell
                    temperature is the NOCT, and the wind speed of 1 m/s.
                         These tests are hard to carry out over natural sunlight due to the difficulty in keeping
                    the temperature constant. Thus, some translation methods frequently are used as described
                    in Test 02 [27]; therefore, it is preferable to use a solar simulator.

                    3.7. Test 07—Performance at Low Irradiance
                          This test allows evaluating the performance of a PV module in low irradiance condi-
                    tions (G = 200 W/m2 ) and cell temperature (Tc = 25 ◦ C).
                          Objective. Determine the module performance (I–V characteristic curve) at 200 W/m2
                    and cell temperature of 25 ◦ C.
                          Hardware. Sun source (natural or artificial).
                          Set of instruments to measure irradiance (G), cell temperature (Tc), and to register
                    current (I)–voltage (V) simultaneously. Moreover, a variable load to obtain the I–V curve
                    (as in the previous Test 02).
                          Methodology. Trace the module I–V curve at Tc = 25 ± 2 ◦ C with and G = 200 W/m2 .
                    The irradiance level could be dismissed using suitable filters above the PV module without
                    altering the sun spectrum. The result expected is the I–V curve and its maximum power
                    point at that irradiance level.

                    3.8. Test 08—Outdoor Exposure
                         The purpose of this test is to know if the module withstands ambient exposure and
                    determine degradation effects that may occur.
                         Objective. Estimate if the module can withstand environmental conditions.
                         Hardware. A device to register the irradiance values (as a reference cell connected to
                    a datalogger). The irradiance must be measured within ±5%.
                         A resistive load to polarize the module near its maximum power point at the STC
                    conditions.
                         A suitable structure or mount to hold the PV module.
                         Methodology. The PV module should have passed the visual inspection and insu-
                    lation tests and have a known maximum power value (Test 01—Visual inspection, Test
                    02—Maximum power determination, and Test 03—Insulation). Then, connect the module
                    to the resistive load and expose it outdoors in ambient conditions to natural sunlight until
                    the module reaches 60 kWh/m2 . Make sure the irradiance device is coplanar. Finally,
                    repeat Tests 01, 02, and 03.
                         Pass. The module will pass the test if there is no evidence of major defects (pass
                    the visual test), its maximum power does not drop by more than 5%, and its insulation
                    resistance remains higher than 400 MΩ (pass insulation test) after exposure.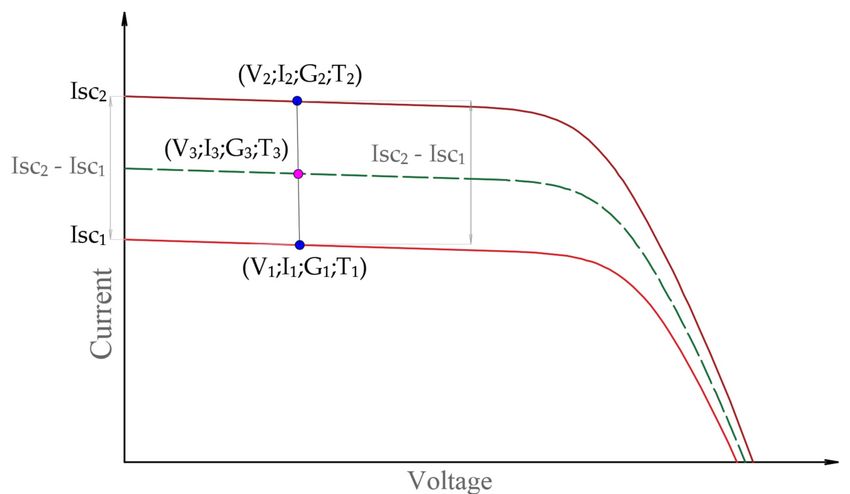
Standards 2022, 2 144
3.9. Test 09—Hot-Spot Endurance
This test seeks to check if the PV module withstands prolonged periods with a hot
spot in a cell. The hot spot may occur by partial shadows, soiling, cracked cells, electrical
mismatch effects, and so on. When the module cells try to force current into one with less
capacity, the excess of energy is dissipated similar to heat [28].
This section only discusses testing on modules with all its cells being electrically
series-connected. In our own experience, Series modules are the more widely available
modules used nowadays. The IEC reference standard [4] should be consulted for further
details of other kinds of PV modules.
Objective. Determine if the PV module can withstand excessive heating from a cell
without suffering visual or measurable deterioration.
Hardware. For this test, two different steady-state sun sources are needed. These can
be natural or artificial. One of them with an irradiance higher than 700 W/m2 ± 2%, with a
temporal stability ± 5%, and the other with an irradiance of 1000 W/m2 ± 10%.
An I–V curve tracer device.
Single-cell covers for blocking the light in 5% steps.
A temperature IR camera is recommended.
An instrument to measure short-circuit current.
Methodology. Put the module under sunlight with 700 W/m2 or higher irradiance
level, and trace one I–V curve to determine its current at the maximum power (Im). Then,
put the module in short circuit and locate, with the IR camera, which is the hottest cell, and
Standards 2022, 2, FOR PEER REVIEW 10
cover it. A simplified schematic for the hot-spot endurance test is shown in Figure 7, with
one of its cells is conveniently covered.
Figure7.7.Schematic
Figure Schematicfor
forthe
thehot-spot
hot-spotendurance
endurancetest.
test.
Trace
TraceaanewnewI–V I–Vcurve
curveandandextract
extractthe theshaded
shadedshort-circuit
short-circuitcurrent
current(Isc’).
(Isc’).
Only
Only ifif Isc’ >>Im,
Im,remove
removestepstepbyby step
step thethe cover
cover until
until reaching
reaching Im =Im = Isc’.
Isc’. In thisInsitua-
this
situation, the same
tion, the same power power is dissipated.
is dissipated.
Finally, 2 for
Finally,putputthe
themodule
module under
under anan irradiance of 1000
irradiance W/m
of 1000 W/m fivefive
2 for hours, andand
hours, keepkeep
the
value of Isc adjusting the cover over the cell. In these conditions, the module
the value of Isc adjusting the cover over the cell. In these conditions, the module temper- temperature
should be within
ature should 50 ± 1050◦ C.
be within ± 10 °C.
Next,
Next,similar
similarto toin
inthe
theprevious
previoustest, test,repeat
repeatTests
Tests01,
01,02,
02,and
and03. 03.
Pass. The
Pass. The module
module will will pass
pass ifif there
there isis no
noevidence
evidence ofofmajor
majordefects
defects(pass
(passthe
thevisual
visual
test),
test),its
itsmaximum
maximumpower powerdoesdoesnot
notdropdropby bymore
morethan
than5%,
5%,andandits
itsinsulation
insulationresistance
resistanceisis
higher
higherthan
than400400MΩMΩ(pass
(passinsulation
insulationtest).test).
3.10. Test 10—UV Preconditioning
3.10. Test 10—UV Preconditioning
This test studies the plausible degradation that may present the PV module under UV
This test studies the plausible degradation that may present the PV module under
radiation. It includes its electrical behavior and integrity, such as cables, junction boxes,
UV radiation. It includes its electrical behavior and integrity, such as cables, junction
adhesive joints, encapsulation, and module parts.
boxes, adhesive joints, encapsulation, and module parts.
Objective. Put the PV module under UV radiation over a defined time for evaluating
if the module presents some electrical or mechanical alteration or degradation.
Hardware. A device to keep the module warm within 60 ± 5 °C, such as a controlled
air current flow [29].
An instrument to measure cell temperature with a ±2 °C precision installed in the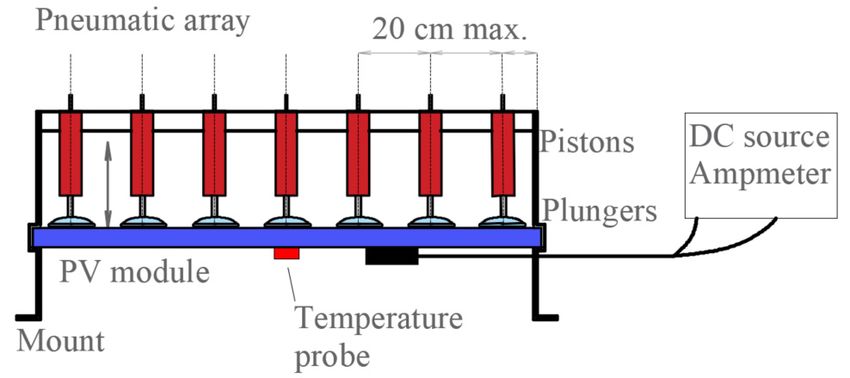
Standards 2022, 2 145
Objective. Put the PV module under UV radiation over a defined time for evaluating
if the module presents some electrical or mechanical alteration or degradation.
Hardware. A device to keep the module warm within 60 ± 5 ◦ C, such as a controlled
air current flow [29].
An instrument to measure cell temperature with a ±2 ◦ C precision installed in the
center of the module back surface.
A device to measure the UV radiation incident over the module surface from
280–385 nm.
Ultra-violet (UV) source to obtain on-plane irradiation of 250 W/m2 with uniformity
less than 15% for the same wavelength range.
A pyranometer for irradiance determination.
Protective eye goggles.
Standards 2022, 2, FOR PEER REVIEW 11
A schematic for the UV preconditioning test bench inside a controlled thermal chamber
with a UV light source is shown in Figure 8.
Figure 8. Schematic for the UV preconditioning test.
Methodology. With the pyranometer, verify that the UV source irradiance intensity
about 250
is about 250W/m
W/m 2, 2and
, and
its its uniformity
uniformity is less
is less thanthan
15%15% in wavelengths
in the the wavelengths
rangerange of
of 280–
280–385 nm. Verify that the module is in open-circuit and its temperature
385 nm. Verify that the module is in open-circuit and its temperature is between 55–65 °C. is between
55–65 ◦ 2 over the
Put the C.
PVPut the PV
module module
under under UVuntil
UV radiation radiation until
reaching 15 reaching
kW/m2 over15 kW/m
the entire wave-
entire wavelength 2
length range, with range,
at leastwith at least
5 kW/m 5 kW/m
2 over over nm.
the 280–320 the 280–320
Keep thenm. Keeptemperature
module the module
temperature
constant constant
during during
the whole the whole test.
test.
Finally, to
Finally, to detect
detect any
any difference
difference andand pass,
pass, repeat
repeat Tests
Tests01,
01,02,
02,and
and03.
03.
3.11. Test 11—Thermal Cycling
3.11. Test 11—Thermal Cycling
This test submits the PV module over a repetitive thermal cycle to detect any electrical
This test submits the PV module over a repetitive thermal cycle to detect any electri-
or mechanical problems that may occur, such as mechanical fatigue or stress.
cal or mechanical problems that may occur, such as mechanical fatigue or stress.
Objective. Determine if the PV module may withstand periodic thermal cycling over
Objective. Determine if the PV module may withstand periodic thermal cycling over
its lifespan.
its lifespan.
Hardware. A controlled thermal chamber (between −40 ◦ C to +85 ◦ C and ±2 ◦ C),
Hardware. A controlled thermal chamber (between −40 °C to +85 °C and ±2 °C), with
with enough room to hold the PV module inside, allowing air circulation all around it to
enough room to hold the PV module inside, allowing air circulation all around it to assure
assure uniformity and avoid condensation.
uniformity and avoid condensation.
The module must be installed thermally isolated from the mount.
The module must be installed thermally isolated from the mount.
An instrument to measure the module temperature and register it, with an accuracy of
±1 ◦ C.An instrument to measure the module temperature and register it, with an accuracy
of ±1 A°C.
DC power source to inject the standard peak power current (Im) into the module.
A
AnDC power source to inject the standard peak power current (Im) into the module.
amp-meter.
An amp-meter.
A simplified schematic for the thermal cycling test with the module inside a thermally
A simplified
controlled chamberschematic
is shown for the thermal
in Figure 9. cycling test with the module inside a ther-
mally controlled chamber is shown in Figure 9.
Methodology. Secure the PV module into the thermal chamber [30]. Connect the tem-
perature probe, set the DC source in current-source mode to Im, and connect it beside the
amp-meter to control its current between ±2%.
The thermal chamber controller must be set to stay 10 min (minimum) in the lower
temp of (−40 °C), then another 10 min in the higher temp (+85 °C) with a transition rate ofStandards
Standards 2022,
2022, 2,
2 FOR PEER REVIEW 12
146
Standards 2022, 2, FOR PEER REVIEW 12
Figure
Figure 9.
9. Schematic
Schematicfor
for the
the thermal
thermal cycling
cycling test.
test.
Methodology. Secure the PV module into the thermal chamber [30]. Connect the
temperature probe, set the DC source in current-source mode to Im, and connect it beside
the amp-meter to control its current between ±2%.
The thermal chamber controller must be set to stay 10 min (minimum) in the lower
temp of (−40 ◦ C), then
Figure 9. Schematic for
another 10 min in the higher temp (+85 ◦ C) with a transition rate of
the thermal cycling test.
◦
no more than 100 C/h (within a cycle time under 6 h), as is shown in Figure 10.
Figure 10. Cycling procedure for the thermal cycling test.
Hence, two tests may be performed: the thermal 50 cycle test and the 200 cycles test.
The 50 cycles test is executed without any current injection. In the 200 cycles test, the cur-
rent only is applied when the module temp is higher than 25 °C. The current must be equal
to the current at the maximum power point (Im).
The
Figure
Figure temp
Cycling
10.Cycling
10. and the current
procedure
procedure forthe
for must
the be cycling
thermal
thermal recorded
cyclingtest.
test.and monitored throughout the whole
process. When the entire process is completed, let the PV module reach room temperature
Hence, two tests
(approximately may be performed: the thermal 50tocycle test and the 200 cycles test.
Hence, two one testshour)
may and repeat Teststhe
be performed: 01,thermal
02, and 5003 cyclecompare
test and with
theprevious
200 cyclesresults
test.
The
looking50 cycles
for any test is executed without any current injection. In the 200 cycles test, the
The 50 cycles testdeviation.
is executed without any current injection. In the 200 cycles test, the cur-
current only is applied when the module temp is higher than 25 ◦ C. The current must be
rent only is applied when the module temp is higher than 25 °C. The current must be equal
equalTest
3.12. to the current at the maximum power point (Im).
12—Humidity-Freeze
to the current at the maximum power point (Im).
The temp and the current must be recorded and monitored throughout the whole
The
Thistemp test isand the current
conducted must beifrecorded
to estimate the module andappropriately
monitored throughoutwithstandsthe whole
humidity
process. When the entire process is completed, let the PV module reach room temperature
process. When
and freezing weather. the entire process is completed, let the PV module reach room temperature
(approximately one hour) and repeat Tests 01, 02, and 03 to compare with previous results
(approximately
Objective. one hour) and repeat Tests 01, 02, and 03 to compare with previous results
looking for any Determine
deviation. if the PV module can withstand a large humidity cycle with
looking
extremefor any deviation.
temperature changes.
3.12.Hardware. A controlled thermal chamber [31] but now, with humidity control (work-
Test 12—Humidity-Freeze
3.12. Test 12—Humidity-Freeze
ing between −40 °C to +85 °C
This test is conducted toand ±2 °C,ifwith
estimate 85 ± 5% appropriately
the module RH) with enough room tohumidity
withstands hold the
PV
andmodule
This
freezingtestinside, allowing
is conducted
weather. to air circulation
estimate if theall around
module it to assure uniformity
appropriately withstands and avoid
humidity
condensation.
and freezing The
weather. module must be installed thermally isolated
Objective. Determine if the PV module can withstand a large humidity cycle with from the mount.
An instrument
Objective.
extreme temperature tochanges.
Determine measure
if thethe
PVmodule
moduletemperature
can withstand andaregister it, with an
large humidity accuracy
cycle with
of ±1
extreme °C. A Schematic
temperature
Hardware. for the humidity-freeze test bench is shown in
changes.thermal chamber [31] but now, with humidity control (work-
A controlled Figure 11.
Methodology.
Hardware.
ing between −40 ◦ CPut
A controlled the ◦thermal
to +85 PV
C andmodule 2 ◦ C,inwith
±chamber open-circuit
[31]85but
± now,
5% RH) atwith
room temp
humidity
with enough over a suitable
control
room (work-
to hold
mount.
ing
thebetweenAttach
PV module −40the°Ctemperature
to +85
inside, °C and
allowing probe over
air±2circulation
°C, with its 85
front or RH)
all±around
5% back surface.
itwith Start
enough
to assure the test
room
uniformity when
toand the
holdavoid
the
humidity
PV modulereaches
condensation. The80–90%
inside, moduleRH,
allowing airthen
must beheat
circulationtheall
installed module
around
thermallyand keep
itisolated it from
to assure foruniformity
10the
min at 85
mount. °C.avoid
and Next,
condensation. The module must be installed thermally isolated from the mount.
An instrument to measure the module temperature and register it, with an accuracy
of ±1 °C. A Schematic for the humidity-freeze test bench is shown in Figure 11.
Methodology. Put the PV module in open-circuit at room temp over a suitable
mount. Attach the temperature probe over its front or back surface. Start the test when thekeep it for 10 min at −40 °C. Below room temperature, humidity control is no longer re-
quired. To avoid heat stress, the thermal variation rate must be below 100 °C/h for temps
Standards 2022, 2 over room temperature and up to 200 °C/h for temps below. All cycles must be under147 a
maximum permitted cycle time of 4 h. The test finalizes when ten complete cycles are
performed.
Finally, wait until
An instrument the module
to measure thereaches
moduleroom temperature
temperature and repeat
and register Tests
it, with an 01, 02, and
accuracy of
03 ◦
±1forC.
comparison
A Schematicwith
forprevious results.
the humidity-freeze test bench is shown in Figure 11.
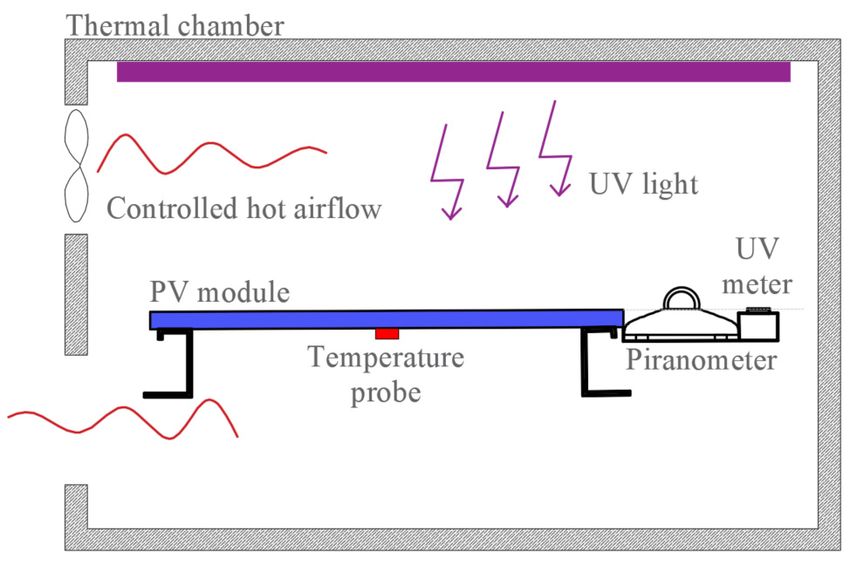
Figure
Figure11.
11.Schematic
Schematicfor
forthe
thehumidity-freeze
humidity-freezetest.
test.
3.13. Test 13—Damp-Heat
Methodology. Put the PV module in open-circuit at room temp over a suitable mount.
Attach
This test, relativelyprobe
the temperature easy to over its out
carry frontbut
or time-consuming,
back surface. Startisthe test when
designed forthe humidity
studying if
reaches 80–90% RH, then heat the module and keep it for ◦
the module may present any filtration or leak in its edges or10 min atbox.
junction 85 C. Next, keep it
for 10 min at −40 ◦ C. Below room temperature, humidity control is no longer required. To
Objective. Determine if the module can withstand without any damp filtration after
avoid heat stress, the thermal
prolonged exposure to a hot-humidity rate must be below 100 ◦ C/h for temps over room
variationambient.
temperature and ◦
Hardware. A up to 200 C/h
controlled thermalfor temps
chamber,below.
withAll cycles must
humidity be (working
control under a maximum
at 85 ± 2
permitted cycle time of 4 h. The test finalizes when ten complete
°C, and 85 ± 5% RH) with enough room to hold the PV module inside, allowing cycles are performed.
air circu-
lationFinally, wait ituntil
all around the module
to assure reaches
uniformity room
and temperature
avoid and repeat
condensation. Tests 01,
The module 02, and
must be
03 for comparison with previous results.
installed thermally isolated from the mount. An instrument to measure the module tem-
perature and register it, with an accuracy of ±1 °C. The chamber for this test is similar to
3.13. Test 13—Damp-Heat
the humidity-freeze test, but now, no temps below ambient are required.
This test, relatively
Methodology. Set the easy
PV to carry out
module but time-consuming,
in open-circuit at room temp is designed for studying
over a suitable mount.if
the module may present any filtration or leak in its edges or junction box.
Attach the temperature probe over its front or back surface. Start the test when the hu-
Objective. Determine if the module can withstand without any damp filtration after
midity reaches the range of 80–90% RH, then heat the module at 85 °C, and keep it for
prolonged exposure to a hot-humidity ambient.
1000 h.
Hardware. A controlled thermal chamber, with humidity control (working at 85 ± 2 ◦ C,
Finally, wait until the module reaches room temperature and repeat Test 03, and per-
and 85 ± 5% RH) with enough room to hold the PV module inside, allowing air circulation
form test 15—“Wet leakage current”.
all around it to assure uniformity and avoid condensation. The module must be installed
thermally isolated from the mount. An instrument to measure the module temperature
3.14. Test 14—Robustness of Terminations ◦
and register it, with an accuracy of ±1 C. The chamber for this test is similar to the
The following
humidity-freeze testbut
test, is carried
now, noout tempsto determine if the are
below ambient module power connections may
required.
supportMethodology. Set the PV module in open-circuit at room tempappear
a mechanical load such as tensile and bending. That may over a in hand instal-
suitable mount.
lation.
AttachPrincipally,
the temperaturethe following
probe over description
its front or is orientated
back surface. to modern
Start the testPVwhen
modules, which
the humidity
are widely
reaches theused
rangenowadays.
of 80–90%Usually,
RH, then they have
heat the circular
module section
at 85 ◦ C,wires
and with
keep MC4
it for type
1000 con-
h.
nectors at their ends.
Finally, wait until the module reaches room temperature and repeat Test 03, and
Objective.
perform Determine
test 15—“Wet if thecurrent”.
leakage module power cables can hold up a mechanical load.
Hardware. A balance with a precision of ±10% or better.
3.14.ATest
set 14—Robustness of Terminations
of different weights. In most cases, a water-filled device can be helpful to per-
form all
Thetests.
following test is carried out to determine if the module power connections may
Chronometer.
support a mechanical load such as tensile and bending. That may appear in hand installa-
tion. Principally, theAfter
Methodology. a module
following visual is
description inspection,
orientatedatotensile
modern testPVmust be performed,
modules, which are
applying a force lower than the module weight and a bending
widely used nowadays. Usually, they have circular section wires with MC4 type test, carrying outconnectors
between
1atand 10 ends.
their repetitions. The tests are performed as follows:
Objective. Determine if the module power cables can hold up a mechanical load.
Hardware. A balance with a precision of ±10% or better.
A set of different weights. In most cases, a water-filled device can be helpful to perform
all tests.Standards 2022, 2 148
Chronometer.
Methodology. After a module visual inspection, a tensile test must be performed,
applying a force lower than the module weight and a bending test, carrying out between 1
and 10 repetitions. The tests are performed as follows:
Tensile test: with the module upward, a force is chosen as is indicated in Table 1
must be applied, pulled away progressively in its usual axial direction, and maintained
for about 10 ± 1 s (see Figure 12a). Next, the module must be visually, electrically, and
mechanically inspected.
Standards 2022, 2, FOR PEER REVIEW 14
Table 1. Force selection for the tensile and bending test.
Circular Wire Diameter
Tensile Force [N] Bending Force [N]
[mm]
Tensile test: with the module upward, a force is chosen as is indicated in Table 1 must
be applied, 0.5–0.8 10 usual axial direction, and maintained
pulled away progressively in its 5 for
0.8–1.25 20 10
about 10 ± 1 s (see Figure 12a). Next, the module must be visually, electrically, and me-
>1.25 40 20
chanically inspected.
Figure 12.
Figure Procedure for
12. Procedure for the
the robustness
robustness of
of terminations
terminations test. (a)
(a) Tensile
Tensile test, (b) Bending test.
TableBending test: with
1. Force selection for the module
the tensile upward,
and bending atest.
force chosen as indicated in Table 1 must
be applied and rotate progressively to an angle of 90◦ and return to its usual position.
Circular
Next, Wire Diameter
the module [mm] electrically,
must be visually, Tensile Force [N]
and mechanically Bending
inspected,Force
as is [N]
shown in
Figure 12b. 0.5–0.8 10 5
0.8–1.25
For further 20
details, or considerations specific 10 standard IEC
to these tests, see the
60068-2-21 [32].>1.25 40 20
3.15.Bending
Test 15—Wet
test: Leakage
with theCurrent
module upward, a force chosen as indicated in Table 1 must
This test
be applied andis rotate
performed to analyzetoif an
progressively theangle
PV module
of 90° can
andwithstand
return to prolonged environ-
its usual position.
mental exposure, such as rain, fog, snow, etc. Here we are looking for insulation
Next, the module must be visually, electrically, and mechanically inspected, as is shown problems
orFigure
in electrical malfunction symptoms.
12b.
For further Determine
Objective. details, or ifconsiderations
the PV module exposed
specific to through prolonged
these tests, see thewet conditions
standard IEC
present signs
60068-2-21 of mechanical or electrical problems.
[32].
Hardware. A suitable tank to put on the PV module in the flat horizontal position.
This Test
3.15. tank15—Wet
must contain a solution
Leakage Current of water and additives to achieve a maximum resistivity
of 3500 Ωcm, surface tension of 0.03 N/m, and a temperature of 22 ± 3 ◦ C.
This test is performed to analyze if the PV module can withstand prolonged environ-
Spray equipment filled with the same solution.
mental exposure, such as rain, fog, snow, etc. Here we are looking for insulation problems
500 V DC power source and an instrument to measure insulation resistance. For
or electrical malfunction symptoms.
convenience, these may be replaced with an automatic digital insulation tester.
Objective. Determine if the PV module exposed through prolonged wet conditions
present signs of mechanical or electrical problems.
Hardware. A suitable tank to put on the PV module in the flat horizontal position.
This tank must contain a solution of water and additives to achieve a maximum resistivity
of 3500 Ωcm, surface tension of 0.03 N/m, and a temperature of 22 ± 3 °C.
Spray equipment filled with the same solution.Standards 2022, 2 149
Standards 2022, 2, FOR PEER REVIEW 15
Methodology. Immerse the PV module into the solution up to its junction box, or
Standards 2022, 2, FOR PEER REVIEW 15
totally if the500
rate under junction
V/s upboxtois500
designed
V and for that
keep it (see
for 2Figure 13). The
min, then cablesthe
measure must be sprayed
insulation re-
with the water solution [33]. Connect the module terminals in short circuit and connect
sistance.
them to the positive terminal of the DC source and the negative to the frame or a metallic
rate
part under
immersed 500 in
V/s
theup to 500 Apply
solution. V and voltage
keep it with
for 2the
min,
DCthen measure
source the insulation
and increment re-
it to a rate
sistance.
under 500 V/s up to 500 V and keep it for 2 min, then measure the insulation resistance.
Figure 13. Schematic for the wet leakage current test.
Pass. The test is satisfactory if the insulation resistance exceeds 400 MΩ for modules
Figure 13. Schematic for
for the wet
wet leakage current test.
under 0.1Schematic
m2 and higherthethan 40 MΩm2 for bigger ones.
The test
Pass. The test is
is satisfactory
satisfactory if if the insulation resistance exceeds 400 MΩ MΩ for modules
3.16. Test 16—Mechanical Load
under 0.1 m22 and and higher
higher than than 40 MΩm22for
40 MΩm forbigger
biggerones.ones.
This test is performed to analyze if the PV module can withstand prolonged environ-
mental
3.16. exposure,
Test
3.16. Test 16—Mechanical
16—Mechanicalsuch asLoad rain, wind, snow, etc., from a mechanical point of view.
Load
Objective.
This test
test is Determine
is performed
performed to if the
to module
analyze canPV appropriately withstand load on its surfaces.
This analyze ifif the
the modulecan
PV module canwithstand
withstandprolonged
prolonged environ-
environ-
mentalHardware.
exposure, A flat
such solid
as surface
rain, wind, to lie
snow, downetc., the
from PV a module
mechanical face up,
point with
of a small notch
view.
mental exposure, such as rain, wind, snow, etc., from a mechanical point of view.
to keep out its cables.
Objective. Determine ifif the the module
module can canappropriately
appropriately withstand
withstand loadloadononits
itssurfaces.
surfaces.
Objective. Determine
A DC voltage
Hardware. A power
flat solid source
surface andto an down
lie amp-meter the PV tomodule
detect anyface loss
up, of electrical
with a small conti-
notch
Hardware. A flat solid surface to lie down the PV module face up, with a small notch
nuity.
to keep out its cables.
to keep out its cables.
Weights
A DC voltageto apply
power uniformly
source and andan gradually
amp-meter load toover
detectthe PVloss
any module. From acontinuity.
of electrical practical
A DC voltage power source and an amp-meter to detect any loss of electrical conti-
pointWeights
of view,tothe load must be performed by a device such
apply uniformly and gradually load over the PV module. From a practical as a PVC pool, which ensures
nuity.
a uniform
point load
of view, thedistribution
load must be over the module
performed by a surface
device such and aseasy control
a PVC pool,by the water
which ensurescol-
a
Weights to apply uniformly and gradually load over the PV module. From a practical
umn. Further,
uniform the load canover
load distribution be applied
the module by pneumatic
surface and flow over
easy the module.
control by the water column.
point of view, the load must be performed by a device such as a PVC pool, which ensures
Methodology.
Further, the load canPut be the PV module
applied by pneumaticface up flow over over
the flat
thesurface
module. and connect the source
a uniform load distribution over the module surface and easy control by the water col-
and the amp-meter. Put
Methodology. Set the PV DCmodule
source to facedeliver
up over a current
the flat easily
surface detected. Gradually,
and connect ap-
the source
umn. Further, the load can be2 applied by pneumatic flow over the module.
and the amp-meter.
ply load up to 2400 Pa Set(N/m
the DC ), andsource
keepto deliver
it for a current
1 h. Then, easilythe
perform detected. Gradually,
same procedure to
Methodology. Put the PV module 2 ), and face up over the flat surface and connect the source
apply load up to 2400 Pa (N/m keep it for 1 h. Then,
the module back surface. The test finished after completing three cycles. (If a water col- perform the same procedure
and the amp-meter. Set the DC source to deliver a current easily detected. Gradually, ap-
to
umnthedevice
module back surface.
is used, considering The atestwater finished
density after completing
of 997 kg/m3 and three cycles.acceleration
a gravity (If a water
ply load up to 2400 Pa (N/m 2), and keep it for 1 h. Then, perform the same procedure to
3 and a gravity acceleration
column
constantdevice
of 9.81is m/s
used, considering
2, the water high a water
mustdensity reach up of to9970.245
kg/m m). A schematic for the me-
the module
constant of back
9.81 surface.
2 , the The test high
finished after completing three cycles. (If a water col-
chanical load testm/s
with water
a water column is mustshown reach up to 0.245
in Figure 14.3 m). A schematic for the
umn device
mechanical is used, considering a water density of 997 kg/m and a gravity acceleration
Finally,load testthe
repeat with a water
Tests 01, 02, column
and 03istoshown compare. in Figure 14.
constant of 9.81 m/s2, the water high must reach up to 0.245 m). A schematic for the me-
chanical load test with a water column is shown in Figure 14.
Finally, repeat the Tests 01, 02, and 03 to compare.
Figure 14.
Figure 14. Schematic
Schematic for
for the
the mechanical
mechanical load
load test.
test.
Pass. The
Finally, test isthe
repeat satisfactory if no
Tests 01, 02, loss
and 03oftocontinuity
compare. were detected and passed the tests
Figure 14. Schematic for the mechanical load test.
01, 02Pass.
Pm within
The test5%, and 03 insulation
is satisfactory over
if no loss 400 MΩ. were detected and passed the tests
of continuity
01, 02 Pm within 5%, and 03 insulation over 400 MΩ.
Pass. The test is satisfactory if no loss of continuity were detected and passed the tests
3.17. Test 17—Hail
01, 02 Pm17—Hail
3.17. Test within 5%, and 03 insulation over 400 MΩ.
The test is designed to determine if the PV module can withstand hail impacts suc-
The test is designed to determine if the PV module can withstand hail impacts suc-
cessfully.
3.17. Test 17—Hail
cessfully.
Objective. Determine if the PV module can withstand repetitive hail impacts over its
The test is designed
Objective. Determine to if
determine if the PV
the PV module canmodule can withstand
withstand hail impacts
repetitive hail impacts over
suc-
surface.
cessfully.
its surface.
Hardware. Ice cube tray, to make 25 mm ± 5% spherical ice balls with a mass of 7.53
Objective. Determine if the PV module can withstand repetitive hail impacts over its
g ± 5%. The trays can be made of two symmetrical parts with a single water entry. A tray
surface.
Hardware. Ice cube tray, to make 25 mm ± 5% spherical ice balls with a mass of 7.53
g ± 5%. The trays can be made of two symmetrical parts with a single water entry. A trayYou can also read