A Rainwater Harvesting and Treatment System for Domestic Use and Human Consumption in Native Communities in Amazonas (NW Peru): Technical and ...
←
→
Page content transcription
If your browser does not render page correctly, please read the page content below
Hindawi
Scientifica
Volume 2021, Article ID 4136379, 17 pages
https://doi.org/10.1155/2021/4136379

Research Article
A Rainwater Harvesting and Treatment System for Domestic Use
and Human Consumption in Native Communities in Amazonas
(NW Peru): Technical and Economic Validation

 Eli Morales Rojas ,1 Edwin Adolfo Dı́az Ortiz ,2 Cesar Augusto Medina Tafur ,3
 Ligia Garcı́a ,1 Manuel Oliva ,1 and Nilton B. Rojas Briceño 1
 1
 Instituto de Investigación para el Desarrollo Sustentable de Ceja de Selva (INDES-CES),
 Universidad Nacional Toribio Rodrı́guez de Mendoza (UNTRM), Chachapoyas 01001, Peru
 2
 Facultad de Ingenierı́a Civil y Ambiental, Universidad Nacional Toribio Rodrı́guez de Mendoza de Ama-zonas,
 Chachapoyas 01001, Peru
 3
 Departamento de Ciencias Biológicas, Universidad Nacional de Trujillo, Trujillo 13007, Peru

 Correspondence should be addressed to Eli Morales Rojas; eli.morales@untrm.edu.pe

 Received 31 July 2021; Accepted 5 October 2021; Published 19 October 2021

 Academic Editor: Silvia Bofill Mas

 Copyright © 2021 Eli Morales Rojas et al. This is an open access article distributed under the Creative Commons Attribution
 License, which permits unrestricted use, distribution, and reproduction in any medium, provided the original work is
 properly cited.
 The inhabitants of Tunants and Yahuahua face water supply problems in terms of quantity and quality, leading to socio-en-
 vironmental and health impacts in the areas. The objective of this research, therefore, is to determine the technical and economic
 feasibility of a proposal for a rainwater harvesting and treatment system for human consumption in the native communities. For
 the technical feasibility, monthly water demand per family was compared with the amount of water collected in the rainy and dry
 seasons. In addition, 16 physical, chemical, and microbiological parameters were evaluated at the inlet and outlet of the water
 system. The economic feasibility was determined by the initial investment and maintenance of the systems; with the benefits, we
 obtained the net present social value (NPSV), social internal rate of return (SIRR), and cost-effectiveness (CE). Technically,
 oxygenation and chlorination in the storage tanks allowed for water quality in physical, chemical, and microbiological aspects,
 according to the D.S. N° 031-2010-SA standard, in all cases. Finally, with an initial investment of S/2,600 and S/70.00 for annual
 maintenance of the system, it is possible to supply up to six people per family with an average daily consumption of 32.5 L per
 person. It is suggested that the system be used at scale in the context of native communities in north-eastern Peru.

1. Introduction drinking and domestic use) and relies on communal silos
 and latrines for disposal of human waste [4]. In Amazonas,
Safe drinking water and basic sanitation must be available, unfortunately, the province of Condorcanqui has the highest
accessible, safe, acceptable, and affordable for the entire percentage of lack of both services (92.3%) [5].
population [1]. The World Health Organisation (WHO) The lack of basic services in rural areas (such as water),
recommends at least 50 L per person per day of water to together with economic and climatic factors, directly in-
ensure basic hygiene and nutrition [2]. However, around the fluence chronic child malnutrition and anaemia [6]. The
world, people die from lack of quality water, especially in provision of safe drinking water for rural communities must,
rural areas (native and peasant communities) [3]. For in- therefore, be a public priority. However, public projects are
stance, Urakusa native community in the Amazonas region unsustainable due to dispersed housing, requiring costly
(NW Peru) has no basic sanitation services (water supply for distribution networks [7]. In this situation, rainwater
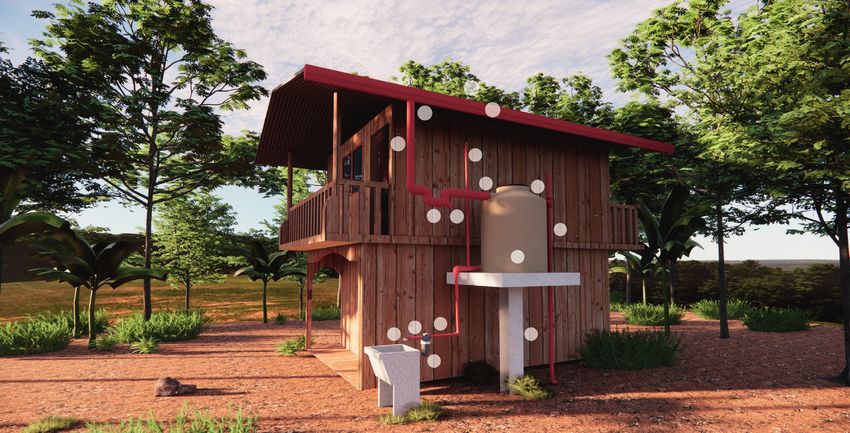
2 Scientifica

harvesting, storage, and utilisation systems are of paramount Therefore, it is necessary to implement rainwater harvesting
importance for those populations that still do not have systems in rural areas where access to drinking water is a
access to water or have shortages [8]. neglected asset [19]. Based on the above, this research aims,
 Thus, rainwater harvesting and rainwater harvesting for the first time, to technically and economically validate the
systems have become an economical and ecological alter- rainwater harvesting and treatment system designed for
native [9]; yet their use has not become widespread due to mass use in two native communities (Tunants and Yahua-
their long financial return periods [10]. However, there are hua) in the Amazonas region (NW Peru).
studies that demonstrate the feasibility of these systems. For
example, in Ireland, they focused on treating rainwater to 2. Materials and Methods
address water depletion due to massive population growth
[11, 12]. In Spain, a feasible predictive model was developed 2.1. Study Area and Characterisation of Target Beneficiaries.
for rainwater harvesting in rural communities [13]. In The study is located in two native communities, inhabited by
Sydney, average annual water savings are related to annual Awajún and Wampis peoples (Tunants and Yahuahua),
rainfall and a positive cost/benefit ratio of rainwater storage district of Nieva, province of Condorcanqui in the jungle of
tanks [14]. In Latin America, because of conditions from NW Peru (Figure 1). They are located at an altitude of 196
northern Chile, Peru, and parts of Ecuador, rainwater meters above sea level and an average temperature of 26°C
harvesting is also feasible [15]. Rainwater storage depends on and has an average annual rainfall of 3,121 mm [28]. The
the size of the tanks and the area, for which technical and communities were created 22 years ago and have a reported
economic considerations must be taken into account when population of 217 people in the 2017 census [29].
choosing the type of storage system [8]. The province of Condorcanqui faces transportation bar-
 The quality of rainwater must be analysed based on riers due to demographic dispersion, as well as it lacks access to
urban areas, physical, chemical, and microbiological factors, basic needs, which include, among others, food, drinking
which depend on various components suspended in the air water, and drainage [30]. Their economy is subsistence-based,
[16]. Population growth, forest burning, and industrial ex- with land (between 0.5 and 1 ha) dedicated to the cultivation of
pansion cause chemical modification of rainwater [17]. In cassava, bananas, and maize [31]. The characterisation of
that sense, rainwater harvesting and treatment is what de- beneficiaries, on which the systems were designed, was based
termines its use, depending on its ability to eliminate on interviews aimed at obtaining general data on the pop-
enterobacteria, viruses, protozoan cysts, and bacterial spores ulation, dwellings, water consumption habits, and evaluating
that can cause disease [18]. Global health depends not only the acceptance level of rainwater harvesting and treatment
on the quantity of water supplied but also on the water systems installed in these two native communities.
quality; a quarter of the world’s population suffers from
water-related illnesses [19]. In Urakusa, rainwater quality is
 2.2. System Design and Installation. Four stratus rain gauge
poorly prioritised because of the lack of sanitation services
 model 6330 were installed, one in each system (two in each
[4]. In this sense, rainwater may be used to avoid the use of
 native community). The construction area to set up the systems
water from springs and streams, in order to preserve them as
 was determined, ensuring it meets the minimum conditions for
they are threatened and highly polluted by human activities
 the area (place and area of the systems) and the number of
[19, 20]. Rainwater treatment has only sense if it is done
 users. For the tank construction, three main materials were
properly; therefore, the most widely used disinfection
 used: iron, cement, and pipes (PVC). The supporting structure
method (as part of the treatment) is chlorination due to its
 of the tank was built with a mixture of concrete and cement,
easy accessibility and application, as well as its high oxidant
 reinforced with corrugated steel. The design consists of 16 parts
capacity expressed in the reduction of organic matter [21].
 indicated in Figure 2, which include a footing of 1 m × 1 m, a
 The cost-effectiveness of rainwater harvesting systems
 central column of section 25 cm × 30 cm and support slab of
needs to be assessed in order to determine the systems’
 1.40 m × 1.40 m, and PVC pipes of 6 and a polypropylene
effectiveness at the user level. The economic analysis allows
 storage tank of 1,100 L with protection against ultraviolet rays
determining the feasibility of production from rainwater
 (Figure 2). The characteristics of the systems were the same in
[22, 23]. Water is one of the most important and scarce
 all four dwellings, except for the size of the column, which was
commodities available to people worldwide, and Peru is no
 subject to the height of the dwelling. Roof coverings of all
exception in this respect. Many populations are forced to
 dwellings were of galvanised calamine.
drink from sources whose quality is outside the regulations
(D.S. N° 031-2010-SA) leading to health risks for children
and adults [24]. In rural Peru, people lack access to safe 2.3. Technical Feasibility Determination. To determine the
drinking water; in fact, only 20.0% of the population have technical feasibility, physical, chemical, and microbiological
access to this service through the public water network [25]. factors were determined by sampling water, at the inlet and
One of the goals of the development objectives (SDGs) is to outlet of the systems during three months of the rainy season
achieve universal access to safe drinking water, sanitation, (December 2019 and January and February 2020) and two
and hygiene [26], and Peru is a party to these agreements. months of the dry season (September and October 2020).
 Little have rainwater harvesting projects in native Sample collection, storage, and transfer, as well as laboratory
communities been studied, as well as socialisation and prior analysis, were performed according to APHA, AWWA, and
training for maintenance of the systems implemented [27]. WEF [32]. In the rainy season, 264 physicochemical and 72
Scientifica 3

 78°1′30″W 78°1′0″W 78°0′30″W 78°0′0″W

 4°39′30″S

 4°39′30″S
 N

 Peru

 4°40′0″S

 4°40′0″S
 Marañ ón River Yahuaua
 South
 America

 Amazonas FI-S3
 FT-S4
 4°40′30″S

 4°40′0″S
 Tunants
 Condorcanqui
 FJT-S1 FPK-S2
 4°41′0″S

 4°41′0″S
 4°41′30″S

 4°41′30″S
 m
 0 500
 78°1′30″W 78°1′0″W 78°0′30″W 78°0′0″W

 Family Elevatión
 Pluviometer 265 m a.s.l.

 Rivers
 Figure 1: Location map.

microbiological samples were analysed, and in the dry capacity of 500 ml. They were transported in a cooler with dry
season, 64 physicochemical and 32 microbiological samples ice at a temperature of 5°C. Parameters were analysed at the
were analysed. The microbiological parameters were reduced Water and Soil Laboratory of the Research Institute for
in the dry season, due to the scarce economic resources Sustainable Development of Ceja de Selva (INDES-CES) of
allocated and the difficult access to the native communities, the National University Toribio Rodrı́guez de Mendoza
due to the effects of the COVID-19 pandemic. However, this (UNTRM). Water quality calibration was carried out through
was not a limitation to continue with the study, given that chlorination for disinfection at the outlet of the system [33],
efforts were made to analyse the TC and CF; the only pa- with commercial bleach in a mechanical way, through the
rameter not taken in the dry season was Escherichia coli. application of a graduated syringe; residual chlorine mea-
 Data collection for pH was in situ, with a Hanna mul- surements were carried out with a Hanna HI729 model
tiparametric water meter model HI 98194, while samples were colorimeter. Likewise, before each sampling, the pH was
collected in transparent plastic containers to determine the measured, and the application of potassium hydroxide
physicochemical parameters of electrical conductivity (EC), (KOH) tablets was determined accordingly.
turbidity, total dissolved solids (TDS), total suspended solids
(TSS), alkalinity, hardness, nitrates, nitrites, phosphates,
sulphates, aluminium, copper, and zinc. Samples were col- 2.4. Harvested Water and Projected Catchment Area of the
lected for microbiological analysis of total coliforms, faecal Roof for Water Supply. The volume of rainwater captured in
coliforms, and E. coli in properly sterilised glass bottles with a the systems (Vr) was determined by the catchment area of
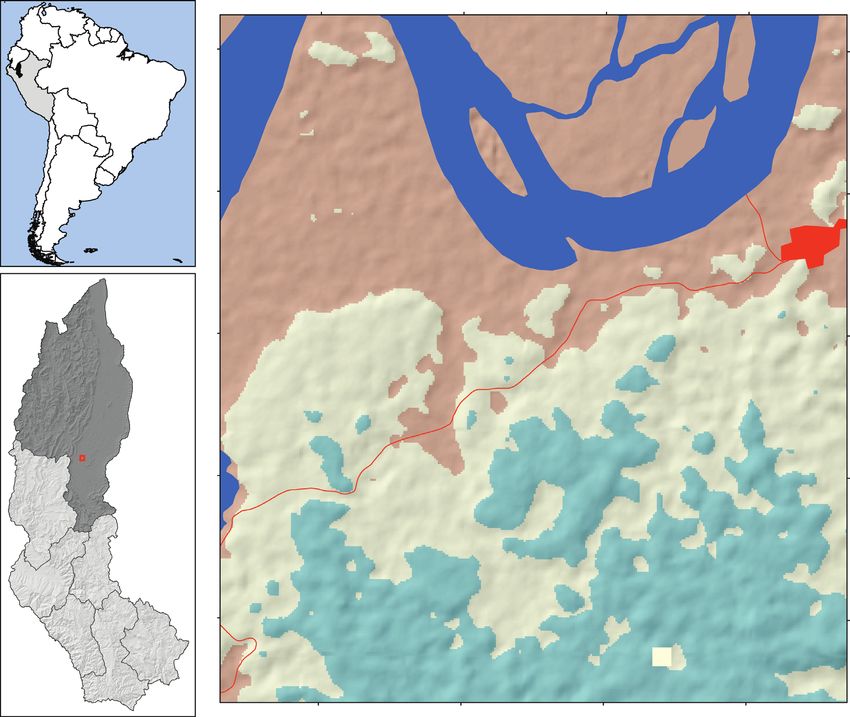
4 Scientifica

 1

 3 2

 4
 11

 7 9

 5 6
 10

 8

 14 12
 15 16

 13

 1.- Pluvial reception 9.- Plunger for disinfection
 2.- Pluvial collection 10.- Overflow excess water
 3.- Catchment / mesh 11.- Tank water level control
 4.- Conduction 12.- Tank cleaning valve
 5.- Sediment trap 13.- Impurity filter
 6.- Sediment cleaning valve 14.- Water supply for consumption
 7.- 24 Micron screen 15.- Water supply tap
 8.- Storage and disinfection tank 16.- Tank support (reinforced concrete slab)
 Figure 2: Design of the rainwater harvesting system.

the roof (CR, variable according to the dwelling), the type of The volume of rainwater captured by the roofs (supply) was
roof material (galvanised metal sheet), and its runoff coef- calculated and then weighed against the members’ water needs
ficient (Rc, 0.9) [34]. Based on the water harvested, a pro- (demand) [38]. The costs and expenses of the inputs per unit
jection was made of the ideal area to supply water. and on average, including the design plans, were taken into
 account. Inputs and services of the households were also
 Vr � Ce ∗ Rc. (1)
 valued.

2.5. Monthly Water Demand. The monthly water demand 2.7. Economic Viability. To determine the economic via-
per household (Wdh) was assessed. For this, the average bility, a socio-economic evaluation of rainwater harvesting
amount of water consumption per person (Wcp, 30 L/day projects was conducted to assess the current situation,
[35]), the number of individuals or beneficiaries of the system current supply, current demand, and problem description
(Nu), and the period of consumption analysed (Nd, 29, 30, or [39]. Benefit-cost analysis of the systems installed in the
31 depending on the month) were identified. The number of native communities by evaluating the total cost of the system
individuals per household was obtained through the appli- divided into three phases as follows.
cation of socio-economic surveys [36]. The priorities or ac-
tivities taken into account were the demand for water at the 2.8. Preinvestment and Investment Phase. In the preinvest-
individual level, including food preparation, personal hy- ment phase, the conditioning of the systems and labour costs
giene, and cleaning of personal items and objects [37]. were taken into account. In the investment phase, the con-
 (Nu ∗ Nd ∗ Wcp) struction of the systems was evaluated, taking into account the
 Wdh � . (2) components of the catchment area, conduction, storage, fil-
 1000
 tration, potabilisation, and distribution of rainwater. The op-
 portunity cost of terrain was also considered, as the tank
 installation requires a large area.
2.6. Economic Feasibility Determination. Economic feasibility
was determined based on cost-effectiveness, according to
geographical aspects (the location of the dwellings and roof 2.9. Postinvestment Phase. In this phase, the costs of oper-
area) and costs of water system installation and maintenance. ation and maintenance were determined, estimating the
For this, the amount of water supply to dwellings was assessed. timescale it should be done.
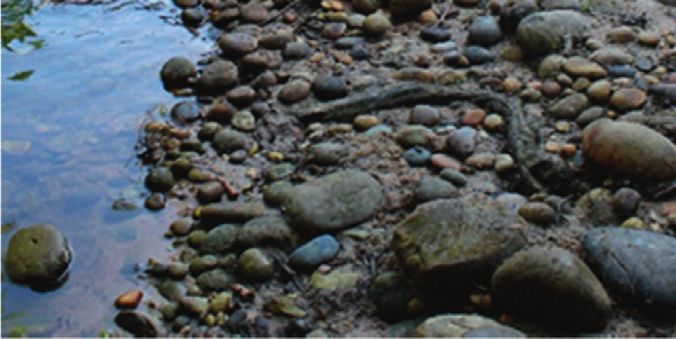
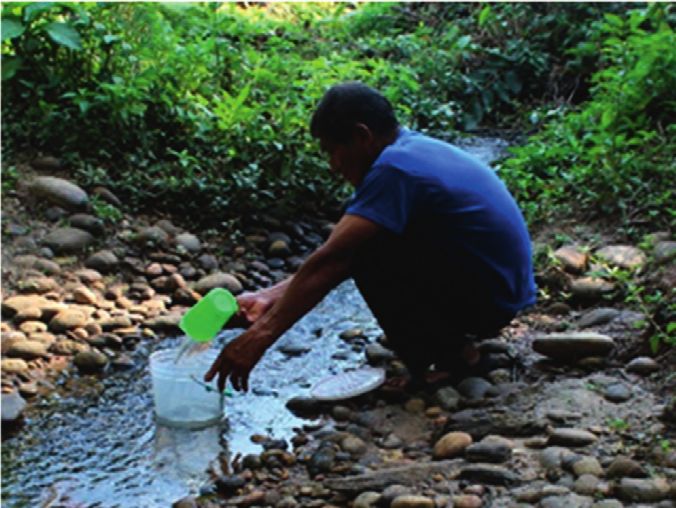
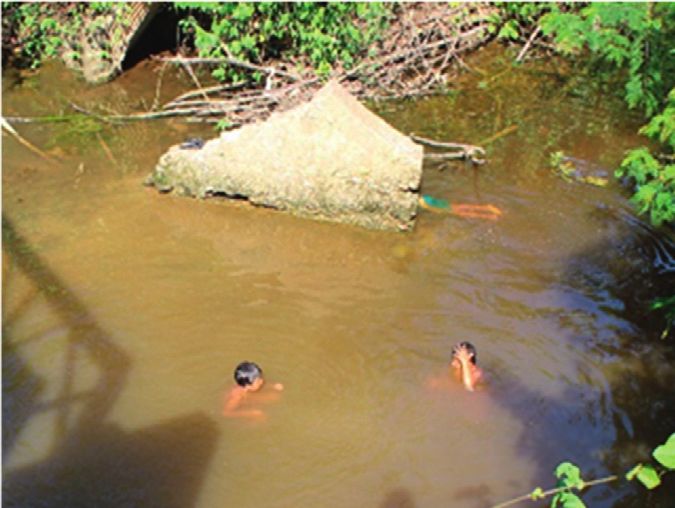
Scientifica 5

 Cost-benefit: cost-benefit analysis is based on Jianbing’s 2.13. Cost-Effectiveness Calculation of Carrying Water from
formula [40]: the Stream (Annual).
 AVB
 B/C � , (3) Can � Cad ∗ Da, (7)
 Inv + PVC
where AVB is the present value of rainwater benefits, Inv is where Can � annual cost of water without catchment system,
the investment, and PVC is the present value of costs. The Cad � daily water carrying cost, and Da � number of days per
net present social value (NPSV) was carried out to indicate year.
the profitability of the systems, and the projected project
horizon was 5 years.
 2.14. Comparing Projected Costs. We made a comparison
 n
 CFt for projected costs between the proposed tank water
 NPSV � , (4)
 t�0 (1 + r)t harvesting system (situation with project) versus the
 tankless water harvesting system, as this is the way the
where CFt is the year t cash flow, t is the number of time community currently uses the water (situation without
periods (number of years), r means 10% social discount rate, project). A 5-year evaluation was carried out, based on the
and n is the number of years in assessment horizon minus calculation of the annual for each case, including the
one. NPSV > 0 indicates that the investment will generate increase in the number of families (85 families by
returns. NPSV � 0 indicates that investment project will 2021–2026). The projection (2021–2026) was also calcu-
neither generate profits nor losses. NPSV < 0 indicates that lated using stormwater treatment information and
the investment project should be postponed. comparing these costs. Additionally, the costs of installing
 the system with the proposed tank water harvesting
 system (concrete-based materials) and an installation
2.10. Social Internal Rate of Return (SIRR). It was calculated
 alternative for families using local materials (materials
using the following formula:
 using native wood) were also described.
 n
 Ct We applied a nonparametric Kruskal–Wallis test to
 NPSV � −I0 1 + t � −I0 identify if there are significant differences between the dry
 t�1 (1 + IRR)
 (5) and rainy seasons, using the Minitab 17.1 software (Spanish
 F1 Fn version).
 + + ··· + � 0,
 (1 + IRR) (1 + IRR)n
where Ct: period t cash flow, I0: initial investment (t � 0), n:
 3. Results and Discussion
number of time periods, and t: time period. 3.1. Characteristics of Beneficiaries. In the selected house-
 holds of a native community in Amazonas, there are a
2.11. Cost-Effectiveness. The cost-effectiveness analysis of a maximum of 6 family members using water. While for
social-economic analysis and nonproject evaluation costs Biswas and Mandal [42], in a remote and rural area of
were measured as economic costs, and the results were Khulna (Bangladesh), there were a maximum of 4 members,
valued as units of effectiveness [41], assuming that families meeting their domestic use throughout the year. Of the
do not have water, based on the question “How much would selected families, 50% are engaged in agriculture (maize,
a litre of water cost?” and the number of times they carry banana, and cassava cultivation) with an average size of 1 ha
water, as well as the demand for water per family. A per family. They are also engaged in other casual work (day
comparison was made between the costs incurred by not labour) at a daily rate of 40 soles, an amount established by
having water versus the situation of the satisfaction of having internal rules (apu) within the community.
water in the training and treatment systems. The costs were In Tunants and Yahuahua, the inhabitants draw their
identified in terms of the number of water hauls and the loss water from nearby streams or ponds (at an average dis-
of productivity from hauling water (the daily labour cost was tance of 75 minutes round journey). Nevertheless, these
taken into account in the internal regulations of the native direct water sources are contaminated by anthropogenic
community of Urakusa). formulas (6) and (7) were used to and natural sources [20]. Here, water is commonly carried
calculate the daily and annual costs. in gallons and 10 L buckets for daytime supply
 (Figure 3(a)). However, for their personal hygiene, they
 usually go directly to the stream (Figure 3(b)). The
2.12. Cost-Effectiveness Calculation of Carrying Water from families also store the water in large containers (between
the Stream (Daily). 100 and 1,000 L capacity) to ensure the particles can settle
 Ta during storage. The water is always boiled before drinking,
 CE � ∗ Cj, (6) as the water is contaminated by different types of pol-
 Jl
 lutants, for example, washing powder and faecal dropping
where CE � cost-effectiveness, Ta � water carrying time in from domestic animals. The main reason for noncon-
hours per day, Jl � working hours per day, and Cj � cost of struction of a rainwater harvesting system is the economic
working time per day. factor.

6 Scientifica

 (a) (b)

 Figure 3: (a) Common water supply features and (b) villagers having their personal hygiene in the stream.

3.2. Rainwater Harvesting and Treatment System and sanitation of water equivalent to 30 L per person per day;
 however, it is still lower than recommended by the World
3.2.1. Monthly Rainfall. Studies indicate that the annual Health Organisation (WHO), suggesting at least 50 L of
rainfall in the province of Condorcanqui is between 1,200 water per person per day to ensure basic hygiene and nu-
and 1,800 mm [27]. The data collected from the rain gauges trition [2]. Household water consumption in the native
installed in the study area showed rainfall of up to 396.2 mm communities in this research was 71,280 L/year (Table 2) and
in November (Pluviometer-FP-S2) and 429 mm in June consumption per person was 32.55 L/day, for an average
(Pluviometer-FT-S4) corresponding to Tunants and number of 6 users.
Yahuahua, respectively (Figure 4). The lowest rainfall oc- The annual backlog for the FPK-S2 system was 44,244 L.
curred in August (24 mm), corresponding to the Yahuhua Therefore, it is clear that the water backlog is higher than the
area, and 5.76 mm for Tunants. Consequently, rainfall in demand. The implementation of water recycling systems is
both communities was consistent and was sufficient capacity proposed, as the water demand is higher than the normative
for the water catchment systems. allocation of 30 L per person per day [24]. The backlog in the
 Annual rainfall variations at the stations showed a FI-S3 system was 4,122 L; although the annual backlog is
maximum of 2,032.1 mm and a minimum of 987.64 mm positive, August, September, and October were the most
(Figure 5). The National Service of Meteorology and Hy- critical period with negative values (−4,455, −2,160, and
drology of Peru (SENAMHI) shows rainfall values between −257 L, respectively), months in which food preparation is
1,376.4 and 2,227.8 mm per year at the level of the Nieva the exclusive priority. In the FJT-SI and FT-S4 systems, the
district. The values of the installed rain gauges demonstrated annual lag was −15,258 and −59,473 L. Water deficit was
the tendencies with respect to the values given by SENAMHI, observed in almost all months (Table 2); generally, these
given the distance of the station from the installed systems. negative values are associated with water use in laundry and
 showering (in months where the lag is negative, water use
 should be prioritised). For water supply, each month water
3.3. Technical Feasibility use should be prioritised, and larger sheds should be in-
3.3.1. Amount of Rainwater Collected. The amount of stalled to capture more water. The 1,100 L storage systems
rainwater collected in the systems was not homogeneous tank was sufficient to supply all of the families’ needs for a
(Table 1). In the FPK-S2 family system, there was the highest week, assuming no rain. However, if they only prioritise
amount of water collected, with a maximum of 14,263.2 L water for food consumption, it can supply up to 15 days. It
(December) and a minimum of 311.04 L (June). Rainfall was determined that during the rainy months, storage tanks
shortage was pronounced in the summer season, during the with a maximum capacity of 460 L are needed; therefore, the
months of June, July, and August. The amount of rainwater chosen tanks are the 1,100 L tanks; this is justified because
collected is proportional to the area of the roofs. And rainfall the rains are constant, and there are days when even for the
is linked to the seasons of the year [15]. FI-S3 system; only a 15.00 L container is needed to supply
 water to the family.

3.4. Monthly Household Water Demand. Water distribution
is unequal; in fact, the poorest areas use about 15 L of water 3.5. Projections of Areas for Rainwater Catchment. The
per day and is, of course, influenced by the economic factor amount of water collected is dependent on the catchment area
[43]. In Mexico, every person has the right to access disposal of the sheds, so roof area measurements have been projected
Scientifica 7

 500

 400
 Precipitation (mm)

 300

 200

 100

 0
 Nov-19 Dec-19 Jan-20 Feb-20 Mar-20 Apr-20 May-20 Jun-20 Jul-20 Aug-20 Sep-20 Oct-20 Nov-20
 Precipitation -FI-S3 Precipitation -FP-S2
 Precipitation -FT-S4 Precipitation -FJT-SI
Figure 4: Rainfall evolution: FI-S3 � rain gauge (system three), FT-S4 � rain gauge (system four), FP-S2 � rain gauge (system two), and FJT-
SI � rain gauge (system one).

 2500

 2032.1
 2000 1896.42
 Amount of rainwater (mm)

 1675.6

 1500

 987.64
 1000

 500

 0
 Station -FP-S2 Station -FJTS1 Station -FI-S3 Station -FT-S4
 Figure 5: Total annual rainfall reported from rain gauges.

based on water deficit for seasonal low rainfall. Therefore, the periods. In contrast, in the FT-S4 and FI-S3 systems, the
average area for installing future investment projects is 89 m2 parameter aluminium (Al) was the only one that exceeded
(Table 3). With 89 m2 modules, an annual collection of up to water quality regulations. The high presence of aluminium
165,884.4 L can be achieved. Unfortunately, the investment in may have been influenced by calamine roofs, as well as the
rainwater harvesting may be very costly, making it impossible combustion of fossil fuels, crude oil, and sources of vehicular
to install due to economic reasons, thus declining the system’s traffic close to the installation of the systems [46, 47].
affordability [44]. As such, governments have an obligation to Different pollutants can reach water by wind speed, wind
guarantee access to a sufficient quantity of safe drinking water direction, temperature, and the degree of atmospheric sta-
for personal and domestic use [45]. bility [48, 49]. In this respect, the quality of rainwater is also
 influenced by the type of system design [50]. Zinc levels were
 below the maximum permissible limits (3.0 mg Zn/L) during
3.6. Physicochemical Parameters. The physicochemical pa- the rainy season. However, Chubaka et al. [51] found zinc
rameters (Table 4) for the FPK-S2 and FJT-S1 systems were concentrations above 3.0 ppm and copper concentrations
within the drinking water quality regulations [24] in both above 2.69 ppm. It is possible that this metal is associated
8 Scientifica

 Table 1: Monthly quantity of water offered.
 Monthly water catchment (L)
Month
 FPK-S2 (RA � 40 m2) FJT-S1 (RA � 60 m2) FT-S4 (RA � 40 m2) FI-S3 (RA � 50 m2)
November 2019 6,296.4 9,877.68 4,834.8 7,672.5
December 2019 14,263.2 9,637.92 7,290 10,575
January 2020 5,414.4 5,214.24 4,140 6,705
February 2020 7,315.2 5,522.58 5,962.32 7,830
March 2020 8,330.4 4,028.4 6,012 6,255
April 2020 3,772.8 3,218.94 7,020 5,031
May 2020 5,882.4 988.2 4,860 3,420
June 2020 5,684.4 311.04 9,612 5,850
July 2020 3,168 3,528.9 3,492 6,255
August 2020 864 2,995.38 864 1,125
September 2020 3,481.2 3,008.88 2,916 3,240
October 2020 5,119.2 2,613.6 4,176 5,323.5
November 2020 3,564 5,076 3,996 6,120
Total 73,155.6 56,021.76 65,175.12 75,402
RA � roof area.

 Table 2: Monthly water demand per household.
 System (FI-S3) System (FJT-SI) System (FPK-S2) System (FT-S4)
 De
Month d/m Vol. maximum Vol. maximum Vol. maximum Vol. maximum
 L/F L (L) Rez (L) L (L) L (L)
 tank/day (L) tank/day (L) tank/day (L) tank/day (L)
November
 30 5,400 2,273 76 4,478 149 896 30 −565 −19
2019
December
 31 5,580 4,995 161 4,058 275 −4,684 309 −6,145 37
2019
January 2020 31 5,580 1,125 36 −366 264 4,000 304 −4,435 −10
February
 29 5,220 2,610 90 303 292 4,194 397 −5,515 15
2020
March 2020 31 5,580 675 22 −1,552 223 5,929 460 −5,133 28
April 2020 30 5,400 −369 −12 −2,181 158 8,860 421 −4,521 83
May 2020 31 5,580 −2,160 −70 −4,592 5 7,052 417 −3,081 57
June 2020 30 5,400 450 15 −5,089 −165 7,535 441 −3,621 200
July 2020 31 5,580 675 22 −2,051 −226 7,639 349 411 126
August 2020 31 5,580 −4,455 −144 −2,585 −309 5,227 196 −1,677 −26
September
 30 5,400 −2,160 −72 −2,391 −399 691 139 −6,213 −110
2020
October
 31 5,580 −257 −8 −2,966 −482 −1,408 120 −8,877 −152
2020
November
 30 5,400 720 24 −324 −509 −1,688 63 −10,101 −203
2020
Total 396 71,280 4,122 140 −15,258 −722 44,244 3,645 −59,473 27
d/m � Day of month, L � lag, De L/F � water demand litres/family, and (L) � litres.

 Table 3: Rainwater harvesting projections of suitable catchment areas.
 Dwellings (NP) Dwellings (P) Investment/future
Dwellings Area of dwellings Rainwater harvesting Projected area Rainwater harvesting Recommended
 (m2) (L/year) (m2) (L/year) area (m2)
FPK-S2 40 73,156 70 128,022
FJT-S1 60 56,022 85 79,364
 89
FT-S4 40 65,175 91 148,273
FI-S3 50 75,402 110 165,884.4
Nonprojected dwellings (NP) and projected dwelling (P).
Scientifica

 Table 4: Rainwater quality (mean ± standard deviation) based on monthly evaluation during three months of the rainy season (December 2019 and January and February 2020).
Systems
 Turbidity TDS Alkalinity Hardness Nitrate Nitrite Aluminium Copper
samples pH (units) TSS (mg/L) Zinc mg/L
 (NTU) (mg/L) (mg/L; CaCO3) (mg/L; CaCO3) (mg/L; NO3) (mg/L; NO3) (mg/L) mg/L
(inlet/outlet)
FPK-S2
 6.77 ± 0.08 0.87 ± 0.76 22.20 ± 32.31 43.91 ± 58.10 36.57 ± 24.13 12.81 ± 1.43 1.01 ± 1.12 0.27 ± 0.46 0.07 ± 0.12 0.03 ± 0.04 1.70 ± 2.45
(inlet)
FPK-S2
 6.84 ± 0.16 0.53 ± 0.55 12.56 ± 16.41 52.83 ± 68.14 11.13 ± 0.68 13.09 ± 2.76 0.27 ± 0.46 0.17 ± 0.29 0.07 ± 0.11 0.01 ± 0.01 0.65 ± 0.69
(outlet)
FJT-S1
 6.80 ± 0.16 1.27 ± 1.78 6.47 ± 4.10 28.83 ± 22.23 14.71 ± 5.89 14.05 ± 4.69 2.25 ± 2.73 0.13 ± 0.23 0.07 ± 0.12 0.02 ± 0.03 2.09 ± 1.99
(inlet)
FJT-S1
 6.78 ± 0.15 0.70 ± 0.75 4.20 ± 0.96 17.70 ± 20.36 14.71 ± 5.89 11.16 ± 1.24 3.31 ± 5.73 0 0.08 ± 0.12 0.07 ± 0.01 0.48 ± 0.78
(outlet)
 ∗
FT-S4 (inlet) 6.63 ± 0.24 0.80 ± 0.72 4.87 ± 1.01 26.60 ± 24.00 22.27 ± 1.36 11.99 ± 1.89 1.75 ± 1.59 0.03 ± 0.06 0.12 ± 0.14 0.01 ± 00 0.84 ± 0.74
FT-S4
 6.77 ± 0.16 3.33 ± 4.69 4.40 ± 1.26 21.33 ± 10.07 18.69 ± 6.98 12.81 ± 1.43 0.77 ± 0.75 0 0.07 ± 0.13 0.01 ± 0.01 0.75 ± 0.66
(outlet)
FI-S3 (inlet) 7.09 ± 0.68 0.76 ± 0.80 9.30 ± 5.72 27.67 ± 20.03 18.69 ± 6.98 14.47 ± 5.8 3.60 ± 4.71 0.00 ± 0.01 0.08 ± 0.13 0.01 ± 0.01 2.18 ± 2.55
FI-S3 ∗
 6.97 ± 0.27 0.65 ± 0.71 4.70 ± 1.73 22.85 ± 18.78 14.71 ± 5.89 10.75 ± 4.35 1.00 ± 0.94 0.00 ± 0.01 0.11 ± 0.20 0.01 ± 0.01 1.03 ± 0.89
(outlet)
D.S. N° 500 mg 5,000 mg 3,00 mg NO2/L short 3.0 mg
 6.5–8.5 5 NTU 1,000 mg/L nc nc 0.2 mg Al/L 2 mg Cu/L
031-2010-SA CaCO3/L NO3/L exposure Zn/L
∗
 Noncompliant; nc � not contemplated in the Peruvian standard.
 9
10 Scientifica

with the corrosive action of calamine, such as ultraviolet users and will bring benefits such as the removal of
solar radiation that can damage calamine sheets or struc- inorganic (including aluminium that could be
tures, causing tiny metal microparticles and paint on the present as a precipitate) and organic particles and
surfaces. reduction of turbidity [58].
 The maximum amount of nitrate (NO3) was 3.60 ppm in
 Table 6 shows the results for microbiological parameters
the FI-S3 system. Nitrate concentration above 50 ppm in
 in the rainy season, which were above the water quality
water is detrimental to health, and infants may be most
 regulation (>1,600 NMP/100 mL). In many parts of the world,
affected due to the formation of methemoglobinemia [52].
 rainwater does not meet quality standards, and this is at-
 Rainwater quality varies according to the type of roof
 tributed to the frequent presence of faecal contamination,
and directly influences the parameters of hardness, alka-
 mainly from animal origin [59, 60]. High contamination
linity, and turbidity [53]. The maximum turbidity was 1.27
 densities are likely to have been caused by the abrupt tem-
NTU, which is within the Peruvian standard, but it could be
 perature change during rainfall [61]. Particulates and total
due to the number of dry days preceding a rainy event [54].
 coliforms are likely to affect the functioning of the rainwater
With respect to total solids, González [54] found parameters
 utilisation system, making ongoing studies a necessity [62].
between 79 ppm and 94 ppm; for this reason, continuous
 In low water season, all the results met the standard at
maintenance of the systems is recommended to reduce the
 the outlet of the system, given that the water samples were
TDS 22.20 mg/L, in the FPK-S2 system. These high and
 taken after treatment (chlorination). The importance of
discontinuous values are observed due to the lack of
 chlorinating the water lies in eliminating microorganisms
cleanliness of the roof. This dynamic is typical of indigenous
 [63, 64], so disinfection was carried out with commercial
communities. TSS varies between 17.60 and 52.83 mg/L.
 bleach at a rate of 5 drops per gallon (of 5 L) and left to stand
Other studies showed results for total suspended solids
 for 30 minutes before use. When water is not chlorinated,
ranging from 3 to 304 mg/L. Alkalinity values ranged from
 microorganisms may be present in the water [65], as evi-
11.13 to 36.57 mg/L CaCO3, and all values were very low and
 denced during the rainy season. With the operation and
acceptable. According to the literature [55, 56], alkalinity is a
 maintenance of rainwater harvesting systems, the quality of
very important parameter for drinking water, as it buffers
 water for human consumption is guaranteed [66]. However,
rapid pH changes.
 it is recommended that rainwater be chlorinated [67].
 The physicochemical results for the low-water season are
 Chlorination of stored water reduces the risk of diarrhoea
shown in Table 5, where zinc problems are evident for the FI-
 [68]. Therefore, rainwater harvesting systems can improve
S3 and FT-S4 family system, not meeting the standard (D.S.
 the quality of life of the inhabitants. In Australia, samples
N° 031-2010-SA). However, these heavy metal values in
 collected from 10 tanks contained E. coli in concentrations
rainwater are lower than values in river water, obtained by
 that exceeded the limit of 150 MPN/100 mL for recreational
the regional government of Amazonas in the community of
 water quality [69]. Bacteria may be associated with rainfall
Kusu Kubaim, in the Nieva district, with high heavy metal
 events and be in connecting pipes, and they can survive and
values (0.45 and 0.442, respectively) [57]. In the community
 even grow in an open environment, subject to the envi-
of Kigkis, in the Nieva district, water from the distribution
 ronmental level of nutrients and conditions such as tem-
network showed aluminium (0.527) and iron (0.482) above
 perature and pH [70].
acceptable limits [57]. Moreover, in the Chiangos com-
 pH showed no significant difference (Table 7) and falls
munity, in the Nieva district, high values of aluminium
 within the water quality standards. pH value allows the
(0.2062) were found. Aluminium in all systems ranged from
 determination of the degree of contamination caused by
minimum and maximum values of 0.2–0.67 mg Al/L, re-
 sulphur oxides and nitrogen oxides [71]. The pH values
spectively. The problems of heavy metals persist for both
 obtained are related to the type of storage tank [72], for
periods; technical and economical measures such as oxy-
 example, asbestos sheet roofs have pH values of 6.75 [73].
genation of the storage tanks should be taken to achieve
 Rainwater pH can vary from weakly acidic (pH 3.1) to
precipitation of both aluminium and zinc. This is left as a
 weakly alkaline (pH 11.4). In previous studies, the pH of
proposal:
 rainwater ranged from 6.6 to 8.26 [74]. In this study, the pH
 (a) Precipitate aluminium from water. Water is oxy- ranged between 6.82 and 7.02.
 genated in an artisanal way to react with O−2 and Rainwater turbidity was below the standard (5 NTU),
 precipitate as aluminium hydroxide (Al (OH)3↓) with average values of 1.24 for the rainy season and 1.58
 Al+3 + O−2 ⟶ Al O3 + H2O ⟶ Al (OH)3↓ NTU for the dry season. There were no significant differ-
 ences between seasons. Turbidity is important to analyse
 (b) Precipitate zinc. It is recommended to oxygenate the
 because it influences water clarity, and its presence may be
 water in an artesian way so that it reacts with O2
 associated with extreme rainfall allowing the presence of
 precipitates in the form of zinc hydroxide (Zn
 suspended solids [16].
 (OH)2↓)
 Aluminium in rainwater, 0.16 and 0.67 mg/L, exceeded
 Zn2 + O−2 ⟶ Zn O + H2O ⟶ Zn (OH)2↓ the Peruvian water quality standard for human consumption
 (c) Constant cleaning of water storage tanks is also (0.2 mg Al/L). The statistical analysis shows significant
 recommended, with at least maintenance every two differences between seasons, with higher amounts of alu-
 months. It is an easy method of operation for the minium and zinc found during the dry season. The presence
Scientifica 11

Table 5: Water quality (mean ± standard deviation) based on monthly evaluation during two months of the low water season (September
and October 2020).
Systems samples (inlet/outlet) pH (units) Turbidity (NTU) Aluminium (mg/L) Zinc (mg/L)
FPK-S2 (inlet) 6.95 ± 0.12 1.75 ± 0.21 0.67∗ ± 0.69 2.51 ± 0.84
FPK-S2 (outlet) 6.99 ± 0.05 1.10 ± 0.42 1.26∗ ± 1.44 1.82 ± 0.24
FJT-S1 (inlet) 6.80 ± 0.27 1.20 ± 0.28 0.16 ± 0.04 2.06 ± 0.44
FJT-S1 (outlet) 6.81 ± 0.18 1.55 ± 0.21 0.29∗ ± 0.20 2.59 ± 0.86
FT-S4 (inlet) 7.07 ± 0.13 1.35 ± 0.21 0.21∗ ± 09 3.12∗ ± 2.12
FT-S4 (outlet) 7.03 ± 0.12 1.85 ± 0.07 0.24∗ ± 0.13 3.30∗ ± 2.31
FI-S3 (inlet) 7.30 ± 0.08 1.90 ± 0.14 0.46∗ ± 0.28 4.93∗ ± 3.89
FI-S3 (outlet) 7.29 ± 0.08 2.20 ± 0.28 0.22∗ ± 0.01 4.92∗ ± 3.90
D.S. N° 031-2010-SA 6.5–8.5 5 UNT 0.2 mg Al/L 3.0 mg Zn/L
∗
 Noncompliant; nc � not contemplated in the standard.

 Table 6: Microbiological parameter results.
Systems samples (inlet/outlet) Total coliforms (NMP/100 mL) Faecal coliforms (NMP/100 mL) E. coli (NMP/100 mL)
Microbiological parameter (rainy season)
FPK-S2 (inlet) 1,600∗ 180∗ 2∗
FPK-S2 (outlet) 350∗ 130∗ 0
FJT-S1 (inlet) >1,600∗ >1,600∗ 17∗
FJT-S1 (outlet) 13∗ 13∗ 5∗
FT-S4 (inlet) 920∗ 1,600∗ 4∗
FT-S4 (outlet) 1,600∗ 1,600∗
FI-S3 (outlet) 1.524∗ 23∗ 13∗
Microbiological parameter (low water season)
FPK-S2 (inlet) 234∗ 99∗ SN
FPK-S2 (outlet)
12 Scientifica

 Table 8: Installation costs of concrete-based rainwater harvesting systems versus a cheaper wood-based alternative in native areas.
 Tank support
 Unitary
Aspects Quantity Unit Reinforced concrete support (S/) Local alternative (wooden board)
 price
 estimated in total prices estimated in total prices
Cost of land 1 Global 84.00 84.00
Cost of transport 1 Global 1,200.00 600.00
Cost of installation local labour
1 operator from outside the locality∗ 10 day 110 1,100.00 0.00
1 officer from outside the locality∗ 10 day 80 800.00 0.00
1 community labourer∗ 10 day 40 400.00 0.00
1 carpenter from outside the
 13 day 110 0.00 1,430.00
community
2 community labourers 13 day 80 0.00 1,040.00
Cost of hardware materials (for concrete base vs. common wood alternative in native areas)
1/8-inch thick galvanised metal
 38 Unit 6.8 258.40 258.40
platen supports
Self-drilling fastening bolts for
 76 Unit 0.6 45.60 45.60
gutters, hexagonal head
PVC catchment funnel 4 Unit 25 100.00 100.00
PVC pipe, 4 inches 4 Unit 20 80.00 80.00
4 inch × 90 degree PVC elbows 16 Unit 6 96.00 96.00
Codos de PVC 4 × 2 pulgadas, con
 4 Unit 6 24.00 24.00
ventilación
2-inch PVC plug 4 Unit 2 8.00 8.00
Reduction from 4- to 3-inch PVC 4 Unit 6 24.00 24.00
2 inch × 90 degree PVC elbows 8 Unit 4 32.00 32.00
PVC pipe, 2 inches 8 Unit 13 104.00 104.00
PVC tee, 2 inches 4 Unit 5 20.00 20.00
PVC ventilation cap, 2 inches 4 Unit 5 20.00 20.00
3/4-inch PVC ball valve 4 Unit 15 60.00 60.00
PVC union with 3/4 inch thread 4 Unit 3 12.00 12.00
PVC reduction, 3/4 to 1/2 inch 4 Unit 1.5 6.00 6.00
PVC adapters, 3/4 inch 16 Unit 1.5 24.00 24.00
PVC pipe, 1/2 inch 4 Unit 10 40.00 40.00
3/4-inch PVC pipe 2 Unit 12 24.00 24.00
Mixed PVC joint (thread and
 4 Unit 2.5 10.00 10.00
spigot), 1/2 inch
1/2-inch PVC spigot union 8 Unit 1.5 12.00 12.00
1/2 inch × 90 degree PVC elbows 10 Unit 2 20.00 20.00
1/2-inch PVC tap 4 Unit 15 60.00 60.00
PVC glue × 1/8 gallon 1 Unit 20 20.00 20.00
Polyethylene tanks with ultraviolet
 4 Unit 475 1,900.00 1,900.00
protection, 1,100 L capacity
Black annealed wire, 16 gauge 20 kg 5 100.00 0.00
Black annealed wire, 8 gauge 20 kg 5 100.00 0.00
Portland cement type I 32 Bags 26 832.00 0.00
3-inch wood nails 15 kg 8 120.00 0.00
3/8-inch corrugated steel 10 Rod 16 160.00 0.00
1/2-inch corrugated steel 42 Rod 27.5 1,155.00 0.00
1/4-inch corrugated steel 11 Rod 7 77.00 0.00
Cost of materials in the area
River concrete 4.5 m3 120 540.00 0.00
Ordinary timber for shuttering 183 p2 4 732.00 0.00
Wood for tank supports 461.5 p2 4 0.00 1,846.00
Total cost (4 systems) 10,400.00 8,000.00
Total cost (1 system) 2,600.00 2,000.00
∗
 Category of labour force, existing in civil construction (worker, journeyman, and labourer); p2 � square feet; and Bl � bag of cement weighs 42.5 kilograms.
Scientifica 13

 Table 9: Economic analysis of catchment systems.
 Benefits and costs
Initial investment S/2,600
Systems maintenance (year) S/70
Benefits (annual) S/1,260
NPSV S/1,911
SIRR 36%
B/C S/1.73
NPSV � net present social value, SIRR � social internal rate of return, and B/C � benefit cost.

 Table 10: Costs from the social assessment.
Description Units Value
Water carrying time Hours/day 2.34
Daily working day Hours/day 8
Labour cost Soles/day 40
Cost per 10 L bucket haulage Soles/day 11.68
Total haulage cost Soles/month 350.25
Total haulage cost Soles/year 4,203.00

 Table 11: Carrying costs that the locality incurs during the assessment horizon (situation without project).
 0 1 2 3 4 5 Total
Year
 2021 2022 2023 2024 2025 2026 2021–2026
Number of families 84 85 86 87 88 89 89
Annual cost (S/)∗ 35,305 35,725 36,145 36,566 36,986 37,406 218,135
∗
 Carrying cost without project (S/4,203.00 per family).

harvesting is a viable alternative for domestic use and even for 3.9. Horizon Assessment for Both without Project and with
irrigation [79]. To reduce costs in treatment systems, it is Project. The 5-year evaluation was carried out on the basis of
advisable to place co-layers (grids) that serve as a trap for large the total haulage cost per family year (Table 11). The cost of
particles and leaves from trees that fall on the roof and clog the hauling during the evaluation horizon (2021–2026) is shown
system [80]. Thus, treated rainwater costs 60% less than to be S/2,181.35, which corresponds to the sum of the annual
drinking water provided by the supplier [79]. The B/C is 1.73 hauling costs in years 0, 1, 2, 3, 4, and 5 (estimated situation
soles, which is cost-effective, but this depends on the project without project). It is important to mention that, currently,
area as it does not agree with the study by Domı́nguez et al. these costs are covered by the population in the time spent
[79], who found that the cost benefit was $1.34. carrying the water. Consequently, they are unable to perform
 their normal activities (social, family, economic, educa-
 tional, etc.). Water access, like money, is a fundamental need
3.8. Cost-Effectiveness Analysis. The valuation of the cost of of any population and is an essential condition for many
water was based on the assumption that how much would people to have a better life [82].
the family save to stop carrying water. In this sense, we took Table 12 shows the investment costs over the 5-year
into account that the average time spent carrying water is 30 evaluation horizon. For the implementation of the rainwater
minutes one way and 40 minutes return; the difference is due harvesting and treatment system, 89 families were estimated
to the weight of water carried. The average time per family is with an annual investment cost of S/2,600.00 per family. The
2.34 hours/day to carry water just for food preparation and investment in the fifth year would be S/231,400. This eval-
washing dishes (Table 10). uation horizon will allow competent bodies to determine the
 The annual cost of the water supply for food preparation amount of investment in rainwater in order to satisfy the
was 4,203 soles, without taking into account the time it takes human right to water, without necessarily achieving an
them in the evenings to go to the streams to have their economic benefit [82]. In this sense, a cost-effectiveness
personal hygiene. Compared to the cost of carrying water in analysis was useful to value costs that could not be presented
a year, with less than half, they can install a proposed water in terms of monetary values [83].
harvesting and reuse system (S/2,600). As such, access to Table 13 shows the cost flow over the evaluation horizon,
water has become a management problem to improve the both with and without project. With 10% of the total haulage
quality of life in rural areas, due to high costs [19]. The lack of costs incurred by the inhabitants of the locality (Tunants and
water has caused great famines and has led to the mobi- Yahuhua), the water supply problem could be solved. This
lisation of entire villages in search of solutions [81]. Native would allow them to cover their needs for human con-
communities are no exception to these social conflicts sumption and domestic use water. Socio-economic factors of
(access to basic services such as water) [5]. the population would have positive readjustments, such as
14 Scientifica

 Table 12: Investment costs over the evaluation horizon (situation with project).
 0 1 2 3 4 5 Total
Year
 2021 2022 2023 2024 2025 2026 2021–2026
Number of families 84 85 86 87 88 89 89
Investment cost (S/)∗ 218,400 221,000 223,600 226,200 228,800 231,400 231,400
∗
 The investment cost of the systems is S/2,600.00 per family.

Table 13: Comparison of costs without project and with project. Acknowledgments
 Situation Situation
Description The authors acknowledge and appreciate the support of the
 without project with project
 Instituto de Investigación para el Desarrollo Sustentable de
Water haulage 2,181,357 0
 Ceja de Selva (INDES-CES) of the Universidad Nacional
Investment 0 231,400
OM 0 31,150
 Toribio Rodrı́guez de Mendoza de Amazonas (UNTRM).
Total 2,181,357 262,550 This research was funded by Fondo Nacional de Desarrollo
 Cientı́fico, Tecnológico y de Innova-ción Tec-
OM: operational and maintenance.
 nológica—FONDECYT, contract no. 185-2018-FONDE-
 CYT-MB-IADT-SE (PROLLUVIA project).
human health improvements [83]. Another benefit of
rainwater harvesting systems is the reduction of vulnera-
bility to floods and river overflows, which are strategies for References
the implementation of disaster risk management [39]. [1] T. Ruiz-cuello, J. C. Pescador-piedra, L. M. Raymundo-
Therefore, it is shown that the implementation of rainwater Núñez, and G. Pineda-Camacho, “Dimensionamiento de un
treatment systems projected over 5 years is 262,550 soles. sistema hidráulico en casa-habitación para el uso de agua
The costs are less than the costs of carrying water from the residual,” Revista Cubana de Quı́mica, vol. 27, pp. 315–324,
stream (2,181,357). Future research in the native commu- 2015.
nities of the Amazon region related to the use of well water is [2] ISBN WHO/SDE/WSH/03.02, WHO Domestic Water Quan-
important, as it has shown high potential in other places tity, Service Level and Health, WHO, Geneva, Switzerland, 2nd
since it is cheap and quickly accessible in times of drought edition, 2020.
 [3] Organización Panamericana de la Salud, Agua y Saneamiento:
[84]. Taking into consideration that a limiting factor is
 Evidencias para Polı́ticas Públicas con Enfoque en Derechos
microbial contamination of groundwater, which has become Humanos y Resultados En Salud Pública, Organización
a global problem and remains a management challenge as an Panamericana de la Salud, Washington, DC, USA, 2011.
integrated groundwater model [85, 86]. [4] G. Carmona Clavijo, J. Daza Arevalo, and V. L. Osorio Pretel,
 “Percepciones sobre la vacunación de la rabia silvestre en
 población Awajún de la provincia,” Saúde Coletiva, vol. 1,
4. Conclusions p. 26, 2015.
Rainwater harvesting for domestic use and human con- [5] A. Medina-Ibañez, J. Mayca Pérez, J. E. Velásquez-Hurtado,
 and L. F. Llanos-Zavalaga, “Conocimientos, percepciones y
sumption in native communities in Amazonas (NW Peru) is
 prácticas sobre el consumo de micronutrientes en niños
feasible according to technical and economical validation. Awajún y Wampis (Condorcanqui, Amazonas-Perú),” Acta
Rainwater harvesting can supply six family members with Médica Peruana, vol. 36, no. 3, pp. 185–194, 2019.
daily consumption of 32.5 L per person. Regarding water [6] M. Ortiz-Guzmán, V. Morales-Domı́nguez, and M. Aragón-
quality, no significant differences in physicochemical pa- Sulik, “Cosecha de agua de lluvia con tanques de
rameters are shown. However, for heavy metals, aluminium mamposterı́a. Caso: san Miguel Piedras, Nochixtlán, Oaxaca,”
showed the most significant difference. A mechanical oxy- Journal of Ambient Intelligence and Humanized Computing,
genation system should be implemented to sediment heavy vol. 30, pp. 25–29, 2009.
metals, as it is economical and easy to use. The imple- [7] J. Durán Juárez and A. Torres, “Los problemas del abaste-
mentation of rainwater harvesting systems can be an al- cimiento de agua potable en una ciudad media,” Espiral,
 vol. 17, pp. 129–162, 2006.
ternative water supply in native communities as it is cheap
 [8] R. T. Hugues, “La captación del agua de lluvia como solución
and accessible. However, water management systems must en el pasado y el presente,” Ingenieria Hidraulica y Ambiental,
be implemented for its use, after treatment. vol. 40, pp. 125–139, 2019.
 [9] U. De La Cruz, J. Gleason, and J. Gleason, “Beneficios
Data Availability económicos de implementar un sistema de captación de agua
 de lluvia en La Universidad de guadalajara,” Vivienda y
The data used to support the findings of this study are Comunidades Sustentables, vol. 4, pp. 11–20, 2018.
available from the corresponding author upon request. [10] C. M. Silva, V. Sousa, and N. V. Carvalho, “Evaluation of
 rainwater harvesting in Portugal: application to single-family
 residences,” Resources, Conservation and Recycling, vol. 94,
Conflicts of Interest pp. 21–34, 2015.
 [11] A. Pérez Hernández, O. L. Palacios Vélez, M. Anaya Garduño,
The authors declare that there are no conflicts of interest. and J. L. Tovar Salinas, “Agua de lluvia para consumo humano
Scientifica 15

 y uso doméstico en san miguel tulancingo, oaxaca,” Revista [28] J. M. Garcı́a, “Hidrografı́a - zonificación Ecológica Económica
 Mexicana de Ciencias Agrı́colas, vol. 8, no. 6, pp. 1427–1432, del departamento de Amazonas,” Journal of Chemical In-
 2017. formation and Modeling, vol. 53, pp. 1689–1699, 2010.
[12] Agatón, A. León, and F. C. S. Juan Carlos Córdoba RuizUriel, [29] INEI, III Censo de Comunidades Nativas 2017: Resultados
 “Revisión del estado de arte en captación y aprovecha- Definitivos, INEI, Sydney, Australia, 2018.
 mientode aguas lluvias en zonas urbanas y aeropuertos,” [30] A. M. Hocquenghem and É. Durt, “Integración y desarrollo de
 Tecnura, vol. 20, pp. 141–153, 2016. la región fronteriza peruano ecuatoriana: entre el discurso y la
[13] P. Ornetti, C. Fortunet, C. Morisset et al., “Clinical effec- realidad, una visión local,” Bulletin de l’Institut français
 tiveness and safety of a distraction-rotation knee brace for d’études andines, vol. 31, no. 1, pp. 39–99, 2002.
 medial knee osteoarthritis,” Annals of Physical and Rehabil- [31] R. Burneo Mendoza, “Territorio integral indı́gena, una pro-
 itation Medicine, vol. 58, no. 3, pp. 126–131, 2015. puesta awajún,” Iztapalapa. Revista de Ciencias Sociales y
[14] A. Rahman, J. Keane, and M. A. Imteaz, “Rainwater har- Humanidades, vol. 85, pp. 33–57, 2018.
 vesting in greater Sydney: water savings, reliability and eco- [32] F. W. Gilcreas, “Future of standard methods for the exami-
 nomic benefits,” Resources, Conservation and Recycling, nation of water and wastewater,” Health Laboratory Science,
 vol. 61, pp. 16–21, 2012. vol. 4, no. 3, 1967.
[15] M. Chino-Calli, E. Velarde-Coaquira, and J. J. Espinoza Calsı́n, [33] A. Sarmiento, M. Rojas, E. Medina, C. Olivet, and J. Casanova,
 “Captación de agua de lluvia en cobertura de viviendas rurales “Investigación de trihalometanos en agua potable del estado
 para consumo humano en la Comunidad de Vilca Maquera, carabobo, venezuela,” Gaceta Sanitaria, vol. 17, no. 2,
 Puno-Perú,” Revista de Investigaciones Altoandinas - Journal of pp. 137–143, 2003.
 High Andean Research, vol. 18, no. 3, pp. 365–373, 2016. [34] Ministerio de Educación Normas Legales Normas Legales.
[16] O. Ospina Zuñiga, G. Garcı́a Cobas, J. Gordillo Rivera, and D. Of. 2019, 10–15.
 K. Tovar Hernández, “Evaluación de la turbiedad y la con- [35] J. Pique del pozo, Resolucion Ministerial N°-192-2018-Viv-
 ductividad ocurrida en temporada seca y de lluvia en el rı́o ienda 2018, Ministerio de Vivienda, Construcción y Sanea-
 Combeima (Ibagué, Colombia),” Ingenierı́a Solidaria, vol. 12, miento, San Isidro, Peru.
 no. 19, pp. 19–36, 2016. [36] R. Alfonso, Procedimiento Para El Diagnóstico Del Sistema De
[17] M. Romero Orué, D. Gaiero, M. Paris et al., “Wet precipi- Gestión Tecnológica E Innovación En Entidades De Transporte
 tation in northern Argentina: chemical characterization of Turı́stico, Universidad Central “Marta Abreu” de Las Villas,
 soluble components in the Lerma valley, Salta,” Andean Santa Clara, Cuba, 2013.
 Geology, vol. 44, no. 1, pp. 59–78, 2017. [37] UNESCO, Informe Mundial de las Naciones Unidas sobre el
[18] P. R. Thomas and G. R. Greene, “Rainwater quality from
 Desarrollo de los Recursos Hı́dricos 2019. No dejar a nadie
 different roof catchments,” Water Science and Technology,
 atrás, UNESCO, Paris, France, 2019.
 vol. 28, no. 3–5, pp. 291–299, 1993.
 [38] J. A. B. Suárez, M. Á. G. Garcı́a, and R. O. O. Mosquera,
[19] J. Domı́nguez Serrano, “El acceso al agua y saneamiento: un
 “Sistemas de aprovechamiento de Agua Lluvia para Vivienda
 problema de capacidad institucional local,” Análisis en el
 Urbana,” in Proceedings of the 22th Latin American Congress
 estado de Veracruz, Gestión y polı́tica pública, vol. 19, no. 2,
 on Hydraulics and International Symposium on Hydraulic
 pp. 311–350, 2010.
 Structures, 2006.
[20] E. M. Rojas, E. A. Dı́az Ortiz, L. Garcı́a, J. Veneros Guevara, and
 [39] J. Arroyave Rojas, J. Dı́az Vélez, D. Vergara, and N. Macı́as,
 C. A. M. T. Segundo Chavez Quintana, “Calidad fı́sicoquı́mica
 “Evaluación económica de la captación de agua lluvia como
 y microbiológica del agua en los lagos de tunants y yahuahua,
 en la región Amazonas, Perú,” Revista Latinoamericana de fuente alternativa de recurso hı́drico en la Institución Uni-
 Difusión Cientı́fica, vol. 3, pp. 89–92, 2021. versitaria Colegio Mayor de Antioquia,” Produccion y Limpia,
[21] L. Marı́n, “Desinfección del agua: sistemas utilizados en aya,” vol. 6, pp. 76–84, 2011.
 Hidrogénesis, vol. 5, pp. 35–46, 2007. [40] Z. Jianbing, L. Changming, and Z. Hongxing, “Cost-benefit
[22] A. Stec and M. Zeleňáková, “An analysis of the effectiveness of analysis for urban rainwater harvesting in Beijing,” Water
 two rainwater harvesting systems located in central eastern International, vol. 35, no. 2, pp. 195–209, 2010.
 Europe,” Water, vol. 11, no. 3, p. 458, 2019. [41] R. Mariño, “Evaluación económica del programa de fluo-
[23] R. Hofman-Caris, C. Bertelkamp, L. de Waal et al., “Rainwater ración del agua de beber en Chile,” Revista Chilena de Salud
 harvesting for drinking water production: a sustainable and Pública, vol. 17, no. 2, p. 124, 2013.
 cost-effective solution in the Netherlands?” Water, vol. 11, [42] B. K. Biswas and B. H. Mandal, “Construction and evaluation
 no. 3, p. 511, 2019. of rainwater harvesting system for domestic use in a remote
[24] Webster, Bibliography and Index of Paleozoic Crinoids and and rural area of Khulna, Bangladesh,” International Scholarly
 Coronate Echinoderms 1981—1985, Geological Society of Research Notices, vol. 2014, Article ID 751952, 6 pages, 2014.
 America, Boulder, CO, USA. [43] UNHCR, “EC/54/SC/C/CRP.14, “Protracted refugee situa-
[25] M. Publicc, Bibliography and Index of Paleozoic Crinoids and tions,” in Proceedings of the 30th meeting of Executive
 Coronate EchinodenTIS 1981-1985, Washington State Uni- Committee of the High Commissioner’s Programme, Geneva,
 versity, Pullman, WA, USA, 1985. Switzerland, June 2004.
[26] C. Cabezas, “Enfermedades infecciosas relacionadas con el [44] N. Palacio, “Rainwater system proposal as an alternative to
 agua en el Perú. Rev Peru,” Revista Peruana de Medicina save drinking water in the educational institution Marı́a
 Experimental y Salud Pública, vol. 35, pp. 309–316, 2002. Auxiliadora from Caldas, Antioquia,” Gestión y Ambient,
[27] C. H. Hidalgo, M. G. Reßtegui, and L. A. Rada, “Prevalencia de vol. 13, no. 2, pp. 25–40, 2010.
 hepatitis viral A y B y factores de riesgo asociados a su [45] Aguiar Ribeiro Do Nascimiento and G. El Derecho al, “Agua y
 infección en la población escolar de un distrito de Huánuco- su Protección en el Contexto de la Corte Interamericana de
 Perú,” Revista Peruana de Medicina Experimental y Salud Derechos Humanos,” Estudios Constitucionales, vol. 16, no. 1,
 Pública, vol. 19, pp. 5–9, 2002. pp. 245–280, 2018.
You can also read