2021 INTERIM RESULTS PRESENTATION
19 AUGUST 2021
←
→
Page content transcription
If your browser does not render page correctly, please read the page content below
2021 INTERIM RESULTS PRESENTATION 19 AUGUST 2021

SAFETY MESSAGE
COVID-19 IS STILL WITH US… DO NOT BECOME COMPLACENT!

  ADDITIONAL WAVES                    VACCINATE                      TAKE CARE OF YOURSELF
   CAN BE EXPECTED                   Vaccines train your immune
                                     system using a harmless form
                                              of the virus                        EAT
                                                                    STAY SAFE               EXERCISE
                                                                                HEALTHILY

                                                                    TAKE CARE OF EACH OTHER

                                                                           We are a community,
    REMAIN VIGILANT                                                  let’s support and protect each
 AND ALWAYS STICK TO THE PROTOCOLS                                                 other

                                       A Covid-19 vaccine will
                                     produce a strong, long-term,
                                      adaptive immune response                  …BE KIND

                                                                                                       2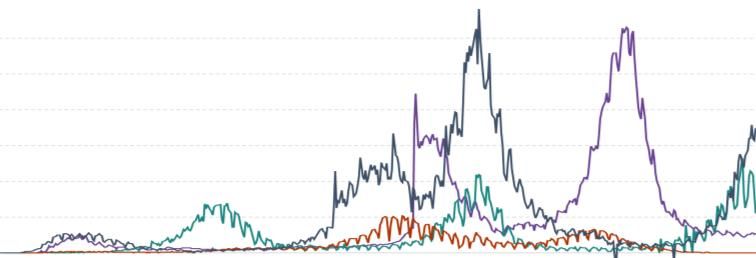
AGENDA

     Welcome and opening observations

     Salient features

     Operational and financial review

     Outlook and prospects

     Q&A

     Appendices

     Appendices

                                        3
WELCOME AND OPENING OBSERVATIONS

                                   4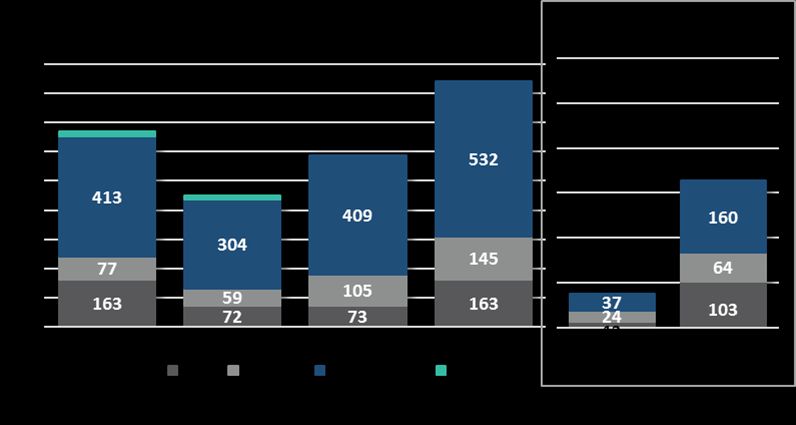
TOP OF MIND ISSUES

 • Settling organisation and leadership team during H1
 • Ensuring project delivery for both verticals on track
 • Managing Covid-19 disruptions
   › Human impact
   › Supply chain coordination and stabilisation
   › Chip shortage – unplanned costs
   › Travel restrictions/reluctance – broader business impact
 • Recovery from civil unrest in KZN
 • Strategic review
 • Green manufacturing strategy

                                                                5
SALIENT FEATURES
6SALIENT FEATURES AT GROUP LEVEL
POSITIVE NO INTERIM
REVENUE EBITDA* OPERATING PROFIT NET DEBT FREE CASH FLOW DIVIDEND FOR FY21
Increased by R366m
dividend of 75cps
R475m
increased 53% to increased 405% to
increased to R545m from Dec 20 to
declared and paid
R5.9bn R701m from R18m loss R1,171bn on FY20
(Last Twelve Months (“LTM”))
Debt refinancing
Successful 5-year extension of RCF funding
LTIFR ± 28.7k tonnes
improved Achieved a consolidated group of lead recycled (YTD)
to 0.30 in 2021 (YTD) B-BBEE level 1
from 0.61 in 2020
and all South African subsidiaries at Level 4 or better
Covid-19 Refining Lithium-ion strategy
Successfully progressed Strategic review: for trading, assembly
response effective
recovery in line with expectations new projects Finalise H2 2021 and manufacturing with
but challenges remain limited investment
* Excluding impairments 7OPERATIONAL AND FINANCIAL REVIEW
8AUTOMOTIVE COMPONENTS: OPERATIONAL PERFORMANCE
DIRECTLY DEPENDENT ON SA OEM PRODUCTION – RECOVERY AS EXPECTED
OEM Dec 2020 Jun 2020 Jun 2021 Change
TSAM 103 461 41 076 61 660 20 584
SOUTH FMCSA 65 503 22 343 55 598 33 255
VWSA 114 158 51 949 66 673 14 724
AFRICA MBSA 51 558 19 230 29 848 10 618
BMW 42 244 16 764 29 301 12 537
NISSAN 19 307 8 371 9 374 1 003
OTHER 20 739 12 385 12 898 513
• OEM customer volumes rebounded 54% from
Total volumes 416 970 172 118 265 352 93 234
comparative levels, supported by strong export market
demand and recovery from Covid-19 lock-downs
• Metair main customers had a much better start up to
the year with 85% combined volume uplift
approximating comparative 2019 levels
• Outlook remains positive. SA FY21 OEM production
expected to return to FY19 levels but dependent on
supply chain stability and successful project launches
• Global supply chain disruptions placing significant
pressure on the industry, impacting the cost and
availability of certain raw materials and components
(like chips) which will remain a risk to stable production
for the foreseeable future
9ENERGY STORAGE: OPERATIONAL PERFORMANCE
PERFORMANCE AHEAD OF RECOVERY EXPECTATIONS DUE TO A 42% INCREASE IN AUTOMOTIVE SALES
VOLUMES LARGELY DRIVEN BY HIGHER EXPORT DEMAND
• Mutlu benefitted from the normalization of Turkish OEM
production, but also continues to increase market share in
new technology (AGM) supply
TURKEY • AM demand remained high throughout H2’20, and this
continued into H1’21
• Export volumes increase of 96%, resulting from new export
contracts as well as reduction in export country lock-downs
Retur Sales chanel
'000s Dec 2020 Jun 2020 Jun 2021 Change %
• Demand very good in all channels, with the factory
Mutlu 3 692 1 172 1 830 659 56%
operating at high capacity utilization during 2021
ROMANIA - OEM 1 329 506 728 222 44%
• AM volumes increased significantly, supported by strong - Local AM 1 575 403 617 214 53%
European AM demand and new export contracts - Export AM 758 246 481 235 96%
- Industrial 30 17 4 (13) (75%)
Rombat 2 240 909 1 317 408 45%
- OEM 427 181 234 52 29%
- Local AM 454 141 203 62 44%
- Export AM 1 359 587 880 294 50%
• OEM volumes improved by 57% as SA auto production FNB 1 731 786 923 137 17%
largely normalised - OEM 305 129 202 73 57%
SOUTH • H1'21 AM demand strong and similar to post initial lock- - Local AM 974 484 480 (4) (1%)
AFRICA down - Export AM 281 111 136 25 22%
- Industrial 171 62 106 43 69%
• Continued weak industrial demand – investigating business
Total units 7 663 2 866 4 070 1 204 42%
model change
Total auto battery units 7 462 2 787 3 961 1 174 42%
10H1 2021 GROUP RESULTS AT A GLANCE
HEPS PBIT EBITDA
(*Excluding Moll impairment)
170cps R545m R701m
404% 405% (H1 2020: R139m*)
(H1 2020: -56cps) (H1 2020: -R18m)
Free cash flow PBIT % ROIC
Unadjusted
- R142m 9.2% 16.3% (H1 2020: 7.8%)
304% 9.6ppt 8.5ppt/
Adjusted*
(H1 2020: R70m) (H1 2020: -0.5%) 5.2ppt
11.6% (H1 2020: 6.4%)
• The business has recovered from the impact of the 2020 lockdowns • Free cash flow utilised of R142m, with increased working capital as
and measures to curb Covid-19. well as capital investments to support new vehicle models and
• Group turnover increased by R2bn (53%) to R5.9bn and up 11% when facelifts
compared to H1’19 • In 2020 measures were implemented to conserve cash, reduce
• Operating profit recovered to R545m at a 9.2% margin and working capital and defer capital spend
approximates H1’19 level of 9.3% • Group unadjusted ROIC amounted to 16.3% and is ahead of our cost
• Headline earnings amounted to R327m at 170cps, recovering from of capital of 13.4%
56cps loss in H1’20 and higher than 160cps achieved in H1’19
• EBITDA of R701m was achieved (incl. equity earnings), a significant * Group adjusted ROIC is calculated on the incentivisation
methodology, which excludes cash on hand and certain currency
improvement from H1’20 of R139m translation movements on foreign acquisitions regarding invested capital
11H1 2021 VERTICAL PERFORMANCE
STRONG PERFORMANCE DEMONSTRATES BENEFITS OF VERTICAL STRUCTURE, AGILITY AND RESILIENCE
WHICH SUPPORTED OUR COVID-19 RECOVERY
Energy
Storage vertical
H1 2020 H1 2021 H1 2020 H1 2021 H1 2020 H1 2021
R2,5bn R3,3bn R1,9bn R3,5bn R3,9bn R5,9bn
Revenue 57% 48% 43% 52%
contribution contribution contribution contribution
32% 88% 53%
Operating R74m R328m -R48m R254m -R18m R545m
Profit
281% 56% -181% 44%
contribution contribution contribution contribution
342%
Return
PBIT : 3.0% PBIT : 10.1% PBIT : -2.6% PBIT : 7.3% PBIT : -0.5% PBIT : 9.2%
metrics
ROIC: 11.0% ROIC: 23.5% ROIC: 11.0% ROIC: 22.3% ROIC: 7.8% ROIC: 16.3%
*
* VERTICALS - ROIC IS BASED AT AN OPERATIONAL LEVEL
METAIR GROUP – ROIC NOW PRESENTED ON AN UNADJUSTED BASIS
12H1 2021 VERTICAL PERFORMANCE – ‘PRE COVID-19’
METAIR’S RECOVERY IS AHEAD OF EXPECTATION DESPITE VARIOUS SUPPLY CHAIN DISRUPTIONS
IMPACTING MANUFACTURING EFFICIENCY AND LOGISTICS COST.
Energy
Storage vertical
H1 2019 H1 2021 H1 2019 H1 2021 H1 2019 H1 2021
R3,0bn R3,3bn R3,0bn R3,5bn R5,3bn R5,9bn
Revenue 51% 48% 49% 52%
contribution contribution contribution contribution
7% 17% 11%
Operating R289m R328m R302m R254m R499m R545m
Profit
49% 56% 51% 44%
contribution contribution contribution contribution
13% 16% 9%
Return
PBIT : 9.5% PBIT : 10.1% PBIT : 10.1% PBIT : 7.3% PBIT : 9.3% PBIT : 9.2%
metrics
ROIC: 19.2% ROIC: 23.5% ROIC: 34.3% ROIC: 22.3% ROIC: 15.6% ROIC: 16.3%
*
* VERTICALS - ROIC IS BASED AT AN OPERATIONAL LEVEL
METAIR GROUP – ROIC NOW PRESENTED ON AN UNADJUSTED BASIS
13FINANCIAL HIGHLIGHTS: INCOME STATEMENT
• Revenue increased to R5.9bn and operating margin up 9.6ppt
R'million Dec 2020 Jun 2020 Jun 2021 % Change to 9.2%, driven by strong volume recovery in both verticals
Revenue 10 235 3 880 5 934 53% • Group operating profit increase of R563m, mainly attributed to:
EBITDA (incl. share of assoc.) 783 31 701 2 183%
EBITDA (incl. share of assoc. excl. impairm.) 891 139 701 405% › Improved volumes and capacity utilisation
1
Other operating income 118 75 74 (1%) › Record first half operating performance in Energy Storage
Operating profit/(loss) 561 (18) 545 3 115%
Operating profit/(loss) margin (%) 5,5% (0,5%) 9,2% 9,6ppt › One off employee support and direct Covid-19 costs,
Net interest expense (164) (91) (64) 30% totalling R75m in H1’20, not repeated
Profit/(loss) after tax 185 (216) 344 259%
› Auto components experienced supply chain disruptions,
Effective tax rate (%) 37,6% 4,0% 28,9% (24,9ppt)
significant airfreight and overtime costs which are ongoing
ROA (%) 5,9% 5,2% 14,6% 9,4ppt
4,3% 2,7% 18,1% 15,4ppt
• Net forex loss of R44m (H1’20: loss of R22m), mainly in Turkey
ROE (%)
Undjusted ROIC (%) 8,6% 7,8% 16,3% 8,5ppt • Other income relatively consistent at R74m
Adjusted ROIC (%) 6,4% 6,4% 11,6% 5,2ppt • Profit after tax recovered to R344m, aided by lower net interest
charge of R64m
1
• Effective tax rate of 29%, impacted by increased Turkish
Other income breakdown Dec 2020 Jun 2020 Jun 2021
corporate income tax rates which increased from 22% to 25%
Government grants and similar 93 40 47
Derivatives* 2 22 12 • ROE of 18.1% exceeds FY19 of 15.3%
Other 23 13 15
Other operating income 118 75 74
* Refers to mark to market valuation gains/(losses) on
forward exchange and similar contracts
14FINANCIAL HIGHLIGHTS: INCOME STATEMENT
R'million Dec 2020 Jun 2020 Jun 2021 % Change
Attributable profit/(loss) 174 (216) 327 252%
Headline earnings/(loss) 284 (107) 327 407%
Earnings/(loss) per share (cents per share) 91 (112) 170 251%
Weighted avg. number of shares ('000) 192 118 191 942 192 618FINANCIAL HIGHLIGHTS: BALANCE SHEET
• Non-current assets decreased marginally from December due
to:
R'million Dec 2020 Jun 2020 Jun 2021
Non-current assets 3 760 4 154 3 625
› Delayed 2020 capital spend off-set by depreciation and
amortisation
Property, plant and equipment 2 618 2 861 2 583
Intangible assets 504 652 405 › Spot currency TL devaluation of 17% in Mutlu
Other non-current assets 638 641 637 • Inventory higher, operating cycle levels much higher in Energy
Current assets 5 539 4 988 5 289 Storage. Longer lead times combined with supply chain
Inventory 1 695 2 034 1 929 disruption impact in Automotive Components
Trade and other receivables 1 819 1 292 1 944 • Trade receivables and cash recovery was strong
Contract assets 382 326 279 • Net cash at bank of R1.1bn
Cash and cash equivalents 1 624 1 279 1 111
Other current assets 19 57 26
Total assets 9 299 9 142 8 914
16FINANCIAL HIGHLIGHTS: BALANCE SHEET
• Total net borrowings of R1.2 billion, consistent with Dec’20 but
R'million Dec 2020 Jun 2020 Jun 2021
will increase as new projects are completed
Total equity 4 215 4 215 4 013 • RCF funding successfully extended for up to 5 years -
Non-current liabilities 1 028 2 162 1 022 agreements and pricing to be concluded imminently
Borrowings 519 1 589 560 • Equity decrease reflects the increase in foreign currency losses
Post employment benefits 91 93 86 (‘FCTR’) largely due to Mutlu and dividend payments
Deferred taxation 251 287 218
Deferred grant income 125 151 117
Provision for liabilities and charges 42 42 41
Current liabilities 4 056 2 765 3 879
Trade and other payables 1 873 1 286 1 895
Contract liabilities 118 91 106
Borrowings 1 851 1 006 1 694
Provision for liabilities and charges 83 71 72
Bank overdrafts 59 61 29
Other current liabilities 72 11 83
Total liabilities 5 084 4 927 4 901
17FINANCIAL HIGHLIGHTS: BALANCE SHEET
• Net working capital days improved to 64 days, from the
R'million Dec 2020 Jun 2020 Jun 2021
position at Dec’20 as well as prior year. Although days
improved, this still resulted in a R247m (from Dec’20) increase
Inventory 1 695 2 034 1 929
in net working capital.
Trade and other receivables 1 819 1 292 1 944
Trade and other payables (1 873) (1 286) (1 895) • Supply chain has had a major impact on our ability to plan
Contract assets/liabilities - net 264 235 174 and execute on our working capital strategy.
Total net working capital 1 905 2 275 2 152 • Main features are:
› Higher inventory and debtor balances at Mutlu; as a result
Days Dec 2020 Jun 2020 Jun 2021
of the increased activity levels
Inventory 60 76 57
› Although attempting to increase safety stock levels to
Trade and other receivables 65 48 58
support our customers, shipping delays and commodity
Trade and other payables (67) (48) (56)
shortages are preventing us to maintain optimal levels
Contract assets/liabilities - net 10 9 5
Total days 68 85 64
All days calculations based on turnover
18FINANCIAL HIGHLIGHTS: CAPITAL AND DEBT STRUCTURE
STRONG FINANCIAL POSITION - PROACTIVE CAPITAL AND DEBT MANAGEMENT
• Net debt increased due to a combination of higher operating
% Dec 2020 Jun 2020 Jun 2021 levels and new project investments for customer models and
Debt* : Equity 58% 63% 58% facelifts
Net debt** : Equity 20% 34% 30% • All covenant requirements met at June 2021, with net
debt/EBITDA within 2 times target requirements
Dec 2020 Jun 2020 Jun 2021
• Gearing at comfortable levels, around the 25-35% average
Net debt** (R'million) 805 1 378 1 171
target
Net debt** : EBITDA (incl. share of assoc.) 1,0 1,9 0,8
0,9 1,6 0,8
• Successfully raised funding for Hesto of R850m in July
Net debt** : EBITDA (excl. impairment of assoc.)
• R600m, 5 year term loan at 245bps above JIBAR
* Interest bearing borrowings
** Includes overdrafts and cash equivalents • R250m, 3 year RCF at 225bps above JIBAR
• Also successfully extended maturity of R750m group RCF
facility by 5 years, at 225bps above JIBAR
Financial covenant ratio Covenant level Compliance Dec 2020 Jun 2020 Jun 2021
• And received favourable terms for the extension of our R840m
Dividend and interest Not less than
Y 5,44 3,90 10,21
preference share funding, maturing in December 2021
cover ratio 3 times
Total net borrowings to Not more than
Y 1,40 1,88 0,98
adjusted EBITDA ratio 2.5 times
Not more than
Priority debt covenant Y (0,37) (0,15) 0,06
1 times
19CAPITAL EXPENDITURE AND COMMITMENTS (INCLUDING HESTO)
R1.2BN ALLOCATED CAPITAL STILL TO BE SPENT, LARGELY FOR CUSTOMER NEW MODELS AND EXPANSION
2021 is a significant year of investment for secured new model
Capital expenditure spent to date launches and facelifts for Toyota, Ford, VW and Isuzu
Health, • Total capital expenditure approved as at Dec’20, for 2021,
Vertical Maintenance Efficiency safety & was R1.3 billion and a further R272 million was approved during
R'million & general & expansion environ. Total H1’21
Energy storage 59 22 4 85
• Majority of remaining committed capex spend at Hesto,
Automotive components 32 273 2 307
Automould and Lumotech for the approved new Ford Ranger
Total commitments 91 295 6 392
• Capital expenditure mainly in Automotive Components and
additional allocations to support new customer requests
Remaining capital commitments to be undertaken • Investments for new Corolla Cross compact SUV as well as VW,
Health, Isuzu and Toyota Hilux facelifts in progress
Vertical Maintenance Efficiency safety & • Energy Storage capacity and efficiency enhancements,
R'million & general & expansion environ. Total mostly in AGM technology due to customer demand. This
Energy storage 96 225 30 351 capex is supported by a 55% new technology incentives
Automotive components 73 746 9 828
Total commitments 169 971 39 1 179
20H1 2021 RESULTS AT A GLANCE: AUTOMOTIVE COMPONENTS VERTICAL
Revenue PBIT EBITDA
88% 632% 1 548%
R3.5bn R254m R339m
Free cash PBIT % ROIC
flow
63% 9.9ppt 11.3ppt
-R128m 7.3% 22.3%
• Turnover recovered to 116% of 2019 levels • Free cash for the period improved when compared to H1’20
• Significant shipping and supply chain disruptions resulted in levels, and capital expenditure on projects is significantly up at
R60m unplanned expenses on airfreight of raw material supplies R307m
• Hesto incurred R30m in project costs for new models and • ROIC improved to 22.3% from 4.8%, as we anticipated in the U-
significant premium airfreight costs shape recovery approach
• Lumotech performed strongly, gaining excellent top line growth
with key customers
21H1 2021 RESULTS AT A GLANCE: ENERGY STORAGE VERTICAL
Revenue PBIT EBITDA
32% 342% 134%
R3.3bn R328m R418m
Free cash PBIT % ROIC
flow
-129% 7.1ppt 12.5ppt
-R98m 10.1% 23.5%
• Turnover recovered to 107% of 2019 levels and operating profit • Excellent first half volume performance with a 42%, or 1.2m unit,
of R328m at a healthy margin of 10.1% buoyed by strong increase from the comparative period
automotive aftermarket volumes • FNB performed well and contained input costs in the period
• Mutlu achieved EBIT of TL 86m, translating into R160m, on the • The Industrial segment made a marginal loss of R3m as the
back of stronger exports. Rombat achieved R64m and FNB environment remains very tough
generated R103m at 10% margin
• Achieved ROIC of 23.5%, higher than 2019 levels
• Working capital utilisation increased in line with higher activity
levels, which resulted in a free cash outflow of R98m.
22ENERGY STORAGE AUTOMOTIVE MARGINS WERE STRONG
4 000 • Total automotive battery margins increased from 4.1% to 11.1%
2 988
3 000 Auto Exports
2 232
R’million
2 000 • Auto exports EBIT margin increased from 4.8% to 12.9%
Revenue
1 000 237 272 • Improved quality of earnings at Mutlu and Rombat, with hard
0 currency pricing
H1 2020 H1 2021 Local AM
Automotive Industrial • Local automotive EBIT improved by 237%, or R147m, supported
by stronger demand and improved market share
Industrial
• Industrial EBIT improved by R15m to a loss of R3m, weak
330 industrial demand in tough economic conditions continues
350 (11.1%)
• Actions are in place to restructure the FNB industrial division,
250
R’million
PBIT 92 which is expected to unlock value in the long-term
150 (4.1%) -18 -3
50 (-7.5%) (-1.0%)
-50
H1 2020 H1 2021
Automotive Industrial
23ENERGY STORAGE – OVERALL EXCEPTIONAL RESULTS FOR H1 2021
• FNB’s EBIT increased from R13m to R103m from prior period
comparative
• In ZAR terms, Mutlu’s EBIT increased by R123m from prior period
comparative, delivering R160m compared to R37m
• Rombat operating result up 167% (or R40m), as OES and OEM
sales continued at a higher level in Romania
PBIT (H1) increase in local
currency
Mutlu 495%
Rombat 183%
FNB 669%
Total 505%
24OUTLOOK AND PROSPECTS
25POSITIVE OUTLOOK FOR H2
BUT WITH INCREASED INVESTMENT AND PROJECT COSTS
• Our priority is to support flawless new model launches and facelifts while maintaining positive operating
activity momentum
• We will continue to drive effective project management and improve operating efficiencies to maintain our
current base while investing in the future
• The strong performance and quick recovery in Energy Storage, combined with growth opportunities for
Automotive Components, is providing impetus to refresh our strategic approach around the Energy Storage
Vertical
• Energy Storage will continue to focus on expanding our automotive battery product range
METAIR • We have evaluated the technology, market and demand shift effect on our industrial battery manufacturing
business in South Africa and will strategically shift to a trade focused model
GROUP
• Automotive Components companies enter a pre-production and prototype manufacturing phase for
projects, which will result in increased project costs ahead of model launches
• The impact of increased supply chain costs as well as the project costs related to the investment in our future
could result in margins dipping below the 7% - 9% market guidance in the Automotive Components Vertical
for the year, but with substantial longer-term benefits
• The outlook for the year is dependent on the continued availability of components and raw material
throughout the global supply chain, as well as the logistical and port stability
26KEY FACTORS EXPECTED TO IMPACT FY21 OUTLOOK
• We still expect FY21 local OEM manufacturing levels to be • Expecting strong momentum from H1 to continue in H2, and
>90% of FY19 a much improved full-year outlook for automotive battery
sales volumes
• However we expect our key customer volumes to
approximate FY19 levels • Sustained aftermarket and OEM demand and improved H2
outlook for export
• This is subject to the availability of raw material and chips
impacted by supply chain disruptions • This is barring any further supply chain disruptions impacting
our ability to service and reach our export customers
• Full year EBIT margin will be adversely impacted by project
costs and premium supply chain cost in the short term. As • Margins will be impacted in the short term by continued low
such, full year EBIT margins could drop below 7%. industrial demand and a business model change for FNB’s
industrial business which will attract short term once-off costs
• A further R100m value accretive capex was approved
during H1'21 for additional new project business secured • Full year segmental capex anticipated of between R350m
bringing the total approved capex (incl Hesto) to R1.2bn and R400m, including R150m for AGM technology capacity
expansion in Mutlu to support new contracts awarded
27Q&A
28DISCLAIMER
The information supplied herewith is believed to be correct
but the accuracy thereof at the time of going to print is not guaranteed.
The company and its employees cannot accept liability for loss
suffered in consequence of reliance on the information provided.
Provision of this data does not obviate the need to make further
appropriate enquiries and inspections.
The financial information has not been reviewed or reported on by the company’s external auditors,
and shareholders are advised that any forecast financial information contained
in this announcement has not been reviewed or reported on by the company’s auditors
and is the responsibility of the directors of the company.
29APPENDICES
30ENERGY STORAGE VOLUMES (LAST TWELVE MONTHS)(ROUNDED)
1. Total volumes by operation (including 2. Automotive volumes by market 3. Mutlu automotive volumes
industrial)
4. Rombat automotive volumes 5. FNB automotive volumes 6. Industrial volumes
31You can also read


