2021 Drinking Water Quality Report - For Calendar Year 2020 - Brighton Colorado
←
→
Page content transcription
If your browser does not render page correctly, please read the page content below
COLORADO
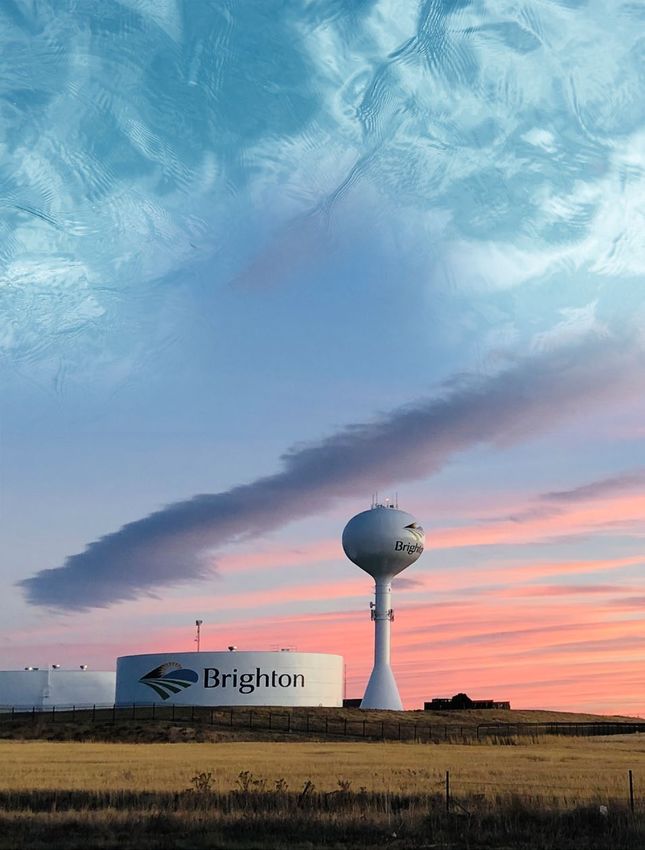
2021 Drinking Water Quality Report
For Calendar Year 2020
Public Water System ID: CO0101025
Esta es información importante. Si no la pueden leer,
necesitan que alguien se la traduzca.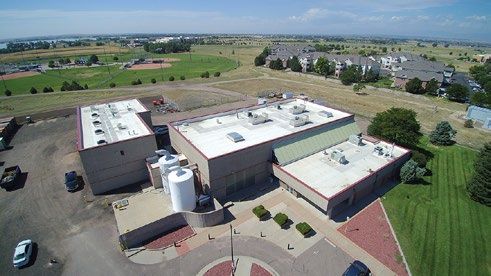
Source Water Assessment and
  We are pleased to present to you this year’s water quality
  report. Our constant goal is to provide you with a safe and
                                                                                                  Protection (SWAP)
  dependable supply of drinking water. Please contact BRETT
                                                                                                  The Colorado Department of Public Health and Environment
  SHERMAN at 303-655-2008 with any questions or for public
                                                                                                  may have provided us with a Source Water Assessment Report
  participation opportunities that may affect water quality.
                                                                                                  for our water supply. For general information or to obtain a
                                                                                                  copy of the report please visit wqcdcompliance.com/ccr. The
  Please see the water quality data from our wholesale system(s)
                                                                                                  report is located under “Guidance: Source Water Assessment
  (either attached or included in this report) for additional
                                                                                                  Reports”. Search the table using 101025, BRIGHTON CITY OF,
  information about your drinking water.
                                                                                                  or by contacting BRETT SHERMAN at 303-655-2008. The Source
                                                                                                  Water Assessment Report provides a screening-level evaluation
Lead in Drinking Water                                                                            of potential contamination that could occur. It does not mean
Exposure to lead in drinking water can cause serious health effects in all                        that the contamination has or will occur. We can use this
age groups. Infants and children can have decreases in IQ and attention                           information to evaluate the need to improve our current water
span. Lead exposure can lead to new learning and behavior problems                                treatment capabilities and prepare for future contamination
or exacerbate existing learning and behavior problems. The children of                            threats. This can help us ensure that quality finished water
women who are exposed to lead before or during pregnancy can have                                 is delivered to your homes. In addition, the source water
increased risk of these adverse health effects. Adults can have increased                         assessment results provide a starting point for developing a
risks of heart disease, high blood pressure, kidney or nervous system                             source water protection plan. Potential sources of contamination
problems. It is possible that lead levels at your home may be higher                              in our source water area are listed on the next page.
than other homes in the community as a result of materials used in your
home’s plumbing. If you are concerned about lead in your water, you                               Please contact us to learn more about what you can do to help
may wish to have your water tested. When your water has been sitting                              protect your drinking water sources, any questions about the
for several hours, you can minimize the potential for lead exposure by                            Drinking Water Quality Report, to learn more about our system,
flushing your tap for 30 seconds to 2 minutes before using water for                              or to attend scheduled public meetings. We want you, our
drinking or cooking. Additional information on lead in drinking water,                            valued customers, to be informed about the services we provide
testing methods, and steps you can take to minimize exposure is avail-                            and the quality water we deliver to you every day.
able from the Safe Drinking Water Hotline (1-800-426-4791) or at epa.
gov/safewater/lead.

Detected Contaminants
CITY OF BRIGHTON routinely monitors for contaminants in your drinking water according to Federal and State laws. The following table(s)
show all detections found in the period of January 1 to December 31, 2020 unless otherwise noted. The State of Colorado requires us to monitor
for certain contaminants less than once per year because the concentrations of these contaminants are not expected to vary significantly from
year to year, or the system is not considered vulnerable to this type of contamination. Therefore, some of our data, though representative, may be
more than one year old. Violations and Formal Enforcement Actions, if any, are reported in the next section of this report.

Note: Only detected contaminants sampled within the last 5 years appear in this report. If no tables appear in this section then no contaminants
were detected in the last round of monitoring.

Terms and Abbreviations Used in the Preceding Tables
 Maximum Contaminant Level (MCL) − The highest level of a contaminant allowed                 Gross Alpha (No Abbreviation) − Gross alpha particle activity compliance value. It
 in drinking water.                                                                           includes radium-226, but excludes radon 222, and uranium.

 Treatment Technique (TT) − A required process intended to reduce the level of a              Picocuries per liter (pCi/L) − Measure of the radioactivity in water.
 contaminant in drinking water.
                                                                                              Nephelometric Turbidity Unit (NTU) − Measure of the clarity or cloudiness of water.
 Health-Based − A violation of either a MCL or TT.                                            Turbidity in excess of 5 NTU is just noticeable to the typical person.

 Non-Health-Based − A violation that is not a MCL or TT.                                      Compliance Value (No Abbreviation) – Single or calculated value used to determine
                                                                                              if regulatory contaminant level (e.g. MCL) is met. Examples of calculated values are
 Action Level (AL) − The concentration of a contaminant which, if exceeded, triggers          the 90th Percentile, Running Annual Average (RAA) and Locational Running Annual
 treatment and other regulatory requirements.                                                 Average (LRAA).

 Maximum Residual Disinfectant Level (MRDL) − The highest level of a disinfectant             Average (x-bar) − Typical value.
 allowed in drinking water. There is convincing evidence that addition of a disinfectant
 is necessary for control of microbial contaminants.                                          Range (R) − Lowest value to the highest value.

 Maximum Contaminant Level Goal (MCLG) − The level of a contaminant in drink-                 Sample Size (n) − Number or count of values (i.e. number of water samples collected).
 ing water below which there is no known or expected risk to health. MCLGs allow for
 a margin of safety.                                                                          Parts per million = Milligrams per liter (ppm = mg/L) − One part per million corre-
                                                                                              sponds to one minute in two years or a single penny in $10,000.
 Maximum Residual Disinfectant Level Goal (MRDLG) − The level of a drinking wa-
 ter disinfectant, below which there is no known or expected risk to health. MRDLGs           Parts per billion = Micrograms per liter (ppb = ug/L) − One part per billion corre-
 do not reflect the benefits of the use of disinfectants to control microbial contaminants.   sponds to one minute in 2,000 years, or a single penny in $10,000,000.

 Violation (No Abbreviation) − Failure to meet a Colorado Primary Drinking Water              Not Applicable (N/A) – Does not apply or not available.
 Regulation.
                                                                                              Level 1 Assessment – A study of the water system to identify potential problems
 Formal Enforcement Action (No Abbreviation) − Escalated action taken by the                  and determine (if possible) why total coliform bacteria have been found in our water
 State (due to the risk to public health, or number or severity of violations) to bring a     system.
 non-compliant water system back into compliance.
                                                                                              Level 2 Assessment – A very detailed study of the water system to identify potential
 Variance and Exemptions (V/E) − Department permission not to meet a MCL or                   problems and determine (if possible) why an E. coli MCL violation has occurred
 treatment technique under certain conditions.                                                and/or why total coliform bacteria have been found in our water system on multiple
                                                                                              occasions.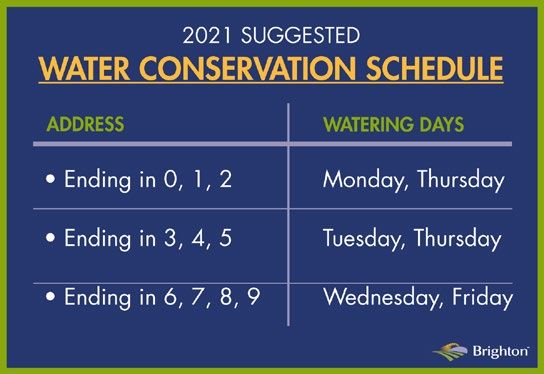
General Information About Drinking Water

   All drinking water, including bottled water, may reasonably be expected to contain at least small amounts of some contaminants. The presence of contami-
   nants does not necessarily indicate that the water poses a health risk. More information about contaminants and potential health effects can be obtained by
   calling the Environmental Protection Agency’s Safe Drinking Water Hotline (1-800-426-4791) or by visiting epa.gov/ground-water-and-drinking-water.

   Some people may be more vulnerable to contaminants in drinking water than the general population. Immunocompromised persons such as persons with
   cancer undergoing chemotherapy, persons who have undergone organ transplants, people with HIV-AIDS or other immune system disorders, some elder-
   ly, and infants can be particularly at risk of infections. These people should seek advice about drinking water from their health care providers. For more
   information about contaminants and potential health effects, or to receive a copy of the U.S. Environmental Protection Agency (EPA) and the U.S. Centers
   for Disease Control (CDC) guidelines on appropriate means to lessen the risk of infection by Cryptosporidium and microbiological contaminants call the
   EPA Safe Drinking Water Hotline at (1-800-426-4791).

   The sources of drinking water (both tap water and bottled water) include rivers, lakes, streams, ponds, reservoirs, springs, and wells. As water travels over
   the surface of the land or through the ground, it dissolves naturally occurring minerals and, in some cases, radioactive material, and can pick up substances
   resulting from the presence of animals or from human activity. Contaminants that may be present in source water include:

      Microbial contaminants: viruses and bacteria that may come from sewage treatment plants, septic systems, agricultural livestock operations, and
      wildlife.

      Inorganic contaminants: salts and metals, which can be naturally-occurring or result from urban storm water runoff, industrial or domestic wastewater
      discharges, oil and gas production, mining, or farming.

      Pesticides and herbicides: may come from a variety of sources, such as agriculture, urban storm water runoff, and residential uses.

      Radioactive contaminants: can be naturally occurring or be the result of oil and gas production and mining activities.

      Organic chemical contaminants: including synthetic and volatile organic chemicals, which are byproducts of industrial processes and petroleum pro-
      duction, and also may come from gas stations, urban storm water runoff, and septic systems.

   In order to ensure that tap water is safe to drink, the Colorado Department of Public Health and Environment prescribes regulations limiting the amount
   of certain contaminants in water provided by public water systems. The Food and Drug Administration regulations establish limits for contaminants in
   bottled water that must provide the same protection for public health.

Our Water Sources

               Source                     Source Type                   Water Type

      PURCHASED WATER FROM                  Consecutive
                                                                        Surface Water
           THORNTON                         Connection

               WELL 7R                         Well                   Groundwater-Well

            BEEBE WELL A                       Well            Groundwater UDI Surface Water

            BEEBE WELL B                       Well            Groundwater UDI Surface Water

            BEEBE WELL C                       Well            Groundwater UDI Surface Water

               WELL 11                         Well                     Groundwater

               WELL 12                         Well                     Groundwater

               WELL 13                         Well                     Groundwater

               WELL 17                         Well                     Groundwater

               WELL 18                         Well                     Groundwater

Potential Source(s) of Contamination
EPA Hazardous Waste Generators, EPA Chemical Inventory/Storage Sites, EPA Toxic Release Inventory Sites, Aboveground, Underground
and Leaking Storage Tank Sites, Existing/Abandoned Mine Sites, Other Facilities, Commercial/Industrial/Transportation, High Intensity
Residential, Low Intensity Residential, Urban Recreational Grasses, Row Crops, Fallow, Small Grains, Pasture / Hay, Septic Systems, Oil / Gas
Wells, Road Miles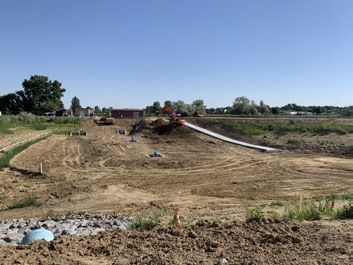
Lead and Copper Sampled in the Distribution System
Contaminant Name Time Period 90th Sample Size Unit of 90th Sample Sites 90th Typical Sources
Percentile Measure Percentile AL Above AL Percentile AL
Exceedance
Copper 06/05/2020 to 0.81 34 ppm 1.3 1 No Corrosion of household
09/09/2020 plumbing systems; Erosion of
natural deposits
Lead 06/05/2020 to 2 34 ppb 15 0 No Corrosion of household
09/02/2020 plumbing systems; Erosion of
natural deposits
Disinfectants Sampled in the Distribution System
At least 95% of samples per period (month or quarter) must be at least 0.2 ppm OR if sample size is less than 40 no more than 1 sample is below 0.2 ppm.
Typical Sources: Water additive used to control microbes
Disinfectant Name Time Period Results Number of Samples Sample Size TT Violation MRDL
Below Level
Chlorine December, 2020 Lowest period percent- 0 40 No 4.0 ppm
age of samples meeting
TT requirement: 100%
Disinfection Byproducts Sampled in the Distribution System
Name Year Average Range Sample Unit of MCL MCLG MCL Typical Sources
Low – High Size Measure Violation
Total Haloacetic Acids 2020 18.48 7.2 to 27.4 16 ppb 60 N/A No Byproduct of drinking water disinfection
(HAA5)
Total Trihalomethanes 2020 52.76 23.9 to 93.5 16 ppb 80 N/A No Byproduct of drinking water disinfection
(TTHM)
Summary of Turbidity Sampled at the Entry Point to the Distribution System
Contaminant Name Sample Date Level Found TT Requirement TT Typical
Violation Sources
Turbidity Aug. 2020 Highest single measurement: Maximum 1 NTU for any single No Soil Runoff
0.316 NTU measurement
Turbidity Dec. 2020 Lowest monthly percentage of samples meeting TT In any month, at least 95% of samples No Soil Runoff
requirement for our technology: 100% must be less than 0.3 NTU
Radionuclides Sampled at the Entry Point to the Distribution System
Contaminant Name Year Average Range Sample Unit of MCL MCLG MCL Violation Typical Sources
Low – High Size Measure
Combined Uranium 2016 2.75 2.6 to 2.9 2 ppb 30 0 No Erosion of natural deposits
Inorganic Contaminants Sampled at the Entry Point to the Distribution System
Contaminant Year Average Range Sample Unit of MCL MCLG MCL Typical Sources
Name Low – High Size Measure Violation
Arsenic 2020 1 1 to 1 2 ppb 10 0 No Erosion of natural deposits; runoff from orchards;
runoff from glass and electronics production wastes
Barium 2020 0.02 0.02 to 0.02 2 ppm 2 2 No Discharge of drilling wastes; discharge from metal
refineries; erosion of natural deposits
Chromium 2020 3 3 to 3 2 ppb 100 100 No Discharge from steel and pulp mills; erosion of
natural deposits
Fluoride 2020 0.58 0.56 to 0.6 2 ppm 4 4 No Erosion of natural deposits; water additive which
promotes strong teeth; discharge from fertilizer and
aluminum factories
Nitrate 2020 3.7 3.7 to 3.7 2 ppm 10 10 No Runoff from fertilizer use; leaching from septic tanks,
sewage; erosion of natural deposits
Selenium 2020 2 2 to 2 2 ppb 50 50 No Discharge from petroleum and metal refineries; ero-
sion of natural deposits; discharge from mines
Volatile Organic Contaminants Sampled at the Entry Point to the Distribution System

  Contaminant           Year     Average             Range            Sample         Unit of   MCL         MCLG       MCL Violation                     Typical Sources
     Name                                          Low – High          Size          Measure

  Ethylbenzene          2020        .17              0 to 0.5           6              ppb      700            700         No                 Discharge from petroleum refineries

     Xylenes            2020       2.42             0.7 to 4.4          6              ppb     10,000       10,000         No            Discharge from petroleum factories; discharge
                                                                                                                                                    from chemical factories

                                                                                Secondary Contaminants**
**Secondary standards are non-enforceable guidelines for contaminants that may cause cosmetic effects (such as skin, or tooth discoloration) or aesthetic effects (such as taste, odor, or
                                                                            color) in drinking water.
       Contaminant Name                     Year           Average                   Range            Sample Size          Unit of Measure                  Secondary Standard
                                                                                    Low-High

               Sodium                       2020                 49             48.6 to 49.4               2                     ppm                                 N/A

                                                                               Unregulated Contaminants***
EPA has implemented the Unregulated Contaminant Monitoring Rule (UCMR) to collect data for contaminants that are suspected to be present in drinking water and do not have
health-based standards set under the Safe Drinking Water Act. EPA uses the results of UCMR monitoring to learn about the occurrence of unregulated contaminants in drinking water
and to decide whether or not these contaminants will be regulated in the future. We performed monitoring and reported the analytical results of the monitoring to EPA in accordance
with its Unregulated Contaminant Monitoring Rule (UCMR). Once EPA reviews the submitted results, the results are made available in the EPA’s National Contaminant Occurrence
Database (NCOD) (epa.gov/dwucmr/national-contaminant-occurrence-database-ncod) Consumers can review UCMR results by accessing the NCOD. Contaminants that were detect-
ed during our UCMR sampling and the corresponding analytical results are provided below.
      Contaminant Name                        Year                          Average                   Range: Low – High                   Sample Size                Unit of Measure

               None                          N/A                             N/A                               N/A                            N/A                          N/A
          Germanium                           2018                           BDL                          BDL-BDL                               9                          µg/L
          Manganese                           2018                           4.65                         BDL-15.0                              9                          µg/L
 alpha-hexachlorocyclohexane                  2018                           BDL                          BDL-BDL                              11                          µg/L
          Chlorpyrifos                        2018                           BDL                          BDL-BDL                              11                          µg/L
          Dimethipin                          2018                           BDL                          BDL-BDL                              11                          µg/L
           Ethoprop                           2018                           BDL                          BDL-BDL                              11                          µg/L
          Oxyfluorfen                         2018                           BDL                          BDL-BDL                              11                          µg/L
           Profenofos                         2018                           BDL                          BDL-BDL                              11                          µg/L
         Tebuconazole                         2018                           BDL                          BDL-BDL                              11                          µg/L
        Total Permethrin                      2018                           BDL                          BDL-BDL                              11                          µg/L
            Tribufos                          2018                           BDL                          BDL-BDL                              11                          µg/L
           1-Butanol                          2018                            .79                         BDL-8.69                             11                          µg/L
       2-Methoxyethanol                       2018                           BDL                          BDL-BDL                              11                          µg/L
         2-propen-1-ol                        2018                           BDL                          BDL-BDL                              11                          µg/L
   Butylated Hydroxyanisole                   2018                           BDL                          BDL-BDL                              10                          µg/L
          O-Toluidine                         2018                           BDL                          BDL-BDL                              10                          µg/L
           Quinoline                          2018                           BDL                          BDL-BDL                              10                          µg/L
               HAA5                           2018                           17.92                         6.6-39.7                            15                          µg/L
            HAA6Br                            2018                           21.58                        12.6-39.6                            15                          µg/L
               HAA9                           2018                           34.96                        16.6-72.3                            15                          µg/L
     Total Organic Carbon                     2018                           3010                         2600-3700                             3                          µg/L
            Bromide                           2018                            280                          280-280                              3                          µg/L
       Total Microcystin                      2020                           BDL                          BDL-BDL                              24                          µg/L
      Cylindrospermopsin                      2020                           BDL                          BDL-BDL                              24                          µg/L
          Anatoxin-A                          2020                           BDL                          BDL-BDL                              24                          µg/L
***More information about the contaminants that were included in UCMR4 monitoring can be found at:
drinktap.org/Water-Info/Whats-in-My-Water/Unregulated-Contaminant-Monitoring-Rule-UCMR. Learn more about the EPA UCMR at:
epa.gov/dwucmr/learn-about-unregulated-contaminant-monitoring-rule or contact the Safe Drinking Water Hotline at (800) 426-4791 or
epa.gov/ground-water-and-drinking-water.

                                                     Violations, Significant Deficiencies, and Formal Enforcement Actions

                                                                        No Violations or Formal Enforcement Actions
WATER EFFICIENCY AND CONSERVATION
EFFORTS
The City is asking for voluntary conservation
measures from residents, requesting that
residents water every third day in order to
meet a 20% demand reduction. Provided this
target can be met throughout the summer,
the conservation measures will remain
voluntary. Sprinkler system audits are offered
free of charge by contacting the Utilities
Department and are recommended to get
the best efficiency for your system. If you need
assistance with your irrigation system or would
like a consultation please contact Louis Morris
at lamorris@brightonco.gov, or call
303-655-2243.

Please see your assigned watering days to the
right. Days are assigned by the last number of
an address.

STORMWATER PROGRAM
Did you know the City of Brighton has a Stormwater Program? The primary goal of the City of
Brighton Stormwater Program is to reduce the amount of pollutants entering our local streams,
lakes and rivers. Pollutants, such as fertilizers, pesticides, sediment, trash and spilled chemicals
may be transported by stormwater runoff from residential, commercial and industrial areas into
the storm sewer system. This discharges directly into our local waterways, causing water
pollution. Unlike the wastewater in our sewer system, stormwater is not treated before entering
our streams, rivers and lakes.

So how does this pollution from stormwater runoff occur? Nutrient loading, when excessive
amounts of nutrients (mainly Nitrogen and Phosphorus) enter our waterways, is the biggest
culprit for pollution. Nitrogen and Phosphorus naturally exist in our environment, but also tend to
excessively end up in our stream, rivers and lakes. This type of pollution can cause problems for
wildlife, algae blooms, water quality and flooding during storms. The most common sources of this type of
pollution in our community are leaf litter (plant leaf debris), fertilizer (lawn and garden) and pet waste.

What can I do to help prevent nutrient loading in Brighton? Easy, mindful behavioral practices can go a long way
to reducing the pollution that reaches our waterways. Check out the handy pollution prevention chart below:

                                            STORMWATER POLLUTION PREVENTION DO’S & DON’TS
  WHAT IS THE POLLUTION SOURCE?                     DON’T                                               DO

  Fertilizer: Improper application of fertilizer   • Apply fertilizer to your lawn when grass is not   • Read the fertilizer bag labels and apply
  leads to runoff into storm drainage system.       actively growing or when ground is frozen.          according to label directions.
                                                   • Apply fertilizer to paved surfaces.               • Sweep up any excess or spilled fertilizer
                                                                                                        and dispose it properly.

  Pet Waste: During rain events, pet waste         • Let your pet poop or pee in or near               • Always pick up after your pet, even in
  washes off into storm drainage system,            waterways.                                          your yard.
  ending up in local waterways.
                                                   • Dispose of pet waste in the storm drain or the • Spread the word, help your neighbor!
                                                    street.
                                                                                                       • Carry extra bags to share on your walks
                                                                                                        or request/create pet waste bag
                                                                                                        holders in your local parks.

  Leaf Litter: Gathering of leaves, grass          • Blow, rake or sweep yard debris into the          • Bag your yard debris and dispose of
  clippings and other yard debris in                roadways.                                           properly.
  roadways.
                                                                                                        Compost your yard waste for gardens
                                                                                                       • and flower beds.
YOUR BRIGHTON WATER PROJECTS
Non-Potable Pump Station Complete
The non-potable pond pump station rehabilitation project was
completed in June of this year. The scope of the project is to
increase reliability and capacity for pumping non-potable
water for irrigating a number of the City's public parks and
open spaces. Non-potable water from the water treatment
plant is used (as opposed to treated water) to save on costs
associated with treating water that will not be used for drinking
and cooking. Non-potable water also provides a more
sustainable irrigation water source. In addition to a new pump
station, the project includes new intake structures, an access
ramp to allow for more efficient maintenance in the pond and
an updated inlet structure.
New Elevated Storage Tank North Outfall Project
You will also be seeing Brighton has a history of flooding in the older
the construction of an part of town, known as the Core City. The
additional elevated problems that are being solved with the North
water storage tank over Outfall Project are those between 4th Avenue
the next several months. and Denver Street and south to Bridge Street
Storage provides added and to the east. The project will effectively
range to the plant's eliminate flooding in that part of town.
capacity for meeting
peak demands and As a part of the project, the contractor is installing pipe from 72-inch (by
providing for fire Public Works Shops) incrementally smaller to a 30-inch pipe at about 7th Ave.
protection supply. This and Bridge Street, with the collector pipe going on 7th Avenue from Denver
new tank will provide to Bridge Streets. Because of the disruption of the large pipe being
pressure and storage constructed on 7th Avenue, the gas line and water line are also in the
redundancy to further process of being replaced and relocated to make room for the storm sewer.
improve the ability to The street will be repaved as a part of the project.
meet Brighton's water
needs. The project is being managed by the Mile High Flood District, an organization
that mitigates regional drainage problems. The City of Brighton is a member,
paid for by residents through a mill levy on property taxes.
Expansion of Our Water Treatment Plant
The water treatment facility upgrades are nearing the end of
the design phase and moving into actual construction soon. In
order to meet upgraded State discharge requirements and
increase supply capacity to serve our growing community
Water quality will remain exceptional and improvements to
delivery and consistency are anticipated. The existing plant has
a total supply capacity of 10.5 million gallons (MGD) per day
and the City purchases an additional 2.0MGD from
Thornton/Westminster in order to meet the peak demands. In
the last few years, this peak demand has been nearly
equivalent to the peak supply in the heat of the summer and
the plant upgrades are overdue and sorely needed. Expected
completion of the plant upgrades will be in December of 2024.
Thank you in advance for your community spirit.
We are excited about the coming improvements!Utilities Customer Service
City of Brighton
500 South 4th Avenue
Brighton, CO 80601
Come learn about the city while
enjoying a meal, kids’ activities and
live music!
FREE TO THE PUBLIC
FOOD IS FIRST COME,
FIRST SERVED
Thursday, July 22
5:30 - 8 p.m.
Carmichael Park
650 Southern Street
While here, enjoy a concert from our FLIX & KICKS summer series with music from
6 Million Dollar Band at 6 p.m.
Be sure to visit our Utilities booth and ask us about your water!You can also read