2020 Environmental, Social and Governance Report

Page created by Tyler Hopkins
 
CONTINUE READING
2020 Environmental, Social and Governance Report
2020 Environmental,
Social and Governance
Report
2020 Environmental, Social and Governance Report
European EPC Ratings
                                European
                                   Summary     European
                                         EPC Ratings    EPC Ratings
                                                     Summary European
                                                                    Summary
                                                                   European     European
                                                                       EPC Ratings  Summary
                                                                            Portfolio      EPC Ratings
                                                                                      – European
                                                                                        Transition      Summary
                                                                                                         European
                                                                                                  Portfolio
                                                                                                   to Renewable     Portfolio
                                                                                                            – Transition
                                                                                                                  Energy to European
                                                                                                                              – Transition
                                                                                                                            RenewablePortfolio
                                                                                                                                        Energy –European
                                                                                                                                           to Renewable
                                                                                                                                                 TransitionPortfol
                                                                                                                                                          Energy
                                                                                                                                                            to Re
              100% Coverage (EPC Ratings100%
                                         by Area)            100% Coverage
                                             Coverage (EPC Ratings by Area) (EPC Ratings
                                                                                  100% Coverage             100%
                                                                                         by Area) (EPC Ratings    Coverage (EPC Ratings by Area)
                                                                                                               by Area)

                                                                                                       Renewable                Renewable                Renewable             Renewable                  Renewable

                                                                                        31%            Non-Renewable
                                                                                                               31%                    31%
                                                                                                                                Non-Renewable            Non-Renewable         Non-Renewable              Non-Renewable
                                   31%                         31%

ESG Program at a Glance                                                                            5.3%      19.4%     29%    48.8%
                                                                                                                              5.3% 50.5%  29%5.3%48.8%
                                                                                                                                    19.4% 84.9%      19.4%
                                                                                                                                                 82.9%       29%
                                                                                                                                                         50.5%
                                                                                                                                                         78.2% 5.3%48.8%
                                                                                                                                                                84.9%
                                                                                                                                                                 91%  19.4%
                                                                                                                                                                          50.5%
                                                                                                                                                                       82.9%
                                                                                                                                                                       99.3%  29%
                                                                                                                                                                              78.2%
                                                                                                                                                                               99.5%5.3%
                                                                                                                                                                                  84.9%
                                                                                                                                                                                     48.8%
                                                                                                                                                                                       100%
                                                                                                                                                                                        91% 19.4%
                                                                                                                                                                                          82.9%
                                                                                                                                                                                             50.5%
                                                                                                                                                                                               99.3%
                                                                                                                                                                                               100%  29
                                                                                                                                                                                                  78.28

                                             21%                          21%                      21%                  21%                       21%
                           19%          Environmental
                                                19%                          19% 19%                  19% 19%                  19%
                                                                                                                                19%                   Social
                                                                                                                                                         19%

         39%                             100%                               100%                                 10,000                           $19M                              $1.7M
                       1

   Carbon Emissions2                 European Electricity                Portfolio in Utility               Affordable Housing                  Investment in                     Kennedy Wilson
  Reduction in Europe                  from Renewable                      Measurement                     units completed and              Historically Significant                Foundation
  Portfolio vs.6%
                Baseline3                  Sources
                                           6%
                                                  4
                                                                      6%     Program5 6%                           6%
                                                                                                            under construction                Properties in 2020                 Donations in 2020
                                                                                                            in the Western U.S.
                                                                2%        2%                  2%        2%        2%    2%                 2%       2%                2%       2%

                                                                                              Governance
                 A          B       C         A
                                              D        B
                                                       E         CF   A    D
                                                                           G   B    E   C     AF   D    BG   E   C     F AD   G BE        CF       DG        E         F        G

                                                                                                   Up to      Q4        Q1    Up
                                                                                                                               Q2to      Q3
                                                                                                                                         Q4        Q4Up to Q2
                                                                                                                                                   Q1       Q1 Q4 Q3 Q2 Q1UpQ4to Q2 Q4
                                                                                                                                                                              Q3       Q4 Q3 Q1
                                                                                                                                                                                       Q1       Q2  UpQ2
                                                                                                                                                                                                Q1 Q4   toQ3
                                                                                                                                                                                                          Q2 Q1Q4
                                                                                                                                                                                                                Q3Q3 Q2Q
                                                                                                                                                                                                                  Q4

         41% / 59%                                          46% / 54%                               Q3
                                                                                                   2017
                                                                                                             2017
                                                                                                                          27%
                                                                                                                       2018    Q3
                                                                                                                              2018
                                                                                                                              2017
                                                                                                                                        2018
                                                                                                                                        2017      2018Q3 2018
                                                                                                                                                  2018
                                                                                                                                                      2017
                                                                                                                                                                    20192018Q3
                                                                                                                                                           20192017 2018    2018
                                                                                                                                                                           2017     5 201920182018
                                                                                                                                                                             201920182017
                                                                                                                                                                                      2019     2020  Q3
                                                                                                                                                                                               20192018
                                                                                                                                                                                                    2017
                                                                                                                                                                                                        2020  2017
                                                                                                                                                                                                        20192019
                                                                                                                                                                                                      2018     2018
                                                                                                                                                                                                                 2020 20
                                                                                                                                                                                                                 2019201

               Women/Men at                                      Women/Men in                                        Women on our diverse                                  New directors
               Kennedy Wilson                                  Senior Management6                                     Board of Directors                                    since 2018

  Lead independent director                      Regular executive                            Active and                                  Annual                          Board of Directors and
    with well-defined role                          sessions of                         responsive shareholder                         “Say on Pay”                      Senior Management stock
     and responsibilities                      independent directors                         engagement                                    vote                              ownership policy

1 Like-for-like carbon emissions reduction, excluding improvements in carbon intensity of grid electricity
2 Carbon dioxide equivalent
3 The baseline for targets reflects the carbon emissions of the directly managed assets by Kennedy Wilson Europe Real Estate and stabilized by June 30, 2016. The energy consumption data used for the
   baseline is the first full year of normalized data since acquisition and/or stabilization
4 Electricity procured by Kennedy Wilson within directly managed European portfolio
5 Includes properties in Kennedy Wilson’s directly managed global portfolio
6 Senior Management includes team members overseeing a business function and/or those with responsibility for reporting information directly to the Chairman and CEO

                                                                                                                                                                 Kennedy Wilson / ESG Report 2020           1
2020 Environmental, Social and Governance Report
Dear Friends and Shareholders,
Following 2020, a year like no other with a global     that making the right environmental decisions lead
health crisis that affected so many different          to better outcomes and increased engagement
areas of our lives, Kennedy Wilson’s focus on ESG      with our stakeholders.
(environmental, social, and governance) practices
                                                       Under the leadership of President and Board
across our business is more relevant today than
                                                       Member Mary Ricks, we continued to formalize and
perhaps ever before.
                                                       expand ESG initiatives at all levels of the company
2020 proved the resiliency of our people, our          throughout 2020, including our two recent senior
properties, and our business, and shined a spotlight   level appointments that will provide additional
on Kennedy Wilson’s strong infrastructure, nimble      leadership and oversight of our global ESG program.
business operations, and commitment to global          We are pleased to announce that we reached our
communications to best serve and protect tenants       first European carbon emissions reduction goal and
and residents across our real estate portfolio.        are set to announce new ambitions later this year.
Internally, we supported our 210 employees through     We also expanded our utility measurement program
the transition to working from home in March and       across our global portfolio and implemented
throughout the year’s lockdowns, encouraging our       property-level resident/tenant outreach and               included in the full list of organizations that range
team to prioritize their own health and safety and     sustainability initiatives.                               in size and industry type but share a common
that of their families. We are incredibly grateful                                                               commitment to stepping up and caring about being
                                                       Giving back is part of Kennedy Wilson’s DNA, and
for the team’s ability to pivot and adapt to a                                                                   good citizens while giving back to the communities
                                                       we are happy to continue our support for deserving
challenging new reality, while ensuring our business                                                             where they operate.
                                                       philanthropic organizations throughout 2020, with
continued to operate smoothly.
                                                       a focus on the communities where we invest,               I look forward to updating you on our progress this
Buildings have become a focal point in envisioning     Veterans initiatives, education, and children’s health.   coming year as we continue along our ESG journey.
how we can improve on our day to day lives in          Our ESG program and the way the company reports
a post-COVID world and owners, like Kennedy                                    ESG activities continues to
Wilson, are being called on to demonstrate that                                evolve and, as a result of our
properties are sustainable and healthy to attract                              increased efforts, Kennedy
and retain tenants. This emulates our business                                 Wilson earned recognition as
model and values, as we focus on investing in                                  one of the Most Responsible
properties in our core markets, enriching these                                Companies in America by
properties, and strengthening the fabric of our                                Newsweek in 2020. We were
surrounding communities. And, as we build out                                  recognized as one of just         William McMorrow
initiatives to reduce our carbon footprint, we find                            30 real estate companies          Chairman and Chief Executive Officer

2        Kennedy Wilson / ESG Report 2020
2020 Environmental, Social and Governance Report
About
  Kennedy Wilson
                                                                   1

  Kennedy Wilson (NYSE: KW) is a leading global real estate
  investment company. Headquartered in Beverly Hills,
  California with 12 offices across the globe, we have a
  33-year history of investing. We own, operate, and invest
  in real estate through our balance sheet and through
  our investment management platform. We focus on
  multifamily, industrial, and office properties located in
  the Western U.S., UK and Ireland.

   $18B                           210                   30,000
   Assets Under                  Full-Time                   Multifamily
   Management2                  Employees                      Units3

                     12                         22M
              Kennedy Wilson                    Commercial
                  Offices                       Square Feet3

1 Information shown as of December 31, 2020, except where indicated
2 Definition of Assets Under Management – Assets Under Management (AUM) generally refers to the properties and other assets with respect
   to which we provide (or participate in) oversight, investment management services and other advice, and which generally consists of real
   estate properties or loans, and investment in joint ventures. AUM is principally intended to reflect the extent of our presence in the real
   estate market, not the basis for determining our management fees. Our AUM consists of the total estimated fair value of our real estate
   properties and other real estate related assets owned by third parties, wholly owned by us or held by joint ventures and other entities in
   which our sponsored funds or investment vehicles and client accounts have invested. Committed (but unfunded) capital from investors in
   our sponsored funds is not involved in our AUM. The estimated value of development properties is included at estimated completion cost.
3 Includes development and unstabilized assets.
                                                                                                                                                 Kennedy Wilson / ESG Report 2020   3
2020 Environmental, Social and Governance Report
Management and Oversight
ESG Oversight and Governance
We believe that strong governance is the foundation for delivering on our
social and environmental agendas. The Corporate ESG Committee of Kennedy
Wilson is a cross-functional management-level committee formed to support
the company’s ESG responsibilities and commitments to our stakeholder
groups, including investors, employees, our tenants, and communities. The
committee, chaired by President and Board of Directors member Mary Ricks,
sets appropriate global ESG priorities, monitors progress and results against
targets, and supports communications.

Kennedy Wilson recently made two senior appointments in the ESG area. In                     Alex Spilger                       Juliana Weiss Dalton
                                                                                             Head of Global ESG                 Head of ESG and Corporate Affairs,
summer 2021, Alex Spilger, a sustainability leader in the commercial real estate
                                                                                                                                Europe
industry, has joined the company as Head of Global ESG with responsibility for
guiding ESG initiatives across the U.S. as well as coordinating Kennedy Wilson’s
global ESG plan. In 2020, our then Head of Corporate Affairs in Europe - Juliana
Weiss Dalton – took on the role of Head of ESG in Europe, bringing a wealth of
                                                                                     To ensure Kennedy Wilson’s priorities and methods continue to stay relevant, we
ESG experience to the position.
                                                                                     strive for active, continuous dialogue with our stakeholders.
Alex and Juliana will advance Kennedy Wilson’s growing ESG program,
providing overall vision, leadership and strategy to further build out a             Corporate Policies
corporate ESG structure and deepen ESG integration across the investment             Several of the policies we have in place provide the guidelines for Kennedy
process and the company’s asset management activities. They will oversee             Wilson to grow our business while also driving environmental and social value
the development of data management capabilities and tools to track and               creation. These include:
report on progress, metrics, and efficiencies across Kennedy Wilson’s                Code of Ethics
portfolio, while managing sustainability guidelines for the company’s $2.4           Code of Business Conduct and Human Rights Policy
billion of assets currently in development.                                          Code of Vendor Conduct
                                                                                     Environmental Policy
We also continue to use external resources to provide expertise, tools, and
                                                                                     Corporate Governance Guidelines
resources for our ESG program. This includes JLL Upstream, which provides
energy and sustainability consulting, utility advisors that provide technical and
procurement expertise, and utility providers that offer financial resources in the
form of rebates and incentives.

4        Kennedy Wilson / ESG Report 2020
2020 Environmental, Social and Governance Report
Our Approach to ESG
Kennedy Wilson’s ESG program focuses on four pillars:             We optimize resources with a focus on environmental stewardship and
                                                                  optimizing returns, ensuring that energy, water and waste resources are carefully
                                                                  measured, managed, and reduced. Through this program, we also reduce
                                                                  greenhouse gas emissions and future-proof our assets.

                                                                  We create great places for people to live, work and thrive, focusing on
                                                                  purposeful construction that enriches our tenants’ experiences by bridging the
                                                                  gap between home, workplace, and community, and making buildings more
                                                                  productive so they are greener, more resilient, and enhancing people’s wellbeing
        Optimizing                       Creating
                                                                  and productivity.
        Resources                      Great Places
 for a healthy environment and         for people to live,        We build communities that are accessible, healthy, and sustainable within
      a productive business             work and thrive           and around our assets and in the major cities where we operate. We support
                                                                  communities to prosper and grow through building community spaces, creating
                                                                  resident interaction, community engagement, charitable giving, and collaborating
                                                                  with partners.

                                                                  We operate responsibly to ensure business-wide transparency and
                                                                  accountability, with a clear focus on equality, diversity, and inclusion (EDI),
                                                                  empowering people and providing a healthy and safe environment for our
                                                                  employees, customers, and building users.
        Building                        Operating
      Communities                      Responsibly
    for a prosperous society     for a healthy work environment
                                    built on transparency and
                                           accountability

                                                                                                                Kennedy Wilson / ESG Report 2020    5
2020 Environmental, Social and Governance Report
KENNEDY WILSON ESG REPORT 2019

ESG Tools
We are continuing to explore investor-focused standards for disclosing                                      ESG Archive
materially1 important metrics tied to our ESG program, such as those provided                               See below for an archive of Kennedy Wilson’s global ESG reports and tear sheets,
by the Sustainability Accounting Standards Board (SASB) and the Task-Force for                              available for you to download.
Climate-related Financial Disclosure (TCFD). The material topics we identify in
the 2020 report generally align with three of the four material topics suggested                            Reports
by SASB for the real estate industry: energy management, management of                                      • 2019 ESG Report
tenant sustainability impacts, and climate change adaption.                                                 • 2018 Responsibility Report

Our European portfolio environmental data aligns with the European Association                              Tear Sheets

for Investors in Non-Listed Real Estate Vehicles (INREV) Sustainability Guidelines                          • 2019 ESG Tear Sheet

indicator ESG-ENV 1.1 and is presented in line with the European Public Real                                • 2018 ESG Tear Sheet

Estate Association (EPRA) Sustainability Best Practice Recommendations.

1 This Report uses certain terms, including the term “material topics” to reflect the issues of greatest importance to Kennedy Wilson and our stakeholders. Used in this context, these terms should not be
  confused with terms, such as “material” or “materiality,” as defined by or construed in accordance with securities law or as used in the context of financial statements and financial reporting. This Report is
  not comprehensive and should be read together with the financial and other material information regarding Kennedy Wilson found in our filings under the Securities Exchange Act of 1934, as amended, such
  as our Annual Report on Form 10-K.

6          Kennedy Wilson / ESG Report 2020
2020 Environmental, Social and Governance Report
Optimizing
Resources
Our business model focuses on enhancing the value of real
estate through asset management, redevelopment, and
repositioning. We are increasingly integrating environmental
factors into our business, built around our portfolio-wide
goals of enhancing efficiencies in our buildings by ensuring
energy, water, and waste resources are measured, managed,
and reduced in an aim to limit our environmental impact.
Our activities to optimize resources have multiple benefits
including creating an enhanced tenant experience through
improved comfort and the occupation of healthy, low-carbon
buildings, alongside lower service charges as we pass on
financial savings.
2020 Environmental, Social and Governance Report
Reporting and Data Collection
We expanded our carbon reduction and utility measurement program across our business in 2020, enabling
us to measure and understand the impact of our portfolios across geographies. In 2021, we aim to set new
European carbon, water, and waste targets aligned with our business strategy and to embed digital tools to
automate more elements of our program and provide real-time information on our portfolio’s performance.

Progress towards 2020 goals
Carbon Emissions 1 Reduction in Europe Portfolio vs Baseline2 (Target 33%)

                                                                                                                           39%         3

                                                                                                                    Goal Reached

Portfolio in Utility Measurement Program4 (Target 100%)

                                                                                                                         100%
                                                                                                                    Goal Reached
European Electricity from Renewable Sources5 (Target 100%)

                                                                                                                         100%
                                                                                                                    Goal Reached

1 Carbon dioxide equivalent
2 The baseline for targets reflects the carbon emissions of the directly managed assets by Kennedy Wilson Europe Real Estate
  and stabilized by June 30, 2016. The energy consumption data used for the baseline is the first full year of normalized data since
  acquisition and/or stabilization
3 Like-for-like carbon emissions reduction, excluding improvements in carbon intensity of grid electricity
4 Utilities procured by Kennedy Wilson within directly managed global portfolio
5 Electricity procured by Kennedy Wilson within directly managed European portfolio

8          Kennedy Wilson / ESG Report 2020
Optimizing Resources

Measuring our Consumption
The world is moving to a net zero carbon future and we are making our
contribution to achieving this vision by enhancing the operational efficiency
of our directly managed assets, in turn inspiring our tenants who are an
essential part of this journey. Following our commitment in 2018 to measure
consumption across our U.S. portfolio, we are now able to monitor electricity,
gas, and water consumption for 100% of our directly managed global portfolio.
This includes assets where we have operational control and are responsible for
managing utility usage. In Europe it excludes assets leased on a fully repairing
and insuring (FRI) basis, where a single tenant occupies a whole building and
is solely responsible for their own energy procurement, and in the U.S., it
excludes our properties with triple-net leases. We concentrate on the largest
sources of carbon emissions within our directly managed portfolio, where we
have the most ability to influence the outcome and optimize returns.

Reducing Carbon Emissions
We have been monitoring and reducing the carbon emissions of our European
portfolio for five years and are pleased to announce the achievement of our
ambitious target to reduce carbon emissions from our 2016 baseline assets by
33% by 2020. Starting with our largest carbon emitting assets, we put in place
a rigorous program of energy audits and reduction initiatives, which yielded real
results and significant carbon reductions against our baseline.

To ensure our emission results were not positively impacted by disposals,
we are pleased to confirm that on a like-for-like basis we have reached our
target, achieving a reduction of 39%1 at buildings held for the whole period
of our target.

Having reached our goal in Europe, we can adopt new ambitions that are
aligned to our business strategy. We are in the process of embedding our new
program, which is likely to expand the scope of our targets. It will also mean we
will increase engagement with our partners, such as our tenants and suppliers,
to secure the support we need from them to achieve our ambitions.

1 Like-for-like carbon emissions reduction, excluding improvements in carbon intensity of grid electricity

                                                                                                             Kennedy Wilson / ESG Report 2020   9
European Renewable Energy as a Standard                                                                   Energy Efficiency
     Following our previous commitment to move 100% of our directly managed                                    Our journey to improve the delivery of energy efficiencies is demonstrated by
     electricity contracts to tariffs from renewable sources, we reached this goal by                          our commitment to achieving green ratings as well as health and well-being
     the second quarter of 2020. We continue to explore how we can also offer our                              ratings. We are also investigating opportunities for technology to enhance our
     residential tenants high quality, low cost, low carbon electricity supplies, as part                      tenants’ experience and ability to control their consumption, especially at
     of our continued strategy to be the residential landlord of choice. During the                            our multifamily assets, where tenants are often directly in control of energy
     year, we partnered with Pinergy, a 100% renewable electricity supplier in Ireland,                        consumption in their own homes.
     to offer our Irish residents the ability to reduce their own carbon footprint and
                                                                                                               The energy intensity of buildings continues to be an important factor in their
     provide them with access to smart meter technology that allows residents to
                                                                                                               performance and therefore attractiveness to tenants and potential buyers. In
     more easily understand their energy consumption and ultimately reduce it.
                                                                                                               Europe, Energy Performance Certificates (EPCs) provide a clear framework to
                                                                                                               understand the relative performance of different buildings, with increasingly
     European
     European Portfolio – Transition–
                    Portfolio       to Transition
                                       Renewable Energy
                                                     to             Renewable Energy
                                                                                                               stringent minimum standards that must be met for buildings to be leased and
          Renewable
                                                                                                               sold. We therefore continue to ensure we have a complete understanding of
          Non-Renewable
                                                                                                               the EPC ratings of our portfolio, with 100% coverage and most of our assets
     5.3%      19.4%      29%    48.8% 50.5% 84.9% 82.9% 78.2%       91%    99.3% 99.5%   100%   100%   100%
                                                                                                               exceeding current minimum legislative requirements. Our ongoing energy
                                                                                                               management program improves the as-built performance of our assets and
                                                                                                               takes advantage of the opportunity to maximize the EPC rating when they
                                                                                                               are assessed for re-sale or rent. This attention to detail has ensured that the
                                                                                                               average EPC rating for our assets has improved since last year; with assets
                                                                                                               holding an EPC rating of A, B or C increasing by 12 percentage points, from 44%
                                                                                                               of the portfolio, by area, last year to 56% in 2020. We also review acquisition
                                                                                                               and disposal decisions against future potential EPC performance standards to
2%
                                                                                                               reduce the risk of stranded assets and implement plans to improve our low-
                                                                                                                                                                  European EPC Ratings Summary                European P
G                                                                                                              rated EPCs as part of our ongoing asset management           program.
                                                                                                                                                        100% Coverage (EPC Ratings by Area)

     Up to       Q4        Q1     Q2     Q3     Q4     Q1     Q2      Q3     Q4     Q1     Q2     Q3     Q4                                                                                                     Renewable
      Q3        2017      2018   2018   2018   2018   2019   2019    2019   2019   2020   2020   2020   2020                                                                   31%                              Non-Renew
     2017

                                                                                                                                                                                                              5.3%    19.4%
                                                                                                                                         European EPC
                                                                                                                                         Ratings Summary
                                                                                                                                         100% Coverage                               21%
                                                                                                                                         (EPC Ratings by Area)           19%                  19%

                                                                                                                                                                   6%

                                                                                                                                                                                                    2%   2%

                                                                                                                                                                    A     B     C     D       E     F    G

                                                                                                                                                                                                              Up to    Q4
     10                Kennedy Wilson / ESG Report 2020                                                                                                                                                        Q3     2017
                                                                                                                                                                                                              2017
Water Reduction
Conserving fresh water—a finite resource—is
a critical component of building performance.
Water prices are increasing at a rate higher than
inflation and are rising faster than other utilities
because of infrastructure costs and water
scarcity or drought. To mitigate these rising
costs and improve the efficiency of our buildings,
Kennedy Wilson’s water management plans
address the three primary areas for savings:

• Reducing water loss from leaks;
• Reducing overall water use through
  tenant education and improving the water
  efficiency of fixtures and cooling towers,
  HVAC equipment, landscaping, and irrigation
  systems; and
• Reusing on-site water.

Our monitoring of water consumption and waste
performance continued in 2020. Our water
consumption decreased, driven by improved data
accuracy and sub-metering, which has enabled
us to more accurately differentiate between
landlord and tenant water use, particularly in
shopping centers and assets with extensive
landscaping. A targeted water reduction program
at the highest consuming assets remains our
priority over the coming years.

                                                       Kennedy Wilson / ESG Report 2020   11
Renewable

                                                                                                                  31%                                            Non-Renewable

                                                                                                                                                             5.3%     19.4%      29%    48.8% 50.5%

                                                  6%
                                                                                                                           21%
                                                                                                          19%                       19%

Waste Reduction and Recycling                                                   2%   2%
                                                                                European      Portfolio Environmental Data
At Kennedy Wilson, we are committed to finding the best waste management        The table on the following page presents our European portfolio environmental
solutions to encourage our employees, tenants,Aand residents
                                                      B      to
                                                             C reduce,
                                                                    D re-use,
                                                                           E    performance.
                                                                                 F     G     The data aligns with the INREV Sustainability Guidelines indicator
recycle, and separate on-site waste.                                            ESG-ENV 1.1 and is presented
                                                                                                     6%      in line with the EPRA Sustainability Best Practice
                                                                                                          Up to          Q4         Q1     Q2       Q3     Q4         Q1          Q2       Q3
                                                                                Recommendations.           Q3           2017       2018    2018 2% 2018   2018       2019        2019     2019
Improved property management and awareness has helped to significantly                                                                    2%
                                                                                                          2017
reduce the amount of landlord-controlled waste in absolute terms within
                                                                                                     A     B      C            D     E    F     G
our European portfolio. The amount of waste sent to landfill has fallen by 18
percentage points year-over-year, from 29% in 2019 to 11% in 2020, helping to                                                                                Up to      Q4        Q1     Q2     Q3
                                                                                                                                                              Q3       2017      2018   2018   2018
                                                                                                                                                             2017
save costs and maximize the amount of resources that can be re-used.

In the U.S., our asset management teams provide accessible separation bins,
regular tips on waste separation, and composting bins. Kennedy Wilson often
contracts third party waste management companies to optimize recycling
volumes by sorting waste to landfill from recycling.

     Recycling Spotlight:
     Kohanaiki*

                                         162 / 1,434                                                           475
                                   162 Tons / 1,434 Cubic Yards Recycled                      475 Rubbish Dumpsters and $17,820
                                        and Diverted from Landfills                                  Tipping Fees Saved

     *2020 Estimates for Private Residence Club

12          Kennedy Wilson / ESG Report 2020
Optimizing Resources

                 European Portfolio Environmental Data
                                                                                          Absolute (Abs) measures                                                                                                                       Absolute (Abs) measures                                                                                                                          Absolute (Abs) measures
Impact                               EPRA Sustainability                                                                                                               Like-for-like (LfL)                                                                                                                           Like-for-like (LfL)                                                                                                                            Like-for-like (LfL)
                  Unit                                                                (As the portfolio stood each year)                                                                                                            (As the portfolio stood each year)                                                                                                               (As the portfolio stood each year)
 area                        Best Practice Performance Measures
                                                                                           Total Operational Portfolio                                            Total Operational Portfolio                                                       Office                                                                   Office                                                                  Retail                                                                 Retail
                                                                                                                         Portion of                                                             Portion of                                                              Portion of                                                               Portion of                                                              Portion of                                                             Portion of
                                                                                      %                        %                      %                      %                         %                     %                      %                           %                    %                      %                            %                    %                      %                           %                    %                     %                           %                    %
                                                                          2019                   2020                      Data                2019                      2020                     Data                2019                    2020                        Data                2019                     2020                        Data                2019                    2020                        Data                2019                   2020                        Data
                                                                                   Coverage                 Coverage                change                Coverage                  Coverage               change                Coverage                    Coverage              change                Coverage                     Coverage              change                Coverage                    Coverage              change               Coverage                    Coverage              change
                                                                                                                         estimated                                                              estimated                                                               estimated                                                                estimated                                                               estimated                                                              estimated
                             Elec-Abs,             Total Landlord
                                       Electricity                45,078,652        100%      36,296,836     100%          1.1%     -19%     31,591,544    100%      26,551,149       100%        0.3%     -16% 21,945,324        100%      22,460,677        100%        2%        2%      16,561,420    100%      14,454,866         100%        0%       -13%     10,507,235    100%      7,766,012         100%        0%       -26%     7,722,699    100%      6,302,029         100%        0%       -18%
                              Elec-LfL               Obtained
                   kWh
                            Fuels-Abs,             Total Landlord
                                       Natural gas                41,647,779        100%      26,437,896     100%          1.9%     -37% 20,768,377        100%      20,432,846       100%        2.5%      -2%     11,676,314    100%      12,494,061        100%        1%        7%      8,299,908     100%      7,581,964          100%        2%        -9%     5,983,814     100%      6,053,798         100%        6%        1%      4,667,755    100%      5,350,159         100%        7%       15%
                             Fuels-LfL               Obtained
    ENERGY

                                                    For Landlord
                             Elec-Abs,             Obtained from
                    %                  Electricity                        70%       100%         100%        100%          1%       30%        72%         100%         100%          100%        0%       28%        91%         100%        100%            100%        2%        9%        97%         100%        100%             100%        0%        3%         51%        100%       100%             100%        0%       49%        64%        100%       100%             100%        0%       36%
                              Elec-LfL               renewable
                                                       sources
                                           Building
                                                      Total Landlord
                 kWh/ft2 Energy-Int        Energy                          70       100%           60        100%          2.6%     -14%        71         100%           59          100%        1.3%     -16%        18         100%         21             100%        3%       15%         22         100%          20             100%        1%       -11%         5         100%          4             100%        3%       -16%        4.2       100%         4.0            100%        3%       -25%
                                                        Obtained
                                          intensity
                             GHG-Dir-
                              Abs,         Direct        Scope 1         15,851     100%        10,271       100%          1.9%     -35%       7,904       100%         7,730         100%        2.5%      -2%       4,444       100%        4,996           100%        1%       12%        3,159       100%        2,868            100%        2%        -9%       2,277       100%       2,290            100%        6%       0.6%      1,777       100%        2,024           100%        7%       14%
                            GHG-Dir-LfL
 GAS EMISSIONS

                                                      Scope 2 (market
  GREENHOUSE

                 tons CO2e GHG-Indir-      Indirect                       3,827     100%          854        100%          1.1%     -78%       2,470       100%          280          100%        0.3%     -89%        567        100%         574            100%        2%        1%         146        100%           0             100%        0%       -100%      1,423       100%         77             100%        0%       -95%       776        100%         77             100%        0%       -90%
                                                          based)
                             Abs,
                                                          Scope 2
                           GHG-Indir-      Indirect                      12,414     100%         8,956       100%          1.1%     -28%       8,948       100%         6,709         100%        0.3%     -25%       5,508       100%        5,180           100%        2%        -6%       4,157       100%        3,328            100%        0%       -20%       2,806       100%        1,881           100%        0%       -33%       2,120      100%        1,549           100%        0%       -27%
                                                      (location based)
                             LfL
                                           Indirect      Scope 3          956       100%          699        100%          1.1%     -27%        686        100%          522          100%        0.3%     -24%        431        100%         409            100%        2%        -5%        326        100%         263             100%        0%       -19%        224        100%         154            100%        0%       -31%       170        100%        127             100%        0%       -25%
                                           Building
                 CO2e/ft2    GHG-Int      emissions Scope 1 and 2         0.003     100%         0.002       100%          2.6%     -27%       0.003       100%         0.002         100%        1.3%     -14%       0.005       100%        0.006           100%        3%       11%        0.006       100%        0.005            100%        1%       -15%      0.0015       100%       0.0012           100%        3%       -18%      0.001       100%        0.001           100%        3%        -8%
                                          intensity

 WATER                      Water-Abs,                Total Landlord
                    m3                     Water                         263,201     94%        201,228         94%        5%       -24%      220,329       93%        134,155          93%       0.5%     -39%      85,201       100%        85,918          100%        10%       1%       58,292       100%       28,881            100%        1%       -50%      136,869       91%       97,123            91%        1%       -29%     120,906       89%       87,088            89%        0%       -28%
                            Water-LfL                   Obtained
                                                      Total Landlord
                                           Waste                          7,885     100%         4,082       100%          0%       -48%       7,325       100%         4,057         100%        0%       -45%       2,598       100%         653            100%        0%       -75%       2,349       100%         628             100%        0%       -73%       3,445       100%        1,503           100%        0%       -56%       3,133      100%        1,503           100%        0%       -52%
                            Waste-Abs,                  Managed
 WASTE             tons
                            Waste-LfL                 Total Diverted
                                           Waste                          5,596     100%         3,635       100%          0%       -35%       5,136       100%         3,613         100%        0%       -30%       1,324       100%         367            100%        0%       -72%       1,177       100%         345             100%        0%       -71%       3,060       100%        1,371           100%        0%       -55%      2,748       100%        1,371           100%        0%       -50%
                                                       from Landfill

                                                                                          Absolute (Abs) measures                                                                                                                       Absolute (Abs) measures                                                                                                                          Absolute (Abs) measures
Impact                               EPRA Sustainability                                                                                                               Like-for-like (LfL)                                                                                                                           Like-for-like (LfL)                                                                                                                            Like-for-like (LfL)
                  Unit                                                                (As the portfolio stood each year)                                                                                                            (As the portfolio stood each year)                                                                                                               (As the portfolio stood each year)
 area                        Best Practice Performance Measures
                                                                                                  Residential                                                             Residential                                                               Hotel                                                                    Hotel                                                              Mixed Use                                                              Mixed Use
                                                                                                                         Portion of                                                             Portion of                                                              Portion of                                                               Portion of                                                              Portion of                                                             Portion of
                                                                                      %                        %                      %                      %                         %                     %                      %                           %                    %                      %                            %                    %                      %                           %                    %                     %                           %                    %
                                                                          2019                   2020                      Data                2019                      2020                     Data                2019                    2020                        Data                2019                     2020                        Data                2019                    2020                        Data                2019                   2020                        Data
                                                                                   Coverage                 Coverage                change                Coverage                  Coverage               change                Coverage                    Coverage              change                Coverage                     Coverage              change                Coverage                    Coverage              change               Coverage                    Coverage              change
                                                                                                                         estimated                                                              estimated                                                               estimated                                                                estimated                                                               estimated                                                              estimated
                             Elec-Abs,             Total Landlord
                                       Electricity                6,241,377         100%       2,724,837     100%          2%       -56%     3,140,577     100%       2,448,943       100%        2%       -22%     5,837,069     100%      2,754,741         100%        0%       -53%     3,619,202     100%      2,754,741          100%        0%       -24%      547,646      100%      590,569           100%        0%        8%      547,646      100%      590,569           100%        0%        8%
                              Elec-LfL               Obtained
                   kWh
                            Fuels-Abs,             Total Landlord
                                       Natural gas                5,726,640         100%       3,783,534     100%          0%       -34%     2,422,061     100%       3,394,220       100%        0%       40%      18,261,011    100%      4,106,503         100%        0%       -78%     5,378,653     100%      4,106,503          100%        0%       -24%         0         100%          0             100%        0%         0         0         100%          0             100%        0%        0%
                             Fuels-LfL               Obtained
    ENERGY

                                                    For Landlord
                             Elec-Abs,             Obtained from
                    %                  Electricity                        59%       100%         100%        100%          0%       41%        19%         100%         100%          100%        0%       81%        31%         100%        100%            100%        0%       69%        17%         100%        100%             100%        0%       83%        99%         100%       100%             100%        0%        1%        99%        100%       100%             100%        0%        1%
                              Elec-LfL               renewable
                                                       sources
                                           Building
                                                      Total Landlord
                 kWh/ft 2 Energy-Int       Energy                          6        100%           3         100%          1%       -46%        3.1        100%           3.2         100%        1%        5%         38         100%         29             100%        0%       -25%        37         100%          29             100%        0%       -24%         3         100%          4             100%        0%        8%         3         100%          4             100%        0%        8%
                                                        Obtained
                                          intensity
                             GHG-Dir-
                              Abs,         Direct        Scope 1          2,180     100%         1,431       100%          0%       -34%        922        100%         1,284         100%        0%       39%        6,950       100%        1,553           100%        0%       -78%       2,047       100%        1,553            100%        0%       -24%         0         100%          0             100%        0%        0%         0         100%          0             100%        0%        0%
                            GHG-Dir-LfL
 GAS EMISSIONS

                                                      Scope 2 (market
  GREENHOUSE

                 tons CO2e GHG-Indir-      Indirect                       709       100%          203        100%          2%       -71%        709        100%          203          100%        2%       -71%       1,126       100%          0             100%        0%       -100%       837        100%           0             100%        0%       -100%        1         100%          0             100%        0%       -100%       1         100%          0             100%        0%       -100%
                                                          based)
                             Abs,
                                                          Scope 2
                           GHG-Indir-      Indirect                       1,942     100%          862        100%          2%       -56%       1,178       100%          799          100%        2%       -32%       2,023       100%         899            100%        0%       -56%       1,358       100%         899             100%        0%       -34%        135        100%         134            100%        0%        -1%       135        100%        134             100%        0%        -1%
                                                      (location based)
                             LfL
                                           Indirect      Scope 3          144       100%           62        100%          2%       -57%        84         100%           57          100%        2%       -32%        146        100%         64             100%        0%       -56%        96         100%          64             100%        0%       -34%        11         100%         11             100%        0%        0%         11        100%         11             100%        0%        0%
                                           Building
                 CO2e/ft2    GHG-Int      emissions Scope 1 and 2         0.002     100%         0.001       100%          1%       -44%       0.001       100%         0.001         100%        1%        -1%       0.014       100%        0.010           100%        0%       -28%       0.014       100%        0.010            100%        0%       -28%       0.001       100%        0.001           100%        0%        -1%      0.001       100%        0.001           100%        0%        -1%
                                          intensity

 WATER                      Water-Abs,                Total Landlord
                    m3                     Water                           72       100%           0         100%          0%       -100%       72         100%            0          100%        0%       -100%     41,059       100%        18,186          100%        0%       -56%      41,059       100%        18,186           100%        0%       -56%         0         100%          0             100%        0%        0%         0         100%          0             100%        0%        0%
                            Water-LfL                   Obtained
                                                      Total Landlord
                                           Waste                          1,347     100%         1,662       100%          0%       23%        1,347       100%         1,662         100%        0%       23%         460        100%         265            100%        0%       -42%        460        100%         265             100%        0%       -42%        36         100%          0              0%         0%       -100%       36        100%          0              0%         0%       -100%
                            Waste-Abs,                  Managed
 WASTE             tons
                            Waste-LfL                 Total Diverted
                                           Waste                          790       100%         1,662       100%          0%       110%        790        100%         1,662         100%        0%       110%        386        100%         236            100%        0%       -39%        386        100%         236             100%        0%       -39%        36         100%          0              0%         0%       -100%       36        100%          0              0%         0%       -100%
                                                       from Landfill

Methodology
We report on all properties for which we have management control and for which we are responsible for utilities                                                            Heating & Cooling. • Intensity has been calculated using the Net Internal Areas of assets to maintain consistency                                                        reporting. Energy use has been collected through automatic meter reading (AMR) data (where possible), invoices or
consumption. As such, the coverage for all indicators is 100% of the applicable portfolio. • The 2020 absolute                                                             across the portfolio. • Waste consumption has been collected directly from site for 2020 and includes all landlord                                                       a mixture of both AMR and invoice data. Proportion is used where required to fill data gaps. • Intensity indicators
performance measures coverage includes: 21 office assets, 13 retail assets, 12 residential assets (consisting of                                                           managed streams. • Water consumption information is also directly from site and includes all landlord responsible                                                        are calculated using floor area (sq ft) for whole buildings. We are aware of the mismatch between numerator and
multiple units), 1 hotel, and 1 mixed use asset. It excludes indirectly managed assets and our own occupied offices.                                                       consumption for 2020.                                                                                                                                                    denominator, as our consumption for energy relates to a mixture of common areas only and/or whole building
• 2019 Absolute data has been restated due to more accurate data and the exclusion of some supplies which have                                                                                                                                                                                                                                      consumption depending on individual assets. For example, at some residential assets energy consumption consumed
                                                                                                                                                                           Scope 1 and 2 emissions were calculated using the applicable national emissions factors published by the IEA. Scope
been identified as the responsibility of tenants. • Assets in our like-for-like data set were directly managed in both                                                                                                                                                                                                                              in tenant areas is recouped through service charges.
                                                                                                                                                                           1 includes all natural gas consumption. Scope 2 includes all landlord purchased electricity consumption. We have
2019 and 2020 and they include:15 office assets, 12 retail assets, 11 residential assets (consisting of multiple units),
                                                                                                                                                                           used the UK grid average to calculate our marked based emissions while we work with our suppliers to calculate
1 hotel and 1 mixed use asset. • Energy consumption includes electricity and natural gas which we purchase as
                                                                                                                                                                           our actual market based emissions rate. Scope 3 emissions relate to transmission and distribution emissions for
landlords. No fuels were procured in our portfolio (other than natural gas) and no assets are supplied by District
                                                                                                                                                                           electricity. • The majority of estimations relate to filling in specific invoices which were not available at the time of

                                                                                                                                                                                                                                                                                                                                                                                             Kennedy Wilson / ESG Report 2020                                                                      13
C AS E ST U DY
Achieving LEED Platinum at 94 St. Stephen’s Green, Dublin
The story of our Irish headquarters began in the 1840s when it opened as a           A 42% reduction in building energy costs was achieved through the installation
Methodist church. Following a fire in 1968, it was rebuilt in the 1970s as a pre-    of a high-efficiency variable refrigerant flow ventilation system, a dimmable
cast concrete office block, with just the original neo-classical façade remaining.   daylight management system, and a heat pump providing both heating and
We purchased the building in 2017, and as we drew up plans for a complete            hot water. Water-efficient sanitary fixtures were installed throughout, reducing
refurbishment of the vacant property, we were determined to create a vibrant,        overall water consumption by 40% over LEED minimum performance levels.
sustainable, and desirable property with high environmental standards, creating
                                                                                     Following the refurbishment, EV charging points with dynamic load
a model building for our portfolio and the wider Dublin market.
                                                                                     management software were fitted enabling demand to be optimized according
The building’s prime location in the heart of Dublin, on St. Stephen’s Green,        to the building’s wider energy use. Car-pool spaces, on-site bike storage
offers ample access to public transport and green space; providing a strong          facilities, showers, and changing facilities were also installed bringing
starting point on our sustainability journey. To minimize the environmental          additional health and well-being benefits. These factors, alongside high indoor
footprint, 98% of the envelope and structural elements were reused and 96% of        air quality standards, the overprovision of plants, and an abundance of natural
total construction and demolition waste was recycled or diverted from landfill.      light have had a positive impact on employee well-being and productivity. In
New materials were specifically chosen to ensure they were regionally sourced,       addition, and working with a local partner, we commissioned the installation
contained recycled content, and provided sustainable certifications.                 of two bee hives that house approximately 30,000 dark native Irish honey bees
                                                                                     on the roof of the building to boost biodiversity and pollinate the local St
                                                                                     Stephen’s Green and Iveagh Gardens.

14       Kennedy Wilson / ESG Report 2020
The building was awarded LEED Platinum Version 3 in
                                                      September 2020. Platinum is the highest certification
                                                      level under the LEED for New Construction Rating system.

                                                         98%                                                     42%
                                                      Building envelope                                          Reduction
                                                       and structural                                            in building
                                                      elements reused               LEED Platinum               energy costs1
                                                                                     v3 awarded
                                                                                   September 2020

1 Measured against baseline data published by the American Society of Heating, Refrigerating
                                                                                      KennedyandWilson
                                                                                                 Air-Conditioning Engineers
                                                                                                       / ESG Report  2020 (ASHRAE)
                                                                                                                                15
6%                               6%                              6%

                2%       2%                       2%      2%                    2%       2%                       2%     2%

D   A E        B F      C G   D      A E         B F     C G     D    AE       BF       CG      D        E        F       G

                                                                                                               Up toQ3Q3 Q4 Q4Q4                Q2 Q3
                                                                                                                                  Q1 Q1 Q1 Q2 Q2Up       Q4Q4 Q4Q4
                                                                                                                                                   to Q3Q3        Q1Q1 Q1 Q2Q2 Q2 Q3Q3 Q3 Q4Q4 Q4 Q1Q1      Q2Q2    Q3Q3    Q4Q4  Q1     Q2     Q3     Q4
          CUpAtoS E Q4
                    STUD
                       Q1Y                 Q2    UpQ3
                                                   to      Q4
                                                          Q4      Q1Q1     Q2Q2 Up to
                                                                                    Q3Q3 Q4Q4  Q4 Q1 Q1Q1 Q2Q2 Q2
                                                                                                                Q32018
                                                                                                                       Q3
                                                                                                                        20172018
                                                                                                                                 Q4
                                                                                                                                 2018    20182019 2018    2018     2019    2019    2019     2019    2020    2020    2020    2020 2020
            Q3         2017   2018        2018    Q3
                                                  2018    2018
                                                         2017     2019
                                                                 2018       2019 Q32018
                                                                          2018       2019 2017
                                                                                            2018
                                                                                              2019 2018
                                                                                                     2019
                                                                                                      20202018
                                                                                                            2019
                                                                                                              2020   2019
                                                                                                                      2020    2019
                                                                                                                               2020 2019
                                                                                                                                      2020       Q3
                                                                                                                                               2020     2017
                                                                                                                                                     2019
                                                                                                                                                       2020     2018
                                                                                                                                                             2019
                                                                                                                                                               2020      2018
                                                                                                                                                                      2020       2018
                                                                                                                                                                              2020    20202018    2019
                                                                                                                                                                                               2020        2019    2019    2019         2020   2020   2020
                                                                                                               2017                             2017
          A Sustainable Future at Kona Village, A Rosewood Resort
           2017                                  2017                           2017

          Environmental Impact 1
          The annual CO2 reduction from the project is equivalent to any one of the following:

                     541,163                                     472,427                                               5.3M                                     79,523                                             6,281
                     gallons of gasoline                             gallons of diesel                         pounds of coal-powered                         tree seedlings grown                           acres of U.S. forests
                           saved                                          saved                                    energy reduced                                  for 10 years                             preserved in one year

                                                                                                             1C
                                                                                                               alculations are estimates formulated with the Environmental Protection Agency Greenhouse Gas equivalency calculator
                                                                                                              available at: https://www.epa.gov/energy/greenhouse-gas-equivalencies-calculator

          16             Kennedy Wilson / ESG Report 2020
Optimizing Resources

Currently undergoing a major renovation by Kennedy Wilson, Kona Village, a
Rosewood Resort is located on the Kohala Coast of Hawaii, where electrical
power is generated primarily by burning diesel fuel and electricity rates are
among the highest in the United States. Kennedy Wilson’s construction and
engineering teams have pursued an ambitious plan for Kona Village to become
the first self-sustaining resort in the United States with a goal of generating
and storing 100% renewable energy onsite. The photovoltaic technology
will reduce operating costs while contributing to the sustainability and
environmental preservation of the Hawaiian Islands.

Kennedy Wilson has partnered with Good Current on a plan to generate an
estimated 4 MW of solar energy onsite through two ground mounted solar fields
as well as parking canopy and rooftop solar panels. Importantly, the energy will
be stored onsite in state-of-the-art Tesla batteries that can hold approximately
12 MWh of energy, so that the excess generated during the daylight hours can be
used to power the resort through the night and during cloudy periods of the day.
The energy storage system provides an additional community benefit of reducing
stress on the Hawaii Island grid operation, since the energy storage system will
operate to reduce the peak demand of the resort.

        “We are proud to embrace renewable solar technology and to
        do our part in helping the state to reach its Hawaii Clean Energy
        Initiative, which calls for 100% renewable portfolio standards
        by 2045. We see this program as a win-win-win – we are
        reducing costs while reducing our environmental footprint, and
        we anticipate our commitment to sustainability will play an
        important role in attracting today’s discerning travelers to Kona
        Village when we open in 2023,” said Michael Eadie, Managing
        Director of Development and Construction at Kennedy Wilson.

Beyond its ground-breaking photovoltaic system, Kona Village will pursue
LEED Gold certification for several of the resort’s amenity buildings. Other
sustainability initiatives include minimizing the use of potable water onsite, with
all water used to irrigate landscaping generated from onsite brackish wells and
recycled waste water, and stored in a 1.2-million-gallon irrigation lagoon at Kona
Village. The irrigation water is filtered through a solar-powered reverse osmosis
system, or recycled through an onsite wastewater treatment plant.

                                                                                      Kennedy Wilson / ESG Report 2020   17
Creating
Great Places
Recognizing the global movement to great work-life
balance, accessibility and wellness, our purposeful
developments and construction activity focus on
creating great places that benefit the local community,
enhance the lives of our residents, and enable our
commercial tenants to stay relevant to attract and retain
the best talent possible. Our focus on Creating Great
Places goes beyond good design and extends to our
focus on creating offices and homes that promote spaces
for social interaction and exercise, as well as public
spaces to connect with the community. Also, where
relevant, we protect heritage aspects of our buildings to
create a shared sense of cultural well-being.
Creating Great Places

Well-Being at Work                                                                  Building Active Apartment Communities
Within our global commercial portfolio, we focus on engaging our tenants            We build apartment communities across the Western U.S. and Ireland that
with on-site amenities and programming that promotes well-being and                 people love to live in, with space and amenities designed to meet the needs
active lifestyles. We also provide avenues for our tenants to give back to local    of our residents. Our programs focus on promoting health and wellness,
communities through charitable giving and regular events.                           celebrating local culture, and providing lifestyle services to enhance the lives
                                                                                    of residents living in our communities. We also incorporate spaces for rest and
We look to secure certifications, where appropriate, that highlight our
                                                                                    socialization across our portfolio.
commitment to supporting well-being at our properties, including the
                                                                                    • On-site community directors and property managers
international WELL and Fitwel standards that recognize well-being features
                                                                                    • Social events including cooking and fitness classes, holiday parties, and
including materials with low-volatile organic compound emissions, improved
                                                                                      exhibitions
daylight, air and water quality monitoring, and internal mobility. In Europe, we
                                                                                    • Club houses
are targeting WELL and Fitwel certifications across seven assets, including WELL
                                                                                    • Games rooms and cinemas
Community Standard at Clancy Quay in Ireland.
                                                                                    • Fitness centers
At several of our commercial assets in the U.S. and Europe, including our own       • Business suites
offices in London and Dublin, we work with local partners to install and maintain   • Outdoor play areas
bee hives, ensuring the colonies can thrive and produce fresh honey, as part of     • Pools and dog parks
our program to enhance biodiversity levels and support bee habitats that are
under threat globally.

As the COVID-19 pandemic took hold in 2020, we heightened our focus on
supporting our employees and our tenants across our commercial portfolio
through the creation of a COVID-19 task force that monitors compliance to
regulations and requirements around COVID-19, implements policies and
procedures for safe returns to our offices, and provides resources to our tenants
and our properties, including family and well-being resources for physical,
mental, and financial health, among other things.

                                                                                                                                 Kennedy Wilson / ESG Report 2020      19
Sustainable Renovations
                                        As part of our main value-add strategy, Kennedy Wilson invests in and
                                        improves properties through comprehensive renovation programs that aim to
                                        reduce the carbon footprint of our buildings through operations and the use
                                        of sustainable materials. These programs include updating apartments, office
                                        space, amenities, and common areas that both improve the environmental
                                        performance of our buildings and create healthier living and working
                                        environments for our tenants. Kennedy Wilson spends millions of dollars each
                                        year on refurbishments with the following:
                                        • Energy Star appliances
                                        • Window tinting
                                        • Efficient LED lighting
                                        • Programmable thermostats
                                        • Low VOC paint
                                        • Drought tolerant plant materials
                                        • Energy efficient water heaters and boilers
                                        • Low-flow toilets and water efficient fixtures
                                        • Energy efficient HVAC units
                                        • Electric vehicle charging stations
                                        • Sustainable waste management programs

                                        With a focus on value-add investing and renovations across the Western
                                        U.S., Kennedy Wilson’s multifamily team has identified Freddie Mac’s Green
                                        Up financing program as an ideal source of capital for the team’s many
                                        improvement projects. The interest rate reduction program provides discounts
                                        to properties demonstrating successful water and energy efficient improvements
                                        and it is currently being utilized at 14 Kennedy Wilson apartment properties,
                                        totaling nearly $550 million in financing at interest rates 25 basis points below
                                        market rents.

                                        We discuss in more detail our efforts to improve the environmental performance
                                        of our buildings in the Optimizing Resources section.

20   Kennedy Wilson / ESG Report 2020
Creating Great Places

Tenant Engagement
We have begun rolling out initiatives alongside our property management             We also conduct regular training with onsite employees and property managers
partners to encourage our tenants to join us in our efforts to reduce waste,        at many of our properties on topics including waste management, indoor air
save energy, and conserve water at our properties, aiming to reduce our carbon      quality, water use, and energy efficiency, to ensure our onsite staff is well versed
footprint and share the subsequent cost savings that are passed to our tenants.     in sustainability.
These initiatives include education programs and, within our U.S. multifamily
portfolio, we are exploring green lease provisions that improve property
performance and encourage energy and water reduction measures, recycling,
and minimization of indoor air pollution, among other items at select properties.

                                                                                                                                 Kennedy Wilson / ESG Report 2020     21
Certifications and Industry Associations
Demonstrating our commitment to best practices and external verification, we         Across our U.S. portfolio, we use Energy Star’s portfolio manager to centralize
actively secure building certifications where appropriate, as these certifications   oversight of our commercial and multifamily Energy Star ratings, which will help
enhance the marketability of our assets to prospective tenants, providing value      us set goals for Energy Star certifications across our portfolio moving forward.
to our long-term stakeholders.                                                       Currently 100% of our directly managed U.S. office portfolio is being tracked
                                                                                     through Energy Star Portfolio Manager. 75% of our entire multifamily portfolio
Kennedy Wilson is a member of the U.S. Green Building Council and Irish
                                                                                     is being tracked through Energy Star Portfolio Manager, with a goal of reaching
Green Building Council. We are committed to targeting sustainability
                                                                                     100% coverage over the next 12 months. We are also pursuing Green Globe
certifications under LEED (Leadership in Energy and Environmental Design)
                                                                                     certifications at many of our West Coast multifamily properties.
for our major remodel and ground-up commercial development projects
across our global portfolio.

Across our European development portfolio, we target certifications across
LEED and/or BREEAM (Building Research Establishment Environmental
Assessment Method), as well as NZEB (nearly zero-energy buildings) in
Ireland, Fitwel, and WELL certifications at our large-scale projects in the UK
and Ireland. We also target WiredScore ratings, a global digital connectivity
certification program. Five assets have already secured this rating, with three
Gold ratings and one Silver rating.

22       Kennedy Wilson / ESG Report 2020
The Shelbourne Hotel
Dublin, Ireland
                       Heritage Preservation
                       As a real estate investor, operator, and developer,
                       we understand the responsibility and opportunity
                       that comes from working with historically
                       significant buildings in our key locations. We
                       preserve and enhance these assets through
                       sympathetic restoration and regeneration. In
                       2020, we invested $19 million in the restoration of
                       properties with historically significant components
                       across our global portfolio, bringing our total
                       investment in improving our heritage assets to over
                       $36 million globally since 2019.

                                         Kennedy Wilson / ESG Report 2020    23
C AS E ST U DY
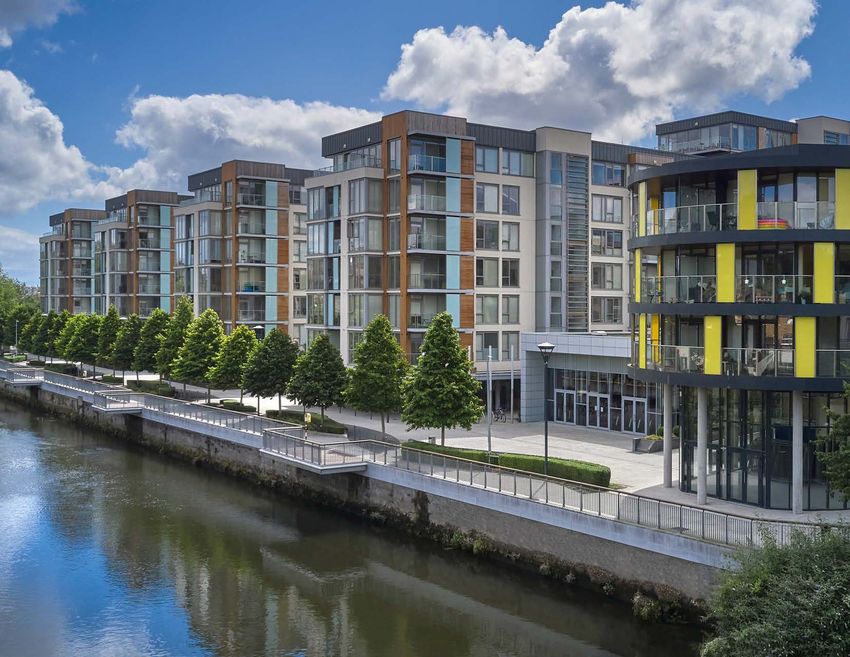
Placemaking at Clancy Quay

     c. 7.3                                                          875
Acres - Outdoor public                                            Units - Largest
realm and community                                              multifamily project
        spaces                    Excellent - New construction       in Ireland
                                         2016 residential

24      Kennedy Wilson / ESG Report 2020
Creating Great Places

Located just a short distance from Dublin city center, with direct access to the      We were one of the first residential developers in Ireland to offer the extensive
River Liffey and within walking distance of the 1,700-acre Phoenix Park, Europe’s     range of services and amenities that we pioneered in our U.S. portfolio, and
largest enclosed park, Clancy Quay dates to the late-1700s when it was originally     Clancy Quay remains the flagship offering amongst our Irish multifamily portfolio.
built as a military barracks. Immediately following our acquisition in 2013, we set   Onsite resident events have played a big role in creating a sense of community
about creating a masterplan that could transform the 13.6-acre site into one of       and these are organized regularly. Delivering technology and a seamless
Ireland’s premier multifamily residential communities.                                digital experience to both prospective and existing residents has been critical,
                                                                                      especially since 2020. More on our amenities, services, and digital initiatives can
Throughout the project, taking Clancy Quay from 423 units at acquisition to
                                                                                      be read in our Building Communities case study.
875 units, once fully complete, we have focused on purposeful placemaking for
the more than 1,800 residents who call Clancy Quay their home. Our aim was
to create a unique sense of place that blends distinctive historical features,
new public outdoor spaces for residents and the wider community, and
contemporary apartments that are well designed and high quality with a strong
emphasis on sustainability.

In recognition of our efforts, the latest phase of the development of 246 units
was awarded the highly coveted BREEAM Excellent certification1. This was the
highest scoring Excellent rating in Ireland to date and recognizes our careful
integration of environmental and wellbeing aspects, including accessibility to
public transport, biodiversity, waste recycling, energy and water efficiency, air
quality, acoustic comfort, materials selection, and construction. The emphasis
on public realm, outdoor community spaces, and the resulting health and
wellbeing has put Clancy Quay in a strong position for the WELL Community
standard, currently underway.

Clancy Quay is regularly presented as an exemplar for conservation and
multifamily communities by key stakeholders, including industry groups and
local authorities alike. It has received widespread recognition including the Royal
Institute of Architects of Ireland (RIAI) award for Housing and was shortlisted
and highly commended for Adaptation and Re-use, coupled with a further
shortlisting from the Irish Construction Excellence Awards in the category
of Heritage Building. The focus on community outdoor space has also been
recognized with the Association of Landscape Contractors of Ireland Awards.

1 BREEAM Excellent - New construction 2016 residential

                                                                                                                                   Kennedy Wilson / ESG Report 2020       25
C AS E ST U DY
Living Green in Boise, Idaho

Kennedy Wilson has completed development of The Clara, a 277-unit garden
style apartment community set on 14 acres in Eagle, Idaho that exemplifies our
focus on creating great places to live that promote healthy lifestyles, embrace
environmental sustainability, and offer a connection to the outdoors.

Alongside Boise-based partner Roundhouse, the project team set out to
include high-quality, sustainable building materials and systems within the
units and throughout the community. Each unit was constructed to meet
the rigorous requirements for energy efficiency set by the U.S. Environmental
Protection Agency, including a complete thermal enclosure system that
includes comprehensive sealing, insulation, and high-performing windows
to deliver improved comfort and lower utility bills; a water management
system; a high-efficiency heating and cooling system and a ventilation system
designed for optimal performance; as well as energy efficient LED lighting and
appliances. As a result, all units were recognized as ENERGY STAR Certified
New Homes in 2020.

The pet-friendly community, which includes two-story townhome residences
and an assortment of one, two-, and three-bedroom apartments, embraces an
outdoor lifestyle through a focus on the natural amenities of the site and the
nearby Boise River Greenbelt. The newly built, 10,000 square-foot clubhouse sits
at the heart of the community, at the edge of a five-acre pond, offering spaces
for social interaction and a variety of amenities to promote active lifestyles,
including a community garden, game room, bike storage, bocce ball court, direct
dock access, paddleboards and kayaks, as well as an outdoor kitchen area with
grilling stations and play areas for family recreation. Residents are also within
reach of Eagle Island State Park’s swimming beach, grassy picnic area and more
than five miles of trails for horseback riding, hiking or dog walking.

26       Kennedy Wilson / ESG Report 2020
“We have taken a careful approach to developing highly sustainable
homes that leverage the area’s unique outdoor amenities, while
promoting family and social interaction throughout the site,” said
Kurt Zech, President of Kennedy Wilson’s Multifamily Group.

                                    Kennedy Wilson / ESG Report 2020   27
Building
     Communities
     We believe the success of the communities surrounding our
     assets is intrinsic to the financial success of our business.
     We aim to build and strengthen local communities and
     engage socially, wherever possible. We do this through
     building community spaces that are engaging, stakeholder-
     oriented and culturally sensitive, as well as through
     charitable giving and collaborating with partners.

28      Kennedy Wilson / ESG Report 2020
Building Communities

Social Impact Investing                                                              McDaniel House
                                                                                     Permanent Supportive
Kennedy Wilson’s Social Impact Investment platform includes our investments          Housing for Seniors
intended to generate a measurable social impact alongside a financial return.        Los Angeles, California

These investments create sustainable solutions to societal issues impacting our
communities, and we have chosen to focus on addressing housing affordability
and homelessness.

Through a partnership launched with Vintage Housing in 2015, Kennedy Wilson
is delivering 10,000 affordable units in the Western U.S. for residents that make
50%-60% of the area’s median income using affordable housing tax credits
and other state and federal financing resources. Vintage Housing provides an
affordable, long-term solution for qualified working families and active senior
citizens, coupled with community services and modern amenities that are a
hallmark of Kennedy Wilson’s traditional multifamily portfolio.

In the past year, Kennedy Wilson expanded its social impact investing initiatives
with two new partnerships. Kennedy Wilson provided seed capital to a new
minority owned business, Langdon Park Capital, that seeks to address the            A new partnership with Daylight Community Development will deliver nearly
chronic undersupply of high-quality real estate in diverse communities across       100 new units of housing over the next two years for individuals experiencing
the U.S. CEO Malcolm Johnson will look to manage a series of private funds with     homelessness. Kennedy Wilson has provided predevelopment capital enabling
a focus on investing in housing and well-operated business facilities in Black      the homeless housing developer to reduce costs and timelines while avoiding
and Latino communities. Beyond providing capital for the company’s launch,          the obstacles presented by securing restrictive public financing for the
Kennedy Wilson aims to invest in Langdon Park Capital’s initial fund vehicles.      development of two projects across Los Angeles.

        “We are deeply committed to making a positive difference                             “Kennedy Wilson’s investment represents a rare example of
        in communities where we operate, and our partnership with                            traditional capital helping to create solutions to the city’s
        Langdon Park Capital is a natural next step as we continue to                        growing homeless housing crisis, and we are thrilled to have
        expand our focus on social impact investment,” said William                          them involved as we scale our business and aim to create
        McMorrow, Chairman and CEO at Kennedy Wilson. “We have                               quality supportive housing projects as efficiently as possible,”
        full confidence in Malcolm’s vision and we are excited to                            said Greg Comanor, Partner at Daylight. “In helping us with
        play a role in this high-impact enterprise. We look forward to                       low cost, flexible pre-development capital, Kennedy Wilson
        enabling him to significantly scale the business in the years                        is enabling us to move forward to build our projects faster
        to come.”                                                                            and cheaper, and to become the best possible custodian of
                                                                                             taxpayer dollars.”

                                                                                                                               Kennedy Wilson / ESG Report 2020     29
You can also read