19 EMEA Market Report - NAI Global
←
→
Page content transcription
If your browser does not render page correctly, please read the page content below

EMEA
                Market Report      19

                                           375+
                                          Offices

                                          6,000+
                                    Local Market
                                        Leaders

                                  All Working in
                       Unison to Provide Clients
naiglobal.com          with Exceptional Solutions
Bulgaria
                                                                                   Market Report                               19
Country Profile                              Country Macroeconomic Profile
Population........ 7,000,039        GDP Growth.................. 3.1%
Capital City....... Sofia           Unemployment Rate....... 6.1%
Currency.......... Bulgarian Lev лв

5 Year Real Estate Investment Volume Your Market
2019                 2018                2017                 2016                 2015
€ 131.80 mln         € 339.30 mln        € 747.94 mln         € 132.78 mln         € 12.33 mln

Major Transactions
 Quarter                   Property                         Seller                         Buyer / Lessee                     Price, mln euro
   Q2      Office                                                                Bravo Property Fund REIT                          30.4
   Q1      hotel                                Sinergon Holding                 Balgarsko Turistichesko Druzhestvo                22.8
                                                                                 Global Turs
   Q1      office                               GEK Terna Holding Real Estate    NBG Pangaea Real Estate Investment                78.6
                                                Construction                     Co

Market Data Trends
Price Industrial Rents 2019                                                     Price Office Yields 2019
   Year     City/Market        Rent(euro/sqm/month)      Yield                    Year      City/Market         Rent(euro/sqm/month)      Yield
   2019            Sofia               4.6               8.5%                     2019          Sofia                  14.5               7.5%
   2018            Sofia               4.5               8.75%                    2018          Sofia                  14.5               7.75%

   2017            Sofia               4.5               9.25%                    2017          Sofia                  15.0               8.0%
   2016            Sofia               4.5               9.75%                    2016          Sofia                  14.0               8.0 %
   2015            Sofia               4.0               10.5%                    2015          Sofia                  14.0               8.25%

                                             Price Retail Rents 2019
                                               Year      City/Market    Rent(euro/sqm/month)            Yield
                                               2019          Sofia                 39                   6.5%
                                               2018          Sofia                 39                   6.5%

                                               2017          Sofia                38.5

                                               2016          Sofia                34.5

                                               2015          Sofia                 31
Bulgaria
                                                                 Market Report                       19
Market Opportunities                                Sector Overview
New shopping center is planned to be opened         Industrial
in Q3 2020 in Plovdiv - Promenada. The investment   The supply of industrial space in Sofia in H1 2019
of 141 million euro is of Nepi Rockcastle.          continued to rise gradually with moderate rates. The total
                                                    industrial stock reached approximately 1,108 thousand sq.
With the completion of Sky Fort, Garitage Park
                                                    m. The vacancy rate in Sofia is low in H1 2019 and remains
– phase 2, Sofia Office Center 2 and other big
                                                    at 3-4%. Prime rents in industrial market in Sofia increased
projects will be added a significant amount of
                                                    slightly to 4.6 euro per sq. m. per month in H1 2019.
office space in the coming years in Sofia. We
                                                    Industrial yields decreased and stood at 8.50 % in H1 2019,
expect profound changes in the demand/supply
                                                    compared to 9.00% in H1 2018.
equilibrium within 3 years.
                                                    Office
FDI in Bulgaria in 2019 were lower compared to
                                                    Total stock in Sofia reached approximately 2.09 mln sqm
2018, but new projects and expansions were
                                                    in H1 2019, with about 103,000 sq m of new delivery. The
announced and it is expected investment activity
                                                    demand for class A office space in H1 2019 continued to
to increase in 2020.
                                                    be mostly driven by IT and BPO companies. Vacancy rate
                                                    in Sofia in H1 2019 is 9% compared with 10% in H1 2018.
                                                    Prime office rents in Sofia in H1 2019 are between EUR 14
                                                    and EUR 15 per sq m per month.

                                                    Retail
                                                    Prime rents in the shopping centers in Sofia remained stable
                                                    in H1 2019, compared to 2018 and stood at 39 euro per
                                                    sq m. Anchor tenants command €4-8 per sq m per month.
                                                    Big supermarket chains command on average €4-8 per sq
                                                    m per month, depending on the brand and size of premises.

NAI FrontPoint Partners
5 Lege Str, fl. 2                                                            Andrey Filev
Sofia 1000                                                                   andrey.filev@naifpp.com
Bulgaria                                                                     Ivan Filev
+359 893 336 006                                                             ivan.filev@naifpp.com
Market Report
                                                                                           Croatia
                                                                                                                     19
Country Profile                         Country Macroeconomic Profile
Population........ 4.089.000            GDP ............................. 51.608.000.000 €
Capital City....... Zagreb              GDP growth .................. 2,9 %
Currency.......... Kuna (HRK)           Unemployment Rate....... 6,9 %
                                        Inflation.......................... 0,9 %

5 Year Real Estate Investment Volume Your Market
2019              2018                 2017               2016               2015
N/A               N/A                  N/A                N/A                N/A

Market Overview
Office market is the most mature property segment of the            the similar level. The retail market in Zagreb is considered
Zagreb commercial real estate sector and is already well            to be saturated, and the slowdown in development activity
developed thanks to a high level of investments over the            was noted. Industrial and logistics sector remained one of
past years. Even though the completion of several office            the least developed in Croatia. Apartment prices and num-
schemes in H1 2019 caused the stock increase, the strong            ber of transactions increased in 2019; the most in Zagreb
absorption of new space has retained the vacancy rates at           and coastal cities.

Major Transactions
 Quarter               Property                         Seller                        Buyer / Lessee                Price, mln euro
   Q2      Free market sales                    N/A                        N/A                                           21.9
   Q4      Free market sales                    N/A                        N/A                                           21.5

   Q2      Free market sales                    N/A                        N/A                                           16.2

Market Data Trends
Price Office Rents 2019                                                 Price Retail Yields 2019
   Year     City/Market    Rent(euro/sqm/month)       Yield                 Year      City/Market     Rent(euro/sqm/month)      Yield
   2019       Zagreb              8,0 – 10,0          7,5%                  2019        Zagreb               20,0               7,0%
   2018       Zagreb              8,0 – 10,0          7,5%                  2018        Zagreb               19,0               8,0%

   2017       Zagreb              8,0 – 10,0          8,0%                  2017        Zagreb               19,0               7,0%
   2016       Zagreb              8,0 – 10,0          8,5%                  2016        Zagreb               21,0               7,0%
   2015       Zagreb              8,0 – 10,0          8,5%                  2015        Zagreb               20,0               8,5%

                                         Price Industrial Rents 2019
                                               Year   City/Market   Rent(euro/sqm/month)      Yield
                                               2019     Zagreb              5,5               8,0%
                                               2018     Zagreb              5,5               7,5%

                                               2017     Zagreb            4,5 - 5,5          9,25%

                                               2016     Zagreb            4,0 – 5,0           10%

                                               2015     Zagreb            4,0 – 5,5           11%
Market Report
                                                                            Croatia
                                                                                                     19
Market Opportunities                               Sector Overview
We expect that industrial, office     Industrial
and retail sector will continue       Industrial sector is the least developed real estate sector in Croatia
                                      which will probably remain because all mayor investments are focused in
stabile growth in 2020. and that      tourist industry sector. Industrial production index in year on year is 2.1%.
will exceed 2019. in volume.          In 2019. we saw some notable building completions in industrial sector.
Beside new office projects in         The biggest investment was Croatian Post new logistic and warehouse
                                      center in Velika Gorica in vicinity of Zagreb International Airport.
Zagreb some office projects
                                      Investment is valuated at app EUR 50 million.
could be expected in 2020. in
                                      Average rents remained stable in 2019 and will continue to remain same
some other Croatian cities mainly
                                      in 2020 with prime monthly rents in range 5.0-5.5 EUR/m2 with prime
because of strong growth of IT        yields for distribution warehouses of 8.5-8.75% In 2020. it is expected
sector. Although retail market        that UK based investment company Poseidon Group will finish their
is in expansion it will not reach     logistic center with 30.000 m2 of GLA in Business Park Dalmatia. Also
                                      Gebrudee Weiss will finish their EUR 18 million in a new logistic center
peak saturation in 2020.              near Sveta Nedelja (logistic park).
But mayor investments could           Office
be    expected    in   hotel   and    In 2019. we saw some extensive developments in hotel (Hotel Park
                                      Rovinj) and office buildings (Croatian Telecom iz Zagreb). Hotel
turistic sector (with new hotels      developments are mainly situated along Croatia coast (Rovinj, Split and
and camps openings in 2020.).         Dubrovnik) and are developed for Croatian hotels companies. In Zagreb
Also investment in infrastructure     investments in office buildings will continue also in 2020. On Slavonska
                                      avenija Matriy Office Park phase (building) 2 is near completition which
(bridges, highways, railroads) will
                                      will bring app 11.000 m2 of new GLA of offices to market. Info bip
continue.                             campus, BHB domus and Euro daus with app 50.000 m2 of new office
                                      space will be finished in 2020.

                                      Retail
                                      In the first half of 2019 Arena Retail Park was finished. Supernova Group
                                      finished purchase of shopping centers from Zagrebačka and former
                                      Hypo bank with expansion, refurbishment and upgrade of acquired and
                                      existing shopping centers in Croatia (Branimir center, Kaptol center). In
                                      pipeline are Z Shopping Center in west part of Zagreb with app 50.000
                                      sqm of GLA. Total stock in Zagreb shopping centers will reach 450.000
                                      sqm. Activity will remain intense with 40.000 sqm of shopping centers
                                      under construction and upgrade. Average rents for prime shopping
                                      centers will be in range of 18-22 EUR/m2. Prime yields for shopping
                                      centers will remain in amount of 7.0% and 8.0% for retail parks..

NAI Significa
Vošnjakova ulica 1
Ljubljana 1000
Slovenia
+386 1 434 33 10
Czech Republic
                                                                                        Market Report                            19
Country Profile                                Country Macroeconomic Profile
Population........ 10.6 million                GDP.............................. 49.8 bln. $ (Q3 2019)
Capital City....... Prague                     GDP Growth.................. 2.5 % (Q3 2019)
Currency.......... Czech koruna                Unemployment Rate....... 2.2 %
                    (CZK)                      Inflation.......................... 2.8 %

5 Year Real Estate Investment Volume Your Market
2019                  2018                     2017                   2016              2015
EUR 3.0 bln           EUR 2.5 bln              EUR 3.8 bln            EUR 3.6 bln       EUR 2.6 bln

Market Overview
2019 was another strong year in the Czech Republic with                       ed that will continue to support the capital values. There
total investment volume likely to exceed EUR 3.0 bln. As                      is a long-term strong demand from domestic investors,
Prague and Czechia in general is seen as a solid and stable                   however some of the largest transactions of the year were done
market, the prices are high and the yields low, with solid                    by South Korean investors, so the question is whether this
chance for further pressure. Slight rental growth is expect-                  activity will stay in the following year.

Major Transactions
  Quarter                  Property                                 Seller                      Buyer / Lessee                   Price, mln. $
    Q1        Intercontinental - Hospitality        Best Hotel Properties             R2G Heritage                                    250
    Q1        Waltrovka - Office                    Penta                             GLL (Hanwha)                                    275

    Q2        Rustonka -Office                      J&T                               Mint (Hana)                                     185

    Q2        Main Point Pankrac - Office           PSJ                               Mint (Hana)                                     125

    Q4        Amazon Dobroviz - Industrial          LOGISTIS                          Samsung Securities                           165 (est.)

Market Data Trends                                                           Sector Overview
  Year      City/Market                Rent                 Yield
                                                                             Industrial
  2019          Prague           € 21.00 - 24.50          4.50 %             Total take-up is in line with 5-year averages with rent level rather
  2018          Prague           € 20.00 - 23.50          4.75 %             unchanged and vacancy still low. Manufacturing companies drive
                                                                             demand for industrial space, taking more than half of total transaction
  2017          Prague           € 20.00 - 22.00          4.85 %             volume. Over 500 k sqm is under construction with almost half of
  2016          Prague           € 19.50 - 22.00          5.50 %
                                                                             that being built on speculative basis. Total stock surpassed 8 million
                                                                             sqm.
  2015          Prague           € 19.00 - 20.50          6.00 %
                                                                             Office
                                                                             Strong demand is still able to keep the vacancy levels
                                                                             low despite quite active development pipeline, however
                                                                             speculative construction is starting to diminish with investors
                                                                             waiting for enough pre-lease volume. Rent levels are stable
                                                                             with slight upward pressure.
NAI Prochazka & Partners
Wenceslas Square 841/3
Prague 1 - New Town 110 00
Czech Republic
                                                                                                      Radek Prochazka
420 (22) 224-2342                                                                                     radek.prochazka@prochazkapartners.cz
www.naiprochazkapartners.com                                                                          +420 222 242 342
Market Report
                                                                                                Georgia
                                                                                                                          19
Country Profile                           Country Macroeconomic Profile
Population........ 3.725 million          GDP.............................. 17.7 billion USD
Capital City....... Tbilisi                                                   or 4,722 USD per capita
Currency.......... Lari, GEL, ₾           GDP Growth.................. 4.8%
                                          Unemployment Rate....... 12.7%
                                          Inflation.......................... 7,0%

5 Year Real Estate Investment Volume Your Market
2019                 2018                2017                 2016                 2015
500 million USD      460 million USD     465 million USD      380 million USD      430 million USD

Market Overview
In 2018 real estate activities was the third largest sector of          Retail: In Tbilisi the few modern shopping centres benefit
the Georgian economy with 11.4% of GDP; construction                    from growth in disposable income, consumer preference for
8.3 % and tourism 7.6%.                                                 shopping centres and tourism.
Residential: Apartment sales remain strong. Tbilisi and Ba-             Hotels: Currently, international up- and mid-scale hotels
tumi rent markets are supported by tourism driven Airbnb                enjoy high occupancy rates and prices. The extensive
markets.                                                                pipeline is this segment might create a risk for oversupply.
                                                                        Lack of acceptable budget accommodation drove the rapid
Office: In Tbilisi, the country’s capital and business hub              expansion of the Airbnb market.
office rents remain high and lacks modern leasable offices.

Major Transactions
 Quarter                  Property                          Seller                          Buyer / Lessee                Price, mln. $
    Q1     Acquisition 40% shares in a         KASS 1 LLC                       JSC M2                                    5.3 million USD
           development of a hotel
    Q2     Purchase of ongoing unfinished      Government of Georgia            MC Construction                           8.7 million USD
           development of a hotel &
           apartments

Market Data Trends
   Year     City/Market        Rent per annum           Yield                  Year       City/Market        Rent per annum        Yield
   2019     Tbilisi / Office         300 USD            12.0%                  2019       Tbilisi / Retail      335 USD           13.5%
   2018     Tbilisi / Office         275 USD            11.0%                  2018       Tbilisi / Retail      300 USD           12.0%

   2017     Tbilisi / Office         265 USD            10.5%                  2017       Tbilisi / Retail      285 USD           11.5%
   2016     Tbilisi / Office         250 USD            10.1%                  2016       Tbilisi / Retail      285 USD           11.5%
   2015     Tbilisi / Office         240 USD             9.5%                  2015       Tbilisi / Retail      265 USD           10.5%
Georgia
                                                                 Market Report                          19
Market Opportunities                                 Sector Overview
Good and interesting investment or rather de-        Industrial
velopment opportunities in all segments exist        Warehouse space in Tbilisi is mainly owner-occupied. Main
but especially for hotels and residential second     exceptions are Gebrüder Weiss warehouse near Tbilisi airport
                                                     established in 2013 with 10,000 m² and Hualing Groups trading
homes throughout Georgia.
                                                     center established in 2016 with 150,000 m2 located in the eastern
Georgia’s tourism industry has for the last years    suburbs being the largest wholesale and retail trading center of
been growing continuously. Georgia’s tourism         Georgia.
strategy 2025 seeks to further increase the reve-    With the overall development in the country demand is
nues received from international tourism to $5.5     increasing main drivers are food, beverage and hypermarkets;
billion per year.                                    auto parts; building materials; consumer and pharmaceutical
                                                     goods
The government is supporting tourism, it has
                                                     Office
invested heavily and continues to do so in de-
                                                     Tbilisi office market is specific, it lacks a central business
veloping Georgia’s ski regions, has now started      district, Georgian firms prefer to own their offices and
focusing on the countries potential for spa tour-    modern leasable office space is limited and additions have
ism and has initiated a program offering financial   been absorbed.
support for hotel developments in select areas.      Lack of modern office space results in high rents and yields.
                                                     Four new business centers Axis Towers, City Tower, CH
                                                     64 and Vale Plaza will add around 50,000 m2 over the next
                                                     years.

                                                     Retail
                                                     Tbilisi dominates the Georgian retail market with a share of
                                                     80%. Supply of modern shopping centers still remains far
                                                     behind CEE.
                                                     Notable international type malls in Tbilisi are Tbilisi Mall
                                                     70,000 m², East Point 65,000 m², Galleria Tbilisi 25,000 m²
                                                     and City Mall with 50,000 m2.
                                                     In 2021 Tbilisi See Freeport outlet is scheduled to open with
                                                     8,000 m2
                                                     Growth in disposable income allowing consumers to spend
                                                     not just on subsistence items drives development.

                                                                                Thomas Foehrer
NAI REA Caucasus                                                                Managing Partner
5 Marjanishvili Street                                                          thomas.foehrer@rea-caucasus.com
Office #408                                                                     +995 5 91 706707
Tbilisi 0102                                                                    Levan Vachnadze
Georgia                                                                         Managing Partner
995 (32) 218-0901                                                               levan.vachnadze@rea-caucasus.com
                                                                                +995 5 99 579500
www.rea-caucasus.com
Germany
                                                                                   Market Report                           19
Country Profile                          Country Macroeconomic Profile
Population........ 83,2 million          GDP.............................. 3,436 bn €
Capital City....... Berlin               GDP Growth.................. 0.6%
Currency.......... Euro €                Unemployment Rate....... 4.9 %
                                         Inflation.......................... 1.4 %

5 Year Real Estate Investment Volume Your Market
2019                2018                2017                   2016                2015
66.7 bn €           60.8 bn €           57.3 bn €              52.7 bn €           55.0 bn €

Market Overview
The German economy has experienced a boom phase in recent              gross domestic product was 0.6 % higher in 2019 than in the
years, while the population has reached an all-time high, the          previous year. This represents the tenth growth of the German
employment is rising and unemployment figures are falling (including   economy in a row. For 2020 the forecasts range from +0.6 % to
the lowest unemployment rate since reunion). In December 2019          +1.4 %. The situation is currently challenging for industrial companies
with around 4.9 % Germany has one of the lowest unemployment           (especially the automotive industry), while the positive situation in
rates in the EU. In 2019, however, a weaker phase was recognized,      the service sector will continue.
but there are still no signs for a recession. The price-adjusted

Market Office Data Trends
   Year      City/Market    Rent(euro/sqm/month)        Yield                 Year        City/Market   Rent(euro/sqm/month)        Yield
   2019          Berlin             39.50              2.65%                  2019         Hamburg              30.00               2.85%
   2018          Berlin             35.50              2.80%                  2018         Hamburg              27.30               3.00%

   2017          Berlin             31.00              2.90%                  2017         Hamburg              26.50               3.05%
   2016          Berlin             28.20              3.50%                  2016         Hamburg              26.00               3.40%
   2015          Berlin             24.50              4.10%                  2015         Hamburg              24.80               4.10%

   Year      City/Market    Rent(euro/sqm/month)        Yield                 Year        City/Market   Rent(euro/sqm/month)        Yield
   2019         Munich              39.50              2.70%                  2019         Frankfurt            45.50               2.85%
   2018         Munich              38.00               2.85                  2018         Frankfurt            43.20               3.05%

   2017         Munich              36.50              3.05%                  2017         Frankfurt            40.30               3.20%
   2016         Munich              35.50              3.35%                  2016         Frankfurt            39.00               3.75%
   2015         Munich              34.00              3.75%                  2015         Frankfurt            39.20               4.25%

                                        Year       City/Market     Rent(euro/sqm/month)        Yield
                                        2019        Dusseldorf             28.50               3.10%
                                        2018        Dusseldorf             27.50               3.20

                                        2017        Dusseldorf             27.00               3.60%
                                        2016        Dusseldorf             26.50               3.95%
                                        2015        Dusseldorf             26.00               4.35%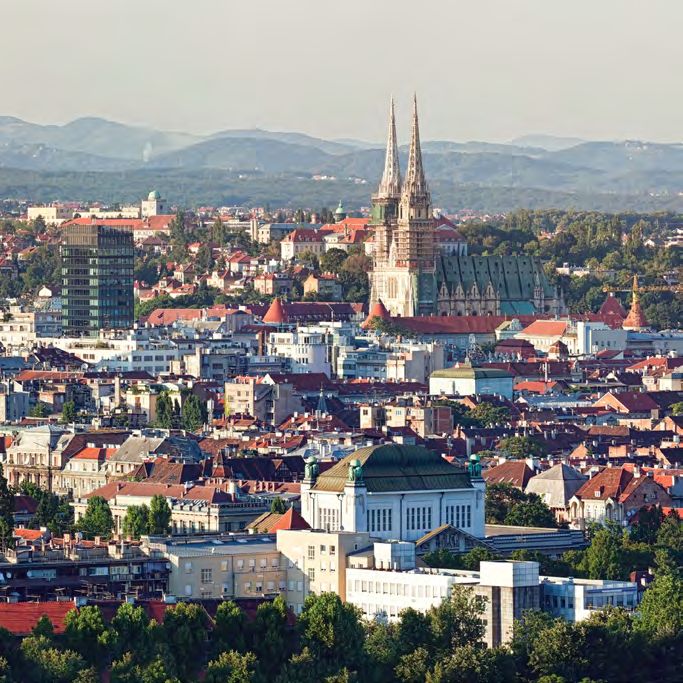
Germany
                                                                                Market Report                           19
 Major Transactions
  Quarter           Property Type                           Seller                          Buyer/Lessee                 Price, mln. $
     Q4      German part Dream            Dream Global                              Blackstone                          Approx. 3.0 bn €
             Global Portfolio
     Q3      Millennium Portfolio         Generali                                  Commerz Real                        Aprrox. 2.6 bn €
     Q2      Kaufhof-Portfolio            Hudson’s Bay Company                      Signa                               Aprrox. 1.25 bn €
             (50 % share)
     Q4      Tucherpark, Munich           Hypovereinsbank                           Commerz Real / Hines                Aprrox. 1.1 bn €
     Q4      The Squaire, Frankfurt       Blackstone                                AGC Equity Partners                 Aprrox. 0.94 bn €

 Market Opportunities                                Sector Overview
Although economic growth has recently                Industrial
been somewhat less pronounced,                       In 2018 the German logistics industry with 278 bn € generated the highest
economic growth is expected to pick up               revenues within the European Union (279 bn € expected for 2019). German
                                                     revenues were ahead of Great Britain (134 bn €) and France (136 bn €).
in 2020. Here, domestic consumption
                                                     Germany ranks first in the World Bank’s “Logistics Performance Index” for the
will remain the pillar.                              third time in a row. In the first three quarters of 2019 the space take-up in Germany
                                                     was about 5.095 m sqm,which is almost at the previous year’s level. From this
The rental markets, especially the                   take-up around 1.3 m sqm was registered in the top 5 markets. The
office markets, will continue to be                  prime rents are characterized by a stable to slightly positive development.
characterized by a lack of space that                Furthermore Industrial / logistics are highly demanded by property investor.
cannot meet the demand side. At the                  Accordingly, prime yields for these assets are sinking.
same time, no relief is to be expected on the
                                                     Office
developer side. Accordingly, rents in most           Despite a moderate economic forecast, the German office letting markets
markets will continue to rise.                       are in a very good shape. In the top 5 markets, a take-up of around 3.4
                                                     million sqm has been recorded in 2019, which even tops the very good result
Current conditions on the finance                    of the previous year by around 0.2 %. The office market will be influenced by
market, including the ongoing zero                   insufficient completions as well as by strong letting demand. Therefore, rental
interest rate policy of the ECB and                  prices will also rise in most of the markets in 2020. As a consequence, office
record employment levels, ensure that                properties will remain the most demanded assets for property investors.
German commercial property remains                   Retail
in strong demand. Owing to the supply                Due to a record number of employees the purchasing power in
shortage, prime yields will fall further in          Germany has increased by 2.9 % to 23,766 € per capita. Furthermore, the
some asset classes. For 2020 for the                 German consumers are in a buying mood and a support of the economic
commercial investment market an above                development. However, the online retail market can be declared as the
                                                     main profiteur of this development. Also, the food sector is characterized by
average high transaction volume can be
                                                     growing revenues. Investors in retail properties check carefully the economic
expected.                                            viability of the concepts of the assets. Most preferred are investments in
                                                     retail parks, followed by high-street properties and shopping centers.

NAI apollo
Schillerstrasse 20
Frankfurt am Main, Hessen 60313
Germany
                                                                                                      Andreas Krone
4 (969) 970-5050
                                                                                                      andreas.krone@nai-apollo.de
www.nai-apollo.de                                                                                     +49 69 970 505 104
Market Report
Greece
19
Country Profile Country Macroeconomic Profile
Population........ 10,500,000 GDP.............................. 200.3 billion USD
Capital City....... Athens GDP Growth.................. 0.6%
Currency.......... € Euro Unemployment Rate....... 16.7%
Inflation.......................... 0.5%
5 Year Real Estate Investment Volume Your Market
2019 2018 2017 2016 2015
5.2 billion 5 billion 3.4 billion 3 billion 2.7 billion
Market Overview
The Greek economy is undergoing a period marked by im- and the expected shift to a more pro-growth policy mix, com-
proving investor sentiment and expectations momentum bined with the uptick in market sentiment towards the Greek
amid a less favorable international economic environment economy, as reflected in the marked decline of GGB spreads
that has been damped by uncertainty around Brexit, rising and the full lift of capital controls, raises the prospects for
trade tensions and the slowdown in growth in the euro area an acceleration of domestic economic activity in the coming
that is primarily attributable to the decline in manufacturing in quarters through the establishment of a business-friendly en-
Germany. The remarkable improvement in business and con- vironment and an expected rebound in investment.
sumer confidence, off the back of renewed political stability
Major Transactions
Quarter Property Seller Buyer/Lessee Company Name Price, mln. $
Q4 Investmentl Prodea DROMEUS 93.000.000
Q3 Investment Bain Capital DROMEUS 26.600.000
Q3 Investment NBG TRASTOR 25.000.000
Q1 Investment HELENS GRIVALIA 117.0000000
Market Data Trends
Year City/Market Rent CHF/SQM/p.a. Yield
2019 Athens 19 6.8%
2018 Athens 12 8%
2017 Athens 12 9%
2016 Athens 10 10%
2015 Athens 10 10%Market Report
Greece
19
Market Opportunities Sector Overview
Construction activity has rapidly increased, es- Industrial
pecially in the residential sector. Investors are Greece stands at the crossroads of three continents offering
high potential to logistics development . Average yields
now targeting value add opportunities, ie older for quality properties in the major logistics areas of Greater
stock in need of renovation and turnarounds, as Athens and Thessaloniki, are at least as high as 10%.
there is lack of adequate institutional product. Occupancy rates for Grade A logistics properties are as
high as 95%. Management concessions of Piraeus port to
Residential development, offices and logistics
COSCO, Thessaloniki port to the Deutsche Invest- Terminal
are seen to attract greater demand by occupiers Link-Belterrra consortium, and TRAINOSE to Ferrovie Delo
and hence have been preferred by develpers Stato, create new business opportunities. Development
of new Logistics Centers in Thessaloniki (Str. Gonou) and
and investors.
Athens (Thriasio), as well 3/4 Party Logistics Parks throughout
Greece. . Small to medium size warehouses (i.e. 500-2,500
sqm) are increasingly sought after and considered more
attractive.
Office
The office market in Athens is benefitting from improvements
in the Greek economy and attracting more interest from
local and foreign tenants. There is now little supply of high
quality buildings in the prime office areas and this has led to a
shortage of Grade A and B offices. As a consequence, prime
rental values have been increasing over the last 3 years in
the most sought-after areas. On the other hand, the stock of
Grade C and D office remains high while the demand for such
premises is almost nonexistent. Athens is no exception to the
co-working and flexible workspace boom in Europe as more
than 20 buildings were converted into co-working spaces.
Retail
High street shops and commercial centers that stood strong
during the previous years, have now started to recover.
Athens center exhibits signs of recovery, boosted by
increased tourist arrivals, after a considerable period of
negative growth in prices. High quality retail space of
various sizes, including shopping centers have been in the
spotlight due to increased demand from fashion and
food and beverage retailers. Gradual improvement in the
Thessaloniki high street market with increased take up
leading to lower vacancy rates and higher rental prices
NAI RealAct
Ethnikis Antistaseos
& 1-3 Mantzarou Street Ioannis Lizas MRICS
15451 Neo Psychiko ioannis.lizas@nairealact.com
Athens, Greece Anna Nazou MRICS
+30 2130 299090 anna.nazou@nairealact.comMarket Report
Ireland
19
Country Profile Country Macroeconomic Profile
Population........ 4,921,500 GDP ............................. $382,754M
Capital City....... Dublin GDP growth .................. 5.6%
Currency.......... Euro € Unemployment Rate....... 4.8%
Inflation.......................... 0.8%
5 Year Real Estate Investment Volume Your Market
2019 2018 2017 2016 2015
€ 7.3 billion € 3.6 billion € 2.3 billion € 4.5 billion € 3.7 billion
Major Transactions
Quarter Property Seller Buyer / Lessee Price, mln. $
Q2 Multi-Family Cosgrave Group DWS 108 mil EUR
Q3 Multi-Family Cairn plc Urbeo 94 mil EUR
Q4 Multi-Family Cairn plc Urbeo 53.5 mil EUR
Q4 Multi-Family Cairn plc Carysfort Capital 63.1 mil EUR
Q4 Multi-Family Confidential Confidential 127 mil EUR
Market Data Trends Sector Overview
Price Office Rents 2019 Industrial
Year City/Market Rent(euro/sqm/month) Yield Take-up in 2019 reached an impressive 332,362 sq.m - up
2019 Dublin 675 4% approximately 9% on the previous year & 21% higher than
the 10-year average.
2018 Dublin 670 4%
Office
2017 Dublin 640 4% Demand for office accommodation remains elevated and we
2016 Dublin 600 4.25% are expecting another strong year in 2020 including some
2015 Dublin 560 4.25% carryover of transactions from last year.
Retail
We saw strong activity from the food & beverage, beauty
Price Retail High Street Yields 2019 services and leisure sectors last year - a trend which we
Year City/Market Rent(euro/sqm/month) Yield expect to see replicated in 2020.
2019 Dublin 6,250 3.5%
2018 Dublin 6,040 3.5%
Market Opportunities
2017 Dublin 6,000 3.5%
2016 Dublin 5,600 3.5% There continues to be strong office and industrial occupier demand.
2015 Dublin 5,250 3.5% The challenges around dealing with undersupply of housing over
a long number of years are providing continuing opportunities for
Price Industrial Rents 2019 developers and investors in multi-family product and we expect
to see a significant number of related transactions over the course
Year City/Market Rent(euro/sqm/month) Yield
of 2020.
2019 Dublin 95 5%
2018 Dublin 89 5% NAI NAI Hooke & MacDonald 118 Donald MacDonald
Lower Baggot Street Director
2017 Dublin 89 5.5%
Dublin 2, D01 AW89 donaldm@naihmd.ie
2016 Dublin 80 5.75% Ireland Conor Steen
+353 1 6318403 Associate Director
2015 Dublin 76 6%
hookemacdonald.ie conors@naihmd.ieMarket Report
Italy
19
Country Profile Country Macroeconomic Profile
Population........ 60,483,000 GDP.............................. 1,935 billions USD
Capital City....... Rome GDP Growth.................. 0.6%
Currency.......... Euro € Unemployment Rate....... 10.8%
Inflation.......................... 0.6%
5 Year Real Estate Investment Volume Your Market
2019 2018 2017 2016 2015
6,5 billions € 4,9 billions € 8,6 billions € 7,1 billions € 6,5 billions €
Major Transactions
Type Property Seller Buyer / Lessee Price, mln. $
Sale Galleria Passerella – Milan Goldaman Sachs DeA Capital SGR 280 million €
Sale Palazzo Informazione -Milan DeA Capital Rovati Family 175 million €
Sale Pirellino – Milan Municipality Coima 194 million €
Sale Via Pola 9 -Milan Barings M&G Real Estate 136 million €
Sale Sky complex – Milan Risanamento REAM SGR 262 million €
Sale Viale Abruzzi/Sardegna – Rome IMMSI Investire SGR 62,5 millio €
Market Data Trends Sector Overview
Year City/Market Rent Yield
Industrial
2019 Milan/Office 600 €/sq.m. per year 3.00% net Positive trend for logistic market. Take-up mainly characterized
2018 Milan/Office 550 €/sq.m. per year 3.50% net by 3PL operators (approx. 45%). Prime rents stable in all key
2017 Milan/Office 520 €/sq.m. per year 3.50%/4.00% markets of Milan, Rome, Bologna and Veneto Region.
net
Office
2016 Milan/Office 450-500 €/sq.m. per 4.50% net
year Positive trend for office market, especially in Milan area (leasing
2015 Milan/Office 400-450 €/sq.m. per 5.50% net
and investment accounting for 89% of the total volume) and
year Rome. A slight compression within the submarket both in
Rome and Milan.
Retail
Positive trend despite the growth of e-commerce. Retail
investment recorded a slow down during the previous year.
High street registered 30% of the total investment volume.
NAI Target Real Estate
Via Visconti Venosta 3
Milano 20122 Raffaella Cassese
Italy Raffaella.cassese@target.re.it
02 8739 8860 Alessandro Palma
target.re.it alessandro.palma@target.re.itNetherlands
Market Report 19
Country Profile Country Macroeconomic Profile
Population........ 17.4 M GDP.............................. 1.8%
Capital City....... Amsterdam GDP Growth.................. -0,8%
Currency.......... Euro € Unemployment Rate....... 2.1%
Inflation.......................... 2,6%
5 Year Real Estate Investment Volume Your Market
2019 2018 2017 2016 2015
€ 20 bilion € 22 bilion € 20 bilion € 14 bilion € 12 bilion
|
Market Overview
The Dutch economy has been one of the out performers compared to 2018. For coming period GDP is expected to
in western Europe over the past few years. Unemployment stabilize around this year’s level out to 2022. The escalating
is at a record-low level, consumer spending continues trade conflict between the United States and China plays
to increase and investment remain at record levels. a key role, in the face of global uncertainty. In Europe, the
Although the Dutch economy is performing well, some approaching Brexit deadline and the political situation in Italy
key economic indicators such as exports and the Dutch are also causes for concern.
gross domestic product (GDP) have edged downwards
Major Transactions
Quarter Property Seller Buyer / Lessee Price, mln. $
Q1 Office Marathon UniImmo € 142 M
Q2 Office Magram Ltd Nuveen / Cityhold € 97 M
Q4 Industrial Somerset Invesco € 131 M
Q4 Industrial DHG Real IS € 142 M
Q4 Office Highbrook Invest Jamestown € 289 M
Market Data Trends
Price Office Rents 2019 Price Office Yields 2019
Location € SQ.M Yr Growth % Location Current Last Year
Amsterdam (South Axis) 475 5.6 Amsterdam (South Axis) 3.25 4.00
Amsterdam (Central) 500 17.6 Amsterdam (Central) 3.25 3.50
Amsterdam (South East) 245 0.0 Amsterdam (South East) 4.75 5.75
Rotterdam 235 0.0 Rotterdam 4.75 4.75
The Hague 210 0.0 The Hague 5.25 5.75
Utrecht 285 0.0 Utrecht 5.00 5.50
Eindhoven 210 13.5 Eindhoven 6.00 6.25Netherlands
Market Report 19
Market Opportunities Sector Overview
As available space is limited while demand Industrial
remains high, due to liquidity growth and low The demand from tenants and buyers for production and
storage spaces was high in the first nine months of 2019,
rates, the Dutch real estate market is expected which resulted in the free market - measured in transactions
to further tighten up. from 750 square meters of floor space - around 2.47 million
square meters of industrial space was included. Despite the
In addition to these factors, the Dutch real good demand, the transaction volume was lower than in the
estate market is facing the consequences of the same period last year. In 2018, sales amounted to 2.9
million square meters. The fact that fewer industrial space
nitrogen issue. This will lead to a decrease of
was rented and sold in the first nine months was largely due
investments in new-build markets. to a reduced demand for logistics real estate (distribution
centers and large-scale storage spaces). In this part of the
In a market which is already tight, the supply will market, take-up decreased from 1.87 million square meters
decrease only more. This will cause an increase to 1.6 million square meters.
of the value of Dutch real estate and the rental Office
rates. Office take up in the first nine months of 2019 was much
lower than the same period last year. Approximately 735,000
Yields will remain near historical lows. Economic square meters of office space was leased and sold, against
growth and investment returns will slow. There 920,000 square meters a year earlier. The lease of office
space was below the level of 2018, mainly due to a strong
will be a lot of capital chasing too few opportuni- reluctance in the demand for offices in the third quarter.
ties, and that competition could drive investors Nevertheless the demand for offices with a somewhat larger
into pushing yields lower. Investors with a higher area, spaces from 5,000 square meters, was stable. In line
with the first two quarters of the year the majority of the
risk appetite may not want to settle for low demand for office was related to existing buildings.
income returns. There are higher risk investments
Retail
for sale with higher yields, and there is a peer
On the Dutch retail market once more there was a hesitation
group of investors willing to buy them. in the trends in demand in the first nine months of 2019.
Both the number of retail transactions and the number of
square meters of retail space leased showed a decrease.
In total, around 243,000 square meters of retail space were
included, while in the same period last year, around 336,000
square meters were included. The decrease in the take-up
of retail space was not only due to a decrease in the number
of transactions completed. Also, in contrast to 2018, fewer
transactions of a larger size were concluded.
NAI Netherlands
Concertgebouwplein 15
Amsterdam 1071 LL
Netherlands
Bas Alink
3 (120) 364-0007 bas@nainetherlands.nl
www.nainetherlands.nl +31 20 364 0007Romania
Market Report 19
Country Profile Country Macroeconomic Profile
Population........ 22.171.000 GDP.............................. 944.22 bln lei
Capital City....... Bucharest or 4,722 USD per capita
Currency.......... ROL – Romanian GDP Growth.................. 3.8%
LEU Unemployment Rate....... 4.1%
Inflation.......................... 3.8%
5 Year Real Estate Investment Volume Your Market
2019 2018 2017 2016 2015
1.06 billion € 940 million € 1 bln billion € 900 million € 644 billions €
Major Transactions
Quarter Property Type Seller Buyer/Lessee Price, mln. $
Q4 Office buildings NEPI ROCKCASTLE AFI Properties 290 million euro
Q2 The Office NEPI ROCKCASTLE and Ovidiu Dedeman 120 million euro
Sandor
Q1 9 commercial centers MAS Real Estate PKM DEVELOPMENTS 113 million euro
Q4 3 Office Buildings in Radu Ciurtin and Florin Martis Ideal Project Services 30 million euro
Cluj-Napoca
Q4 BCR Pallace Vivion Luxemburg BCR 25 – 30 million euro
Q2 Two plots for retail Adrian Mititelu NEPI Rockastle 22 million Euro
project Craiova
Q4 DAY TOWER office Day Group CFH 20 million euro
building
Market Data Trends
Industrial 2019 Office 2019
Year City/Market Rent(euro/sqm/month) Yield Year City/Market Rent(euro/sqm/month) Yield
2019 Bucharest 3.5-4.5 8%-9% 2019 Bucharest 15-18 7%-8%
2018 Bucharest 3.5-4.5 8.25%-9% 2018 Bucharest 15-19 7.5%-8.5%
2017 Bucharest 3.5-4.25 8.5%-9.25% 2017 Bucharest 15-18 8%-8.5%
2016 Bucharest 3.25-4.25 8.5%-9.5% 2016 Bucharest 17-18.5 8%-8.5%
2015 Bucharest 3.25-4 9%-9.5% 2015 Bucharest 16-18 8%-9%
Retail 2019
Year City/Market Rent(euro/sqm/month) Yield
2019 Bucharest 60-90 7%
2018 Bucharest 60-90 7.25%
2017 Bucharest 50-80 7.25%-7.5%
2016 Bucharest 65-75 7.25%-7.5%
2015 Bucharest 60-70 7.5%-8%Romania
Market Report 19
Market Opportunities Sector Overview
Local and parliamentary elections are scheduled Industrial
for 2020 in Romania. Therefore, political The stock of modern industrial facilities overpassed 4
authorities will more likely keep a relaxing fiscal mil. sqm in 2019. Important development projects are
ongoing. The demand remains strong, despite concerns
and budgetary policy during the year. The
regarding national and European economies, with internal
consumption is expected to remain robust.
political instability increasing investors’ uncertainty and a
Thus, retail and industrial real estate markets will fragile European economic growth and Brexit affecting
be increasing, but at a lower rate than before. exports. The market is expected to evolve, but at a
Also, the increases in public sector wages slower pace, triggered by logistics for retail and electronic
maintain liquidity on the residential market, commerce, due to personal income increases in 2019 and
dominated now by high-quality projects. the pre-election 2020
The office sector will continue a slow growth, Office
The sector recorded high investments before 2020 and
after a strong development in 2016-2019. There
some projects are still ongoing. Prime properties are
are still important projects ongoing, mostly for
targeted most in terms of rent, but also for acquisition. The
prime office buildings. This sector is active in winning decision presently seem to be the incorporation of
primary cities, triggered by the expansion of the newest SMART technology in building conception and
multinational companies in Romania. the Green certification of the projects as differentiators. With
the economic activity forecasted to remain robust, the office
The yield has an expected slowly decreasing market is not expected to experience major downturns in the
trend, but continues to remain high in comparison near future.
to other markets in the region. The presence
Retail
of numerous important investment funds on
The retail sector recorded a strong growth lately and with
the Romanian market is a reassuring signal for the consumption expected to have an increasing trend also
potential investors. in 2020, the retail sector activity remains robust. However,
the investment activity slowed down in 2020 and focusses
Lastly, please provide the full names and
mainly on low risk small or medium projects in secondary
contact information for those who contributed to cities with low endowment in retail modern spaces and on
this report including any sources. projects in particular areas in primary cities badly deserved
by the present retail real estate stock.
NAI Romania Andrei Botis, MRICS
Managing Partner
87 Nicolae Caramfil Blvd
andrei.botis@nairomania.ro
4th floor, District 1. +4 0728989585
Bucharest 014142
Florin Maravela Andreea Curmei-Semenescu
Romania
Partner, Business Manager Director – Research Department
+40 311 01 18 90 florin.maravela@nairomania.ro andreea.semenescu@nairomania.ro
www.nairomania.ro +4 0730 624 007 +40 730 01 14 61Saudia Arabia
Market Report 19
Country Profile Country Macroeconomic Profile
Population........ 34,200,000 GDP.............................. $197,342 Million
Capital City....... Riyadh GDP Growth.................. 1-5%
Currency.......... Saudi Riyal Unemployment Rate....... 12%
Inflation.......................... 0.2%
5 Year Real Estate Investment Volume Your Market
2019 2018 2017 2016 2015
N/A N/A N/A N/A N/A
Market Overview
Saudi Arabia is considered as the heart of Middle East and In 2019 the market as whole was on a slower side which
North Africa region. With being world’s largest oil exporter, also affected the real estate sector. We saw more activity on
Saudi Arabia has a lot of potential in real estate with the the advisory and valuation sectors than the others.
government being the source of majority of major projects.
Market Data Trends Sector Overview
Year City/Market Rent Yield Industrial
2019 Riyadh / Office 980 psm 7% The industrial market is expected to stay slow in 2020 as well.
2018 Riyadh / Office 965 psm 7.5% With major activity being in relocations. New entrants in the
industrial market have slowed down drastically resulting in lack
2017 Riyadh / Office 930 psm 7.5% of activity and increase in supply.
2016 Riyadh / Office 930 psm 8%
Office
2015 Riyadh / Office 910 psm 8% Office market will remain favoured towards occupiers in the year
ahead where rents are likely to trend downwards. Especially in
Year City/Market Rent Yield
Riyadh, where strong rates of employment growth are being
2019 Jeddah / Office 750 psm 6% witnessed we expect the vacancy rates in the high end segment
2018 Jeddah / Office 740 psm 6% to continue to decline at the expense of increased vacancy in the
Grade B segment of the market.
2017 Jeddah / Office 735 psm 6.5%
2016 Jeddah / Office 720 psm 6.5% Retail
As a result of Government’s economic and social policies,
2015 Jeddah / Office 700 psm 7% we are seeing more participation of female workforce with in
Saudi Arabia. We have witnessed a positive trend in spending
Market Opportunities in retail sector. With rents expected to stay steady this year.
2020 is an exciting year for the Middle East, We are ex- growth and also increase in demand of the corporate and
pecting growth in terms of economic activity than previous residential sectors. The hospitality industry in Saudi Arabia
year within the region and within Kingdom of Saudi Arabia is also expected to grow with the introduction of e-visit visa
as well. The Real Estate sector shall expect good industrial and visa on arrival.
NAI Saudi Arabia
Ali Khan
Office 5/A, 5th Floor, Al Nakheel Tower
akhan@naisaudiarabia.com
King Fahd Road Branch
Riyadh, Riyadh +966 11 451 3333 / +966 11 430 4444
Saudi Arabia www.naisaudiarabia.comMarket Report
Serbia
19
Country Profile Country Macroeconomic Profile
Population........ 6.982.604 GDP ............................. $55.44 billion
Capital City....... Belgrade GDP growth .................. 4.4%
Currency.......... RSD Unemployment Rate....... 9.5%
Inflation.......................... 2.0%
5 Year Real Estate Development Volume Your Market
2019 2018 2017 2016 2015
€ 3.3 bilion € 2.8 bilion € 2.4 bilion € 2.5 bilion € 2.0 bilion
Major Transactions
Quarter Property Seller Buyer / Lessee Price, mln. $
Q4 Acquisition (office building, under SPV Private investor 19.7 mil EUR
construction 52.000sqm –
bankruptcy)
Q4 Acquisition (industrial complex IMR Ltd Belgrade Private investor 9.3 mil EUR
75.000 sqm – bankruptcy)
Q2 Acquisition (retail -67.5%) Fashion Company BIG CEE Confidential
Q4 Acquisition (office building, DUTB Roaming Networks Confidential
class A 12.000 sqm)
Q3 Acquisition (retail park, 45 stores) Poseidon Group BIG CEE 32,5 mil EUR
Market Data Trends
Rents & Yields Office Class A Rents 2019 Rents & Yields Retail High Street Yields 2019
Year City/Market Rent(euro/sqm/month) Yield Year City/Market Rent(euro/sqm/month) Yield
2019 Belgrade 15 -17 7.25 – 7.50% 2019 Belgrade 50 – 80 5.60%
2018 Belgrade 15.5-16.5 7.75 - 8.00% 2018 Belgrade 50 – 80 6.25%
2017 Belgrade 14.5-16.5 8.00 – 8.25% 2017 Belgrade 40 – 80 6.75%
2016 Belgrade 14 – 16 N/A 2016 Belgrade 40 – 80 N/A
2015 Belgrade 14 – 16 N/A 2015 Belgrade 40 – 80 N/A
Rents & Yields Prime Industrial Rents 2019
Year City/Market Rent(euro/sqm/month) Yield
2019 Belgrade 3–5 9.25%
2018 Belgrade 3–5 9.25%
2017 Belgrade 3–5 9.50%
2016 Belgrade 3–4 N/A
2015 Belgrade 3–4 N/AMarket Report
Serbia
19
Market Opportunities Sector Overview
We can expect that the positive trend of Industrial
development of the real estate market in Serbia In the previous years, we have seen a strong dedication to
will continue especially when it comes to new economy development and incentives available to investors,
which resulted in attraction of many companies in the
construction. This trend (the most present in
manufacturing and production sector. The main drivers of
residential market) is strongly driven by
market development were in construction of new distribution
investment expectations due to lack of alterna- and logistics facilities, but also in expansion of existing
tive investment opportunities (stock exchange production facilities of investors who are already present on
and low interest savings). Further development the market.
(under potential risk of over supply) is under
Office
strong influence of project finance and
The office stock in Belgrade at the end of 2019 was about
mortgage interest rates as well as stable growth 900.000 sqm. According to the current status of
of salaries (about 8.5% in the previous year). construction sites office stock will be significantly increased
When it comes to property prices, we should during this year. New Belgrade (CBD) is a dominant area
expect slight growth slowdown in 2020, due to (Class A office space) while the city center is still
pricing trend from 2018. undeveloped (Class B office space). According to demand
trend, there is permanent reduction of available free space
and also pre-lease reached the high level in previous year.
Retail
Having in mind investors that more often choose Serbia for
their future business operations, Belgrade’s retail market is
under significant expansion. New shopping malls and retail
parks are under construction and are bringing new brands
to the market. The most significant concept, especially in
secondary cities, are retail parks which have proven to be
very successful.
NAI WMG Luka Nisavic
lnisavic@naiwmg.com
Kraljice Katarine 154
11030 Nebojsa Stojanovic
Belgrade nstojanovic@naiwmg.com
Serbia Milos Antic
+ 381 11 3551 747 mantic@naiwmg.comSlovenia
Market Report 19
Country Profile Country Macroeconomic Profile
Population........ 2.089.310 GDP ............................. 45.755.000.000 €
Capital City....... Ljubljana GDP growth .................. 2,5 %
Currency.......... euro (€) Unemployment Rate....... 4,8 %
Inflation.......................... 1,8 %
5 Year Real Estate Investment Volume Your Market
2019 2018 2017 2016 2015
€ 2,5 billion € 2,3 billion € 2,1 billion € 2,1 billion € 1,6 billion
Major Transactions
Quarter Property Seller Buyer / Lessee Price, mln euro
Q1 Free market sales POSLOVNI SISTEM Supernova MC Lju, podjetje za 46.6 with VAT
MERCATOR d.d. oddajanje nepremičnin d.o.o.
Q2 Free market sales Raiffeisen LEASING TRIGAL d.o.o. 28.0
Q2 Free market sales Centrica Supernova 220.
Q1 Free market sales POSLOVNI SISTEM Supernova MC Lju, podjetje za 27.9 with VAT
MERCATOR d.d. oddajanje
Q4 Free market sales SITULA CITY, storitve in Zetland Capital partners 14.5
oddajanje nepremičnin, d.o.o.
Market Data Trends
Price Office Rents 2019 Price Retail Yields 2019
Year City/Market Rent(euro/sqm/month) Yield Year City/Market Rent(euro/sqm/month) Yield
2019 Ljubljana 16 6,5 - 7% 2019 Ljubljana 25 6,5 - 7%
2018 Ljubljana 16 7% 2018 Ljubljana 25 7%
2017 Ljubljana 14 7 – 7,5 2017 Ljubljana 20 7 – 7,5%
2016 Ljubljana 12 7,5 - 8% 2016 Ljubljana 20 7,5- 8%
2015 Ljubljana 12 7,5 - 8% 2015 Ljubljana 20 7,5- 8%
Price Industrial Rents 2019
Year City/Market Rent(euro/sqm/month) Yield
2019 Ljubljana 5 7,5 - 8%
2018 Ljubljana 5 7,5 - 8%
2017 Ljubljana 4 8 - 8,5%
2016 Ljubljana 3,0 8 – 8,5%
2015 Ljubljana 3,0 8 – 8,5%Slovenia
Market Report 19
Market Opportunities Sector Overview
In Slovenia, there is currently a Office
great lack of A class business Rents for offices in Slovenia remained stable in 2019. There is a lack of
new supply for class A and prime properties. Given that we expect slight
premises. No major construction is increase of average rents in this kind of properties. The vacancy rate in
planned in Ljubljana in the Ljubljana stands close to 0% for A-class buildings.
coming years, so it is expected
The office rental market activity is relatively high compared to the sales
that demand will continue to market. Indeed, the demand for offices for rent is currently much higher
exceed supply in the coming than the demand for purchase. (source: SMARS)
years. The demand is not only
high for office spaces, but also
Retail
for logistic and production halls Volume of retail trade in Slovenia has been strongly increasing, mostly
in modern industrial zones, but in Ljubljana. Slight increase of rents was recorded in prime locations
there are very few in Slovenia. and we expect that the same trend will continue. Vacancy rate is stable
and stands at approximately 5% or less in shopping centres and retail
Given the greater supply of parks in Slovenia. Location and size can play a large role in the vacancy
residential real estate than rate. There can also be a huge difference on rents depending on the
commercial, it is expected that in microlocation, there rents can also exceed 100 eur/m2/month.
the event of an economic crisis, Industrial
it will be more pronounced in the Average rents for industrial premises remained stable in 2019. Main
industrial centres are Ljubljana, Kranj, Maribor, Celje, Koper and Novo
housing market and on class B
Mesto. Most of the existing industrial properties in Slovenia are owner
commercial Real Estate. occupied.
Rents in business zones or in modern industrial warehouse market range
from 5 eur/m2/month and more, vacancy rate stands at very low levels,
even below 5%.
Market Overview
Despite the moderate downward trend in the number of concluded sales transactions, which we have witnessed since
the first half of 2017, the Slovenian real estate market remained relatively active in 2019 and so far shows no signs of
crisis. Q1 2019 saw the change of ownership of a large number of large retail centers, which resulted in a record value
of transactions in Q1 2019. After accelerating growth in the first half of 2018, residential real estate price growth slowed.
The real estate market is slowing down mainly due to rising prices and lack of supply of new construction.
NAI Significa
Vošnjakova ulica 1
Ljubljana 1000
Slovenia
+386 1 434 33 10Switzerland
Market Report 19
Country Profile Country Macroeconomic Profile
Population........ 8.57 million GDP.............................. $143’637 million
Capital City....... Bern GDP Growth.................. 0.9% (2019 – SECO)
Currency.......... Swiss Franc CHF Unemployment Rate....... 2.3% (2019)
Inflation.......................... 0.4% 2019
5 Year Real Estate Investment Volume Your Market
2019 2018 2017 2016 2015
N/A N/A N/A N/A N/A
Market Overview
With the Swiss Franc being regarded as a refuge currency, in stock, notably in the Glattalpark, West Zürich and
the economy remains strong. Major IT and accounting Europaallee areas over the past years. The principal investors
firms, international banks, large biotech and pharma in the market have remained the large Swiss Institutions,
companies have all shown a pronounced interest in the with demand outstripping supply and continued low interest
major Swiss Cities. The hospitality sector is also strong rates reinforcing values. Demand for prime investment
with high demand by international chains seeking to locate is forecast to remain high, sustaining the level of yields.
in major Cities. Geneva office rents have strengthened after Currently rents in Zürich remain relatively low despite
a couple of years of readjustment while Zürich continues to sustained demand with the exception of larger prime units
experience strong demand despite the important increase within the CBD where supply outstrips demand.
Major Transactions
Quarter Property Seller Buyer/Lessee Company Name Price, mln. CHF
Jan 2020 Office/Retail RFG Holding Brick Mark AG CHF. 130’000’000
Dec 2019 Office/Retail Credit Suisse IGIMO AG CHF. 300’000’000
Dec 2019 Office/Retail Mauch Massilo SA CHF. 56’500’000
Aug 2019 Office Next Immobilier SA Swiss Life SA CHF. 23’700’000
Market Data Trends
Year City/Market Rent CHF/SQM/p.a. Yield Year City/Market Rent CHF/SQM/p.a. Yield
2019 Zürich/Office 775 2.50% 2019 Geneva/Office 725 2.90%
2018 Zürich/Office 750 2.60% 2018 Geneva/Office 700 3.0 %
2017 Zürich/Office 750 2.80% 2017 Geneva/Office 750 3.10%
2016 Zürich/Office 725 2.80% 2016 Geneva/Office 830 2.90%
2015 Zürich/Office 750 2.80% 2015 Geneva/Office 830 2.80%Switzerland
Market Report 19
Market Opportunities Sector Overview
Given the strength of the Swiss Franc and hard Industrial
yields coupled with strong demand for invest- Despite pressure due to the strength of the Swiss Franc,
ment quality properties, maximization of return is 2019 showed an increasing trend for the location of
data-centres with Switzerland. Factors include safe
being found by means of acquiring “tired” well
location, security and good infrastructure. R&D is strong
located premises. Many tenants have rent-
within the biotech and pharmaceutical companies. Fine
ed on rolling leases, resulting in relatively low machine tooling also remains an important occupier in the
rents. By managing the leases of the tenants, it industrial sector notably within the Bern area. The Cantons
assures minimum loss of income during the of Zürich, Zug, Basel and Geneva are all highly competitive
planning period. Once vacated, the building can in this area and offer important incentives.
be fully refurbished. Demand for such products will
Office
ensure quality tenants at rents above market Geneva’s market supply continued to increase with
when compared with smaller units. By concluding sizeable Swiss rail developments notably at Pont-Rouge
investment type leases, this will optimize the coming on-stream and improved rail infrastructure between
capital value, hence ensuring high returns. Given Switzerland and France, resulting in large surface users
the need for Swiss institutions to acquire Swiss relocating to the satellite area. City center prime rents have
subsequently seen a moderate recovery. Zürich’s
real estate of an institutional quality, due to the
office market has continued to expand and a
limited supply, optimal returns may be achieved.
number of landlords have taken advantage to
refurbish provoking a high demand for good quality
waterfront space and sustained rental levels.
Retail
On-line shopping pressures are apparent in Geneva
and Zürich providing a “reality check” on the prime
rental levels. January 2020 sees the closure of Manor’s
department store on Zürich’s Bahnhofstrasse due to a rental
dispute with the owner. Luxury retail along Rue du Rhône
and Bahnhofstrasse has suffered less than the standard
retail, with fashion particularly under pressure. Both Geneva
and Zürich have seen pop up-stores, luxury cars, Co-working
offices and new style coffee shops enter into prime space.
NAI Commercial CRE
QUAI GUSTAVE-ADOR 6,
GENEVA, Switzerland Eric Howard, BSc FRICS
41 (22) 707 44 44 info@naicommercial.chMarket Report
Ukraine
19
Country Profile Country Macroeconomic Profile
Population........ 42 billions GDP.............................. 410 billions$ (PPP)
Capital City....... Kyiv, 3,7 mln. GDP Growth.................. 4,2%
Currency.......... Hryvnia, ₴ Unemployment Rate....... 8%
Inflation.......................... 4.1%
5 Year Real Estate Investment Volume Your Market
2019 2018 2017 2016 2015
22.8 $ billion 26.6 $ billion 21.8 $ billion 16.5 $ billion 14.3 $ billion
Market Overview
2019 has continued the positive dynamics of recent end of 2019, the Consumer Confidence Index reached
years. Minor adverse effects, such as a decline in the 91.7, which is an unprecedented shift: the level exceed-
agricultural index, were mostly seasonal in nature. In Jan- ed the pre-crisis 2013 level for the first time. The steady
uary-December 2019, retail turnover increased by 28.9% increase in wages in recent years has taken Kyiv to a dif-
compared to the same period of the previous year, ferent level. Over the last 2 years, the average wage has
amounting to $ 41.7 billion. USA. At the same time, the grown by about 60%. This indicator is one of the largest
figure in the capital, which increased by 40.3% compared in Europe.
to the same period last year, is $ 8.11 billion. USA. At the
Major Transactions
Quarter Property Seller Buyer/Lessee Company Name Price, mln. $
4Q Vodafone Prelludium B.V. / Allegretto Bakcell / Neqsol 734
Ukraine Holding S.a.r.l.
4Q IdeaBank Getin Holding S.A. Dragon Capital Investments Limited, Dragon 58,5
Capital New Ukraine Fund L.P.
3Q Regal Petroleum KYLESTONE LIMITED (Kelda Regal Petroleum plc. (Pelidona Services Limited, 47
plc. Ltd) Кипр / Smart-Holding,
4Q BC “Arsenal Maksim Mykitas Tarantino Family 10
Plaza”
4Q Office “Under Lion” Dragon Capital Consulting 4,9
Market Data Trends
Year City/Market Rent(euro/sqm/month) Yield
2019 Kiev 44.5 10-11%
2018 Kiev 42.3 12%
2017 Kiev 35.6 12%
2016 Kiev 34.3 14%
2015 Kiev 30.9 15%You can also read