14 THERMAL QUALITY ASSESSMENT OF SEMICONDUCTOR - Electronics Cooling
←
→
Page content transcription
If your browser does not render page correctly, please read the page content below
SUMMER 2021
                                                 electronics-cooling.com

FEATURED IN THIS EDITION

14 THERMAL QUALITY ASSESSMENT
   OF SEMICONDUCTOR
   COMPONENTS

19 EMERGING 5G NETWORKS:
   POTENTIAL ECONOMIC BENEFITS
   OF TWO-PHASE THERMAL
                                        6 CALCULATION CORNER
   MANAGEMENT
                                 ADVECTIVE THERMAL RESISTANCE

30 FUTURE TRENDS IN LED DRIVER
   SYSTEM MODELING                       35 STATISTICS CORNER
   MANAGEMENT                          COMPARING POPULATIONS

                                    © Copyright 2021 Electronics Cooling
Alpha’s Online Heat Sink Customization
                            Quickly and Easily Create a Custom Heat Sink

  Note:                                                                                                                                    Note:

  Estimated Price                                                                                                                          Estimated Price
  (Without Tax):                                                         Add Hole [Edit/Delete]                                            (Without Tax):
                                                                                                                                                                                                             Change Base Size [Edit/Delete]
  Quantity Unit price (US$)                                                                Location        C-bore         C-bore                                           Base Width                                     Base Length
                                              Effective Length/                                                                            Quantity Unit price (US$)
                              ID   Diameter                        Fin Removal Area      from Center   Component side     FIn side
      1         122.73                              THRU                                                                                       1         162.35               115                The cut section interferes with fins. Suggested size 65.3mm or 68.8 mm
                                                                                        X-axis Y-axis Diameter Depth Diameter Depth
      5             29.29                                                                                                                      5             43.56
                              1      4.5         Through          Minimum fin removal 15           15    -        -     -          -                                                                              Add Hole [Edit/Delete]
     10             10.01                                                                                                                     10             28.71                                                                   Location       C-bore         C-bore
                              2      4.5         Through          Minimum fin removal -15         -15    -        -     -          -
     50             5.56                                                                                                                      50             14.60     ID     Diameter Effective Length/   Fin Removal Area        from Center Component side      FIn side
    100             4.31      3      4.5         Through          Minimum fin removal -15         -15    -        -     -          -         100             13.70                           THRU                                X-axis Y-axis Diameter Depth Diameter Depth
    200             RFQ       4      4.5         Through          Minimum fin removal 15           15    -        -     -          -         200              RFQ
                                                                                                                                                                       1            6       Through                8               15       15   8.00     2.0    -          -
  Complete Imput                                                                                                                           Complete Imput
                                                                                                                                                                       2            6       Through                8              -15     -15    8.00     2.0    -          -

                                                                                                                                                                                                                    Add Tapped Hole

Proto Lead Time                                                                                                                            No MOQ, No Min.
   1-2 Weeks                                                                      No NRE Fee                                                 Order Value                                                                       Quick and Easy
Typical production                                                       In most cases, a tooling                                      Alpha can supply from a single                                                         A custom heat sink can
lead time is 2-3 weeks.                                                  fee will not be required.                                     piece to production volumes.                                                           be designed in minutes.

ALPHA Co., Ltd.                            256-1 Ueda, Numazu City, Japan 410-0316                                                     ALPHA NOVATECH, INC.                                 473 Sapena Ct. #12, Santa Clara, CA 95054 USA
Head Office                                Tel: +81-55-966-0789 Fax: +81-55-966-9192                                                   USA Subsidiary                                       Tel: +1-408-567-8082 Fax: +1-408-567-8053
www.micforg.co.jp                          Email: alpha@micforg.co.jp                                                                  www.alphanovatech.com                                Email: sales@alphanovatech.com

                                                                                       www.alphanovatech.com
CONTENTS www.electronics-cooling.com
2 EDITORIAL PUBLISHED BY
Lectrix
Victor Chiriac 1000 Germantown Pike, F-2
Plymouth Meeting, PA 19462 USA
4 TECHNICAL EDITORS SPOTLIGHT Phone: +1 484-688-0300; Fax:+1 484-688-0303
info@lectrixgroup.com
5 COOLING EVENTS www.lectrixgroup.com
News of Upcoming 2021 Thermal Management Events CHIEF EXECUTIVE OFFICER
Graham Kilshaw | Graham@lectrixgroup.com
6 CALCULATION CORNER VP OF MARKETING
Advective Thermal Resistance Geoffrey Forman | Geoff@lectrixgroup.com
Ross Wilcoxon
EDITORIAL DIRECTOR
9 IN MEMORIAM OF VLADIMIR SZÉKELY James Marengo | James@lectrixgroup.com
CREATIVE DIRECTOR
10 STRUCTURE FUNCTIONS: THE UNIVERSAL Chris Bower | Chris@lectrixgroup.com
TOOLS FOR THERMAL DESIGN, TESTING
BUSINESS DEVELOPMENT DIRECTOR
AND QUALITY CONTROL Janet Ward | Jan@lectrixgroup.com
Gábor Farkas and Márta Rencz
PRODUCTION COORDINATOR
14 THERMAL QUALITY ASSESSMENT OF Jessica Stewart | Jessica@lectrixgroup.com
SEMICONDUCTOR COMPONENTS SENIOR GRAPHIC DESIGNER
Voon Hon Wong, Diane DuVall, Andras Vass-Varnai, Kate Teti | Kate@lectrixgroup.com
Sujay Singh, and Márta Rencz CONTENT MARKETING MANAGER
Danielle Cantor | Danielle@lectrixgroup.com
19 EMERGING 5G NETWORKS: POTENTIAL
ECONOMIC BENEFITS OF TWO-PHASE ADMINISTRATIVE MANAGER
Eileen Ambler | Eileen@lectrixgroup.com
THERMAL MANAGEMENT
Raffaele Luca Amalfi, Ryan Enright, Vasileios Kafantaris ACCOUNTING ASSISTANT
Susan Kavetski | Susan@lectrixgroup.com
24 UPPER AIR ROOM DISINFECTION WITH
UV-C LUMINAIRE – METRICS AND EDITORIAL BOARD
MULTI-DOMAIN MODELING APPROACH Victor Chiriac, PhD, ASME Fellow
Genevieve Martin, Marc van der Schans, Martin Creusen Co-founder and Managing Partner
Global Cooling Technology Group
30 FUTURE TRENDS IN LED DRIVER SYSTEM vchiriac@gctg-llc.com
MODELING Genevieve Martin
P. Watté R&D Manager, Thermal & Mechanics Competence
Signify
genevieve.martin@signify.com
35 STATISTICS CORNER
Ross Wilcoxon, Ph.D.
Comparing Populations Technical Fellow
Ross Wilcoxon Collins Aerospace
ross.wilcoxon@collins.com
39 2021 COMPANY PRODUCTS & SERVICES
DIRECTORY ►SUBSCRIPTIONS ARE FREE
Subscribe online at
44 INDEX OF ADVERTISERS www.electronics-cooling.com
All rights reserved. No part of this publication may be reproduced or transmitted in any form or by any means, electronic, mechanical, photocopying, recording or otherwise, or stored in a
For subscription changes email
retrieval system of any nature, without the prior written permission of the publishers (except in accordance with the Copyright Designs and Patents Act 1988). info@electronics-cooling.com
The opinions expressed in the articles, letters and other contributions included in this publication are those of the authors and the publication of such articles, letters or other contributions Reprints are available on a custom basis at
does not necessarily imply that such opinions are those of the publisher. In addition, the publishers cannot accept any responsibility for any legal or other consequences which may arise
directly or indirectly as a result of the use or adaptation of any of the material or information in this publication. reasonable prices in quantities of 500 or more.
ElectronicsCooling is a trademark of Mentor Graphics Corporation and its use is licensed to Lectrix. Lectrix is solely responsible for all content published, linked to, or otherwise presented
Please call +1 484-688-0300.
in conjunction with the ElectronicsCooling trademark.
F R E E S U B S C R I P T I O N S
Lectrix®, Electronics Cooling®—The 2021 Spring Edition is distributed annually at no charge to engineers and managers engaged in the
application, selection, design, test, specification or procurement of electronic components, systems, materials, equipment, facilities or related
fabrication services. Subscriptions are available through electronics-cooling.com.
EDITORIAL
Victor Chiriac
Co-Editor of ECM

                                 Dear EC Readers,

                                 Welcome to the Summer edition of our magazine. We are happy to share with you the following
                                 articles ranging from future trends in LED driver designs, to advanced materials and liquid cooling
                                 solutions, to 5G Challenges in Data Centers. This year, we have seen a lot of progress on the Covid-19
                                 vaccination front, with the new infection levels dropping to lower values in most of the United States.
                                 However, other countries are still fighting a significant increase in daily infections and mortality, and
                                 there is still a lot to be done at the global level. We wish everyone a healthy and productive year, and to
                                 help and assist others whenever possible and needed.

                              Per the latest industrial reports, there are encouraging signs that the global industry is rebounding, as
new technologies are coming out on multiple fronts, spanning from medical/health, to semiconductor, to consumer electronics, data
centers, automotive, etc. There are notable changes and advancements in Artificial Intelligence (AI), advanced wireless networks,
quantum computing and automotive which open new frontiers for applications that were unimaginable 5 years ago. Just think where
we were 5-10 years ago with the semiconductor technology nodes, then fast forward to today's most advanced ICs, which use 7 nano-
meter (and smaller) technology nodes, with chips of the size of a U.S. quarter or 1 Euro coin that pack over 20 billion transistors.

There are strong signals that the Covid-19 pandemic is expediting the adoption of new technologies, ranging from Machine Learning,
AI, Engineering cloud technologies, while the Internet of Things (IoT) is making its way into the design space. Due to the limited
mobility of the technical population, the traditional build and test activities had to be replaced by remote meetings and digital com-
munication.

Think of the new trends in building smart, more efficient factories connected by IoT, along with advanced robots to make the as-
sembly and testing process more efficient. And in the not so distant future, intelligent Clouds with 5G connectivity will provide the
AI functionality to drive the fabrication process. Another notable trend is related to the aggressive development of smart cities that
will connect vehicles with signal lights to coordinate traffic and optimize the traffic flow. As vehicles become more energy efficient,
de-carbonized, safe and connected, they will be able to detect various roadblocks and construction, allowing drivers to avoid hazard-
ous situations. AI based video analytics will help build more efficient and much safer cities.

All of these advancements require fast data transfer and large data storage, significant improvements in the related thermal manage-
ment and materials solutions at the chip, package and system levels. Thermal management and cooling, materials and reliability are
critical for this 4th industrial revolution driven by AI, 5G, Machine Learning. Are you working on something new and exciting? Are
you converting your dreams into reality? Now is the time! We live in an unprecedented time period when the accelerating technical
and medical advancements significantly impact our life and social interactions, not to mention our survival in these pandemic times.

Using our best efforts, we are all working to move forward the thermal, mechanical and materials engineering crafts through our indi-
vidual and collective efforts. We hope that you will enjoy our articles and we invite you to continue to provide your feedback for our
publication content improvement and suggestions for future articles and topics.

Our readers - distinguished academia and industry leaders, practicing engineers and project managers - are the voices of our ther-
mo-mechanical community. We at Electronics Cooling magazine will echo and distribute your thoughts and suggestions throughout
the technical and scientific electronics cooling communities. We encourage you to contribute and publish topics and articles of in-
terest with many of our engineering peers, and to share your excellent technical achievements and further the learning of our young
engineers. Wish you a fruitful and healthy remainder of 2021. Stay healthy, happy, inspired and creative!

Best regards,
Victor Chiriac

2   Electronics COOLING | SUMMER 2021

TECHNICAL EDITORS SPOTLIGHT
Meet the 2021 Electronics Cooling® Editorial Board

                         VICTOR CHIRIAC, PhD | GLOBAL COOLING TECHNOLOGY GROUP
                         Associate Technical Editor

                         A fellow of the American Society of Mechanical Engineers (ASME) since 2014, Dr. Victor Adrian Chiriac is a co-
                         founder and a managing partner with the Global Cooling Technology Group since 2019. He previously held
                         technology/engineering leadership roles with Motorola (1999-2010), Qualcomm (2010 - 2018) and Huawei
                         R&D USA (2018 - 2019). Dr. Chiriac was elected Chair of the ASME K-16 Electronics Cooling Committee
                         and was elected the Arizona and New Mexico IMAPS Chapter President. He is a leading member of the
                         organizing committees of ASME/InterPack, ASME/ IMECE and IEEE/CPMT ITherm Conferences. He holds
                         19 U.S. issued patents, 2 US Trade Secrets and 1 Defensive Publication (with Motorola), and has published
                         over 107 papers in scientific journals and at conferences.
                         ► vchiriac@gctg-llc.com

                        GENEVIEVE MARTIN | SIGNIFY
                        Associate Technical Editor

                        Genevieve Martin (F) is R&D manager for thermal & mechanics competence at Signify (former Philips Lighting),
                        The Netherlands. She is working in the field of cooling of electronics and thermal management for over twenty
                        years in different application fields. From 2016 to 2019, she coordinates the European project Delphi4LED (3 years
                        project) dealing with multi-domain compact model of LEDs. She served as General chair of Semitherm conference
                        and is an active reviewer and technical committee in key conferences Semi-Therm®, Therminic, Eurosime.
                        ► genevieve.martin@signify.com

                        ROSS WILCOXON | COLLINS AEROSPACE ADVANCED TECHNOLOGY
                        Associate Technical Editor

                        Dr. Ross Wilcoxon is a Technical Fellow in the Collins Aerospace Advanced Technology group. He conducts re-
                        search and supports product development related to component reliability, electronics packaging and thermal
                        management for communication, processing, displays and radars. He has more than 40 journal and conference
                        publications and is an inventor on 30 US Patents. Prior to joining Rockwell Collins (Now Collins Aerospace) in
                        1998, he was an assistant professor at South Dakota State University.
                        ► ross.wilcoxon@collins.com

4   Electronics COOLING | SUMMER 2021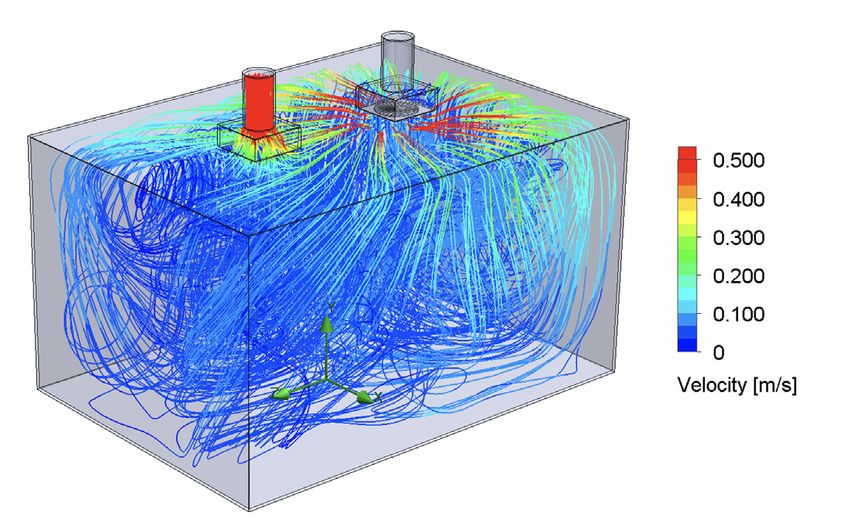
COOLING EVENTS
News of Upcoming 2021 Thermal Management Events

 OCT    THERMAL LIVE™
        Online Event
19-20
        Electronics Cooling’s Thermal LIVE™, the world’s largest online thermal management event, returns for its
        7th year this October. The two-day program features experts in the thermal management field, presenting
        live educational sessions on industry challenges, trends, and products. Past topics have included advanced
        thermal techniques in power electronics, design and manufacturing of blind mate couplings, selecting
        TIMs for different applications, calculations and design elements for liquid cooling, and more.

        If you’re an electronics or mechanical engineer who works with thermal management, this event is
        a can’t-miss.

        Desc. source: electronics-cooling.com
        ► https://thermal.live/

 NOV    SC21
        America's Center | St. Louis, Missouri
15-19
        The international conference for high performance computing, networking, storage, and analysis. Expand
        your knowledge, enrich your experiences, and network with others in the HPC community. Take in
        technical presentations, papers, workshops, tutorials, posters, and Birds of a Feather sessions. Explore
        exhibits showcasing the latest innovations from the world’s leading manufacturers, research organizations,
        and universities. And, enjoy exploring our host city St. Louis. Journey to the top of the Gateway Arch!

        Desc. source: electronics-cooling.com
        ► https://sc21.supercomputing.org/

 NOV
        THERMAL MANAGEMENT INNOVATION USA
        TCF Center | Detroit, Michigan
 16
        The Annual BEV Thermal Management Innovation USA Congress, Detroit is the number one event
        to match buyer requirements with expert solutions during the Automotive sector’s battery evolution.
        Following on from the tremendous success of the previous three events, Thermal Management
        Innovation USA has firmly established itself as the automotive industries first-class event to gain a clear
        and pragmatic view of the key challenges and current need to know learning objectives surrounding
        advanced battery thermal management systems; to increase efficiency, range, battery health, and optimize
        solutions for increasingly demanding advanced charging requirements.

        Desc. source: electronics-cooling.com
        ► www.battery-thermal-management-usa.com

                                                                                            Electronics-COOLING.com   5
C A L C U L AT I O N C O R N E R

Advective Thermal Resistance

                                                                                                                     Ross Wilcoxon
                                                                                  Associate Technical Editor for Electronics Cooling
                                                                                                                  Collins Aerospace

A
            previous Electronics Cooling Magazine article, which        considering a situation in which a coolant enters a tube that
            discussed the process for analyzing the thermal per-        has a constant surface temperature. If the tube is only a meter
            formance of cooling fans [1], mentioned the need of         long, it may be reasonable to assume that the appropriate typical
            accounting for the increasing coolant temperature as        temperature of the coolant as it flows past the tube surface is
air passes through a heat sink. That article used an ‘average’ air      close to the midpoint temperature. However, if that same uni-
temperature, which was defined as the midpoint between the inlet        form-temperature tube is 10km long, it is likely that the fluid
and outlet air temperatures. This article discusses that approach,      would essentially be at the tube temperature well before the end
as well as an alternate method that is more physically robust.          of the tube and, therefore, the average fluid temperature would
                                                                        be closer to the tube surface temperature. The accuracy of the
When a system is cooled with a fluid, the fluid temperature rises       midpoint temperature assumption shown in Equation 2 depends
as it passes through the system and absorbs energy through con-         on a combination of the mass flow of fluid and the convective
vective heat transfer. The larger the power dissipation or smaller      thermal resistance (heat transfer coefficient and amount of heat
the mass flow rate, the greater the rise in coolant temperature. As     transfer area).
the coolant temperature increases, a higher surface temperature is
needed to dissipate the same power with the same convection co-         A more general approach to account for the advective thermal
efficient. This increases the overall thermal resistance compared       resistance is to turn to methods developed for fluid-to-fluid heat
to a system in which the fluid temperature remains constant.            exchangers. The effectiveness-NTU method relates the effec-
                                                                        tiveness of a heat exchanger, ε, to the number of thermal units
One method of accounting for this ‘advective’ thermal resistance        (NTU). The effectiveness, which is defined as the actual heat
is to assume that the average coolant temperature is the mid-           transfer between fluids divided by the maximum possible heat
point between the inlet and outlet coolant temperatures. As long        transfer between fluids, i.e., ε = qactual ⁄ qmaximum possible, is a function
as the cooling fluid remains single phase (i.e., no boiling), the       of the heat exchanger configuration and the flow rates and spe-
outlet coolant temperature, To, depends on the inlet fluid tem-         cific heats of the two fluids. The NTU for a system is defined as
perature (Ti), the fluid’s specific heat (cp), the coolant flow rate    NTU = UA ⁄ (ṁcp)minimum , where ṁcp is the fluid mass flow rate
(ṁ), and the power dissipation (Q) as shown in Equation 1.              times its specific heat; the ‘minimum’ subscript indicates that the
                                                                        fluid with the smaller value of ṁcp is used to calculate NTU. The
                                                                        term UA is the inverse of the overall thermal resistance between
                                                                        the two fluids, including convection coefficients for both fluids,
Equation 1                                                              fin efficiencies, and conduction through the solid materials that
                                                                        separate the two fluids.
If we assume that the representative coolant temperature is the
midpoint between the inlet and outlet temperature (Tmid) = (To          A number of relatively complex equations have been developed to
+ Ti)/2, we can analyze the convective heat transfer to determine       calculate the effectiveness of heat exchanges with different geom-
the temperature of the heat transfer surface (Tsurface), which is as-   etries, configurations, etc. Fortunately for those of us who work
sumed to be uniform, using Equation 2.                                  in the area of electronics cooling, we generally do not need to deal
                                                                        with them. When there is only a single fluid involved, the effec-
                                                                        tiveness is simply ε=1– e–NTU. This equation allows us to easily
                                                                        account for the effect of advective thermal resistance to determine
Equation 2                                                              the heat transfer from a surface, which is assumed to be at a uni-
While this approach to account for the coolant temperature rise         form temperature, to a fluid with a known inlet temperature. The
is often quite accurate, it is an approximation because it assumes      UA term in the NTU calculation is the inverse of the thermal resis-
that the average coolant temperature is the same as the midpoint        tance, Rthermal = 1/hA, where h is the convection coefficient and A is
value. One can recognize the limitation of this assumption by           the effective surface area that accounts for fin efficiency.

6    Electronics COOLING | SUMMER 2021
Electronics COOLING | SUMMER 2021

Consider, for example, a 10 cm diameter tube that is held a fixed       method is needed for an accurate calculation by comparing the
temperature of 100°C. Air at atmospheric pressure enters the            heat transfer calculated with the other methods to that calculated
tube at 25°C and an average velocity of 1 m/s. Ignoring the ef-         using ε-NTU. Defining the calculation error as E = (Q-Qε-NTU)/
fects of developing flow, the convection coefficient is constant        Qε-NTU, the error associated with assuming constant coolant tem-
so the heat transfer to the air is only dependent on the tube           perature is:
length, which dictates the area available for heat transfer. Figure
1 shows the heat transfer calculated for this situation using three
different assumptions on the coolant temperature (the equations
that were used for these calculations are summarized in Table 1
                                                                        Equation 3
later in this article). For ‘Constant Coolant Temperature’, it is
assumed that the cooling air temperature is the inlet air tempera-      where Rth is the heat sink thermal resistance and NTU = (hA)/
ture throughout the tube. For ‘Coolant Midpoint Temperature’            ( ṁcp) = 1/( Rth ṁcp).
the average coolant temperature is assumed to be the midpoint
of the inlet and outlet coolant temperatures (using Equation 2).        Likewise, the error associated with using the midpoint coolant
The ‘Effectiveness-NTU’ results correspond to using the heat ex-        temperature can be calculated using:
changer ε-NTU approach for calculating the heat transfer. This
figure also shows the values of NTU calculated for the conditions
considered in this analysis.

                                                                        Equation 4

                                                                        These two error values are plotted in Figure 2. This shows, that
                                                                        at a high enough flow rate or thermal resistance, one can assume
                                                                        that the flow rate temperature is either fixed or equal to the mid-
                                                                        point temperature. However, at low flow rates, those assump-
                                                                        tions can lead to significant errors.

Figure 1. Calculated heat transfer to air flowing through a tube

Figure 1 shows that at low enough values of NTU, which may be
due to high thermal resistance (in this case, a short tube with rel-
atively small heat transfer area) or large mass flow rates, all three
approaches predict similar values for heat transfer. But as the
length of the tube increases (the NTU becomes larger), there is
substantial error associated with assuming the coolant tempera-
                                                                        Figure 2. Comparing errors of different assumptions for coolant temperature
ture remains constant. Eventually, at a large enough NTU the
midpoint temperature assumption also demonstrates increasing            Table 1 summarizes the equations that can be used to determine
error. Physically it is logical that the heat transfer would eventu-    the heat transfer (for a known heat sink surface temperature) or
ally asymptote to a fixed value as the tube becomes long enough         the heat sink temperature (for a known heat dissipation) with
and the coolant temperature approaches the wall temperature;            different approaches to account for the advective thermal resis-
this behavior is only demonstrated by the calculations using the        tance. This table also shows what inverse NTU (thermal resis-
Effectiveness-NTU method.                                               tance multiplied by the coolant mass flow rate times its specific
                                                                        heat) at which the calculation would be within ~5% of the cor-
One can estimate when and whether the effectiveness-NTU                 rect value calculated using the NTU-Effectiveness method.

                                                                                                                              Electronics-COOLING.com   7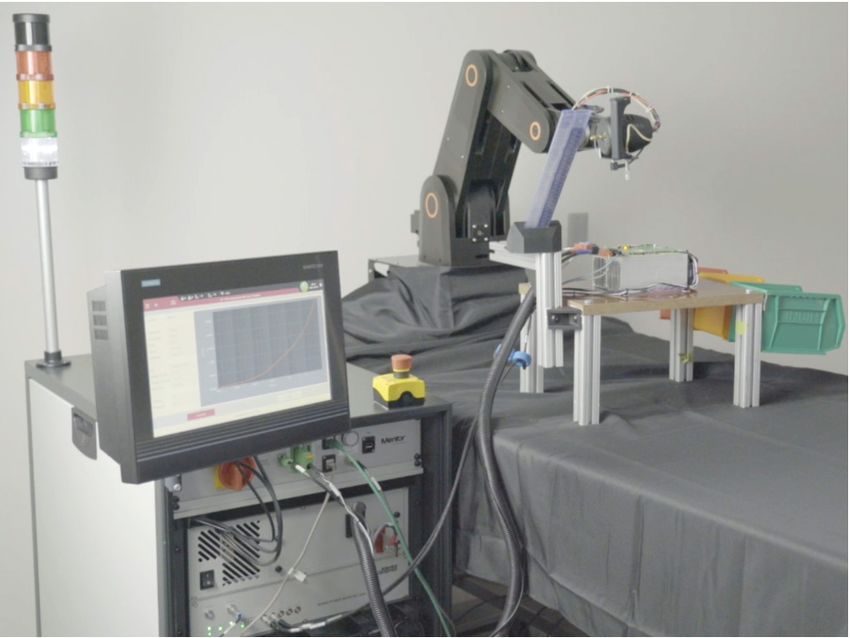
Table 1. Heat transfer & surface temperature equations for different advective thermal resistance approaches

SUMMARY                                                                               stant or to use the midpoint coolant temperature. However, the
This article described approaches that can be used to account                         NTU-Effectiveness approach that was described here should be
for the additional thermal resistance due to the coolant tempera-                     applicable to any situation.
ture increasing as it passes through the system it is cooling. The
magnitude of this effect depends on the coolant properties (spe-                      REFERENCES
cific heat), its flow rate, and the thermal resistance of the system                  1. Ross Wilcoxon and Genevieve Martin, “Fan Cooling – Part 1:
it is cooling. At low flow rates or high thermal resistance, it is                       Determining Flow Rate”, Electronics Cooling Magazine, Spring
acceptable to assume that the coolant temperature remains con-                           2021, pp. 6-9

8   Electronics COOLING | SUMMER 2021
IN MEMORIAM

Vladimir Székely (1941-2020)

Dr. Vladimir Székely, a former head of the Department of             of the Department of Electronic Devices of BME, MicReD Ltd.,
Electron Devices of the Faculty of Electrical Engineering and        which is now part of SIEMENS Digital Industries. He was the
Informatics of the Budapest University of Technology and             CTO of MicReD for about 15 years. Over the past decades,
Economics (BME), professor emeritus, full member of the              the products developed by him or under his control have
Hungarian Academy of Sciences, died silently after a long-           become world-famous in the field of thermal qualification
suffering illness in November 2020.                                  of integrated circuits and systems. In the last few years, the
                                                                     thermal transient tester and the measurement procedure
He was the developer of the Network Identification by                based on the evaluation of structure functions has become
Deconvolution (NID) method, which has enabled the Structure          a de facto standard for solid-state lighting technology, used
Function methodology, opening new avenues in thermal                 by most of the leading companies in the solid-state lighting
transient testing methodologies of semiconductor device              industry. To crown scientific and market success, the EIA JEDEC
packages.                                                            JC15 Standardization Committee, on a proposal from leading
                                                                     semiconductor manufacturers, adopted a test and modelling
Vladimír Székely was one of the outstanding electrical engineers     method based on thermal transient measurements and the use
of our time and one of the most significant lecturers of the         of structure functions as a standard.
Faculty of Electrical Engineering and Informatics of BME besides
being one of the most referred researchers of BME. This can be       All the activities of Vladimir Székely were characterized by a
proved by the thousands of Hungarian electrical engineers he         wealth of ideas. He patented a new principal printing device
taught about the physics and application of electronic devices       aimed for micro-computers about 35 years ago, and developed
and the basics of microelectronics. Students who have been           a prototype of a cash register that used it.
taught the use of computer methods in engineering design
for decades by him, or those who have been introduced to             He often combined methods from different engineering
the basics of image processing will remember his lectures in         domains in a surprising manner. He developed the algorithms of
all their life. His research activity was acknowledged by the        two thermal simulation programs which were also commercially
Harvey Rosten Award in 2000, and his outstanding work was            available, using novel and original solutions: image processing
recognized with prestigious prizes and honours in Hungary            combined with circuit theory, image processing and signal
(Academic Prize: 2002, Albert Szent-Györgyi Award: 2006,             processing algorithms combined with thermal engineering.
Denis Gábor Award: 2010).                                            These approaches were used not only in his novel thermal
                                                                     simulation methods but were part of, for example, a
Vladimir was a blood innovator, in the most positive sense           liquid crystal-based thermography system. These unusual
of the word, in both education and research. He introduced           combinations of basic principles also resulted in solutions
new, programmed teaching methods into university education,          far from thermal problems, e.g., his fingerprint recognition
decades ahead of his age and ahead of computers. His former          algorithm is still frequently cited today.
students still remember the precision and thoughtfulness of
their lectures as a model of university education. He was one        His new simulation methods and algorithms have always been
of the approx. 5 BME instructors, who were the first to get          verified by actual physical measurements. An early example
acquainted with computer programming and were the first              (dating back to circa 1972 - 1976) is the study of the influence
to start teaching computer programming at BME. Together              of thermal feedback on the electrical characteristics of OpAmps,
with his fellow professor, Kálmán Tarnay, they developed the         which included both electro-thermal circuit simulation and
TRANS-TRAN circuit simulation program in Hungary - at the            different physical experiments and measurements, such as liquid
same time as the first version of the SPICE program - with which     crystal-based thermography, frequency domain measurement
thousands of electrical engineering students learned the basics      of the output impedance, etc.
of computer circuit design. And this tool has treated already
also the thermal effects, which was his special interest.            The peculiarity of Vladimir Székely's work is that the role of
                                                                     hardware and software elements is the same in them. Every
In addition to his teaching work, especially in the last 25 years,   piece of equipment he designed is based on some witty, new
he has gained a very significant international reputation for        process, a novel engineering approach to a problem that no
his achievements in researching the thermal behaviour of             one has ever used before.
semiconductor devices and microelectronic systems. He led the
work of his research group in about 15 research projects carried     Unfortunately, his well-known long term illness has prevented
out in international cooperation, advancing the reputation of        him from directly participating in teaching and research for some
the knowledge of Hungarian engineers.                                years now, but his sentences are still mentioned today by his
                                                                     former students and colleagues, who will remember him forever.
Practical work has always been central to his interest. In order
to utilize the research results of the research group led by him,    Rest in peace Vladimir.
together with colleagues he established the spin-off company         Marta Rencz, Andras Poppe

                                                                                                                     Electronics-COOLING.com   9
F E AT U R E D
Structure Functions: The Universal Tools for
Thermal Design, Testing and Quality Control
Gábor Farkas
SIEMENS Digital Industry Software STS MA, Hungary
Márta Rencz
Budapest University of Technology and Economics
N
ear the end of the 20th century, increasing power lev- caused a difference in the thermal transient behaviour.
els became the primary challenge in system design,
which triggered a complex response from electrical,
mechanical and material engineers. The combination
of thermal measurements and thermal simulation helped achieve
thermally aware system designs. However, no real solution was
known for the valid comparison of thermal design concepts and
for identifying failure locations in actual samples during quality
control. Simulation attempts often failed because the thermal ma-
terial parameters from data sheets significantly differed from the
actual behaviour of thin material layers which typically build up
power packages and modules.
Breakthroughs often occur all of a sudden. In the 1980’s, Professor
Vladimír Székely studied a set of measurements of the temperature Figure 1. Temperature change on three samples of the same manufacturing lot after
change in time of an assembly after applying a sharp power step on applying a sharp power step
it. Three samples of the same manufacturing lot were tested.
It has long been known that, in thermal measurements, a very
It was obvious in this plot (Figure 1) that, for the first ~ half sec- stable measurement arrangement must be ensured in order to
ond the heat still propagated in the internal sandwich-like struc- achieve repeatability. Changes in the structure of the arrange-
ture of the sample, through the silicon chip, on which power was ment induce changes in the temperature response. In a conven-
applied, then through various layers of the investigated packaged tional interpretation of the data, the measurement of sample S3
device. After this half a second, the heat penetrated into the ther- in Figure 1 is good while the two other measurements are wrong.
mal paste (thermal interface layer, TIM) between the sample and However, in considering the results differently, the dissimilarity
the test bench. The screws that provided the fixing force to the in the measurement results is not considered to be the problem
sample were not tightened equally, leading to different thick- but is instead the solution needed for addressing the problems of
nesses of the thermal paste in the three cases. Structural changes measurement repeatability, as outlined above.
Gabor Farkas
Dr Gábor Farkas is Technical Manager at Siemens D in Budapest.
He received his MSc and PhD in electronics engineering from the Budapest University of Technology and Economics (BME), Hungary.
Since 2000 he has worked for MicReD. His main field has been developing hardware and software tools and measurement technol-
ogies for thermal characterization of semiconductor devices. He participates in research on wide band gap devices and power LED
devices. He is also an associate professor at BME. He has published over 60 technical papers in journals and in conference/workshop
proceedings. He is the author of chapters in technical books on integrated circuit design, measurement of power modules, LED and
wide band gap devices.
10 Electronics COOLING | SUMMER 2021Electronics COOLING | SUMMER 2021
(a) (b) (c)
Figure 2. Convolution in space (blurring) and deconvolution to restore the original picture
V. Székely was an expert on the theory of filters and a renowned For the convolution in time, which produces the bumpy curve
authority on image processing techniques. He knew how smudged at the output of a thermal resistance-capacitance (RC) network,
pictures can be restored to original sharpness. A defocused cam- the players in the scheme are again: an input signal, a filter and a
era causes a blurring of pictures, that is, the content of a pixel is convolved output signal. However, the target is now different: in
superposed on the neighbouring pixels by a certain weight. This the deconvolution scheme, the filter is the unknown that must be
is operation is known as convolution in space, a two-dimensional determined:
filter smashes the picture content over the image (Figure 2 a to b).
• from the known input signal: the waveform of the applied power
The process is a linear transformation; it can be reversed by a step and
deconvolution procedure (Figure 2 b to c). The theory of linear • from the output signal: the measured temperature change.
systems provides several algorithms for this operation, such as
Fourier transform or iterative methods. Some measurement apparatus is needed to apply the power and
to record the temperature change, but no external source (x-ray
Prof. Székely realized that the bumpy response curve of the device or acoustic) is needed for the investigation. The structure of an
under test and the measurement environment is the convolved sig- assembly can be identified using the inherent temperature chang-
nal of the sharp power step, at the output of a low pass filter [1]. es in the system.
Figure 3. The scheme of thermal transient testing, sharp power changes in time produce
a characteristic bumpy temperature change curve.picture Figure 4. Equivalent thermal RC net of an object characterized by its geometry and its
thermal resistances and thermal capacitances
The different layers in the structure have various geometries and Although the convolution theory and the use of RC filters seem to
thermal parameters, such as thermal conductivity and specific heat. be distant from the practical discipline of thermal transient test-
These can be represented by a dense net of thermal resistances and ing, it is easy to find a common denominator between them: the
thermal capacitances, with one or more entry points of the heat theory of linear systems. In the typical temperature range of use,
(driving points) (Figure 4). Thermal capacitances cause a delay in most non-linear effects (radiation, nonlinearity of thermal con-
the temperature increase because they can temporarily store the ductivity) can be neglected.
thermal energy.
Thermal conduction is dominated by a blend of two mecha-
In Figure 2, a known filter (the aperture of the defocused optics) nisms, heat propagation through an elementary slice (Figure
blurred the picture. The same known filter can be used to restore 5) and internal energy growth due to heat flow into the slice
the original from the convolved, blurred one in a reverse process. (Figure 6).
Electronics-COOLING.com 11Different material slices have different characteristic thermal pa-
rameters, the resulting different R magnitudes and τ time con-
stants make the T(t) curve “bumpy”, as seen in Figure 1.
In a fine net of series RC chain stages, Equation (1) approximates
an integral
Figure 5. Heat flow through a material slice
The formula says that the system response is the convolution-like
integral of an R(τ) time constant spectrum and a fixed f(t)=1 –
e– t/τ function. The inverse of (2) can be produced in an iterative
numerical process. The mathematical apparatus of such a decon-
volution procedure yielding R(τ) is rather complex; a rigorous
treatment of it is described in [2]. The procedure is called Net-
work Identification by Deconvolution, NID method.
Figure 6. Heat flow into a material slice
The theory of linear systems claims that the system correspond-
ing to Figure 4 behaves in the same way as a reduced set of ther-
Figure 8. Time constants in a lumped element system (a) and in a distributed parameter
mal resistances and capacitances arranged in one of the configu- system (b)
rations shown in Figure 7.
Before the advent of the NID method, the measured curved could
be approximated by 3-4 time constants that can be determined with
curve fitting. The NID method easily yields several hundred RC stag-
es and produces a fine resolution equivalent scheme of the structure.
Discrete time constants (Figure 8a) or their spectrum (Figure 8b)
can be produced with this process from a measured T(t) curve,
but the equivalent RC network corresponds to Figure 7a, which is
a behavioural model only.
In the physical reality, Figure 5 illustrates the temperature drop
across a material slice. In Figure 6, T1 and T2 temperatures are
measured from the ambient, a Cth thermal capacitance appears be-
tween a point representing the material portion and the ambient.
Figure 7. Foster (a.) and Cauer (b.) type filter representation of discretized structures
Serial RC chains (Figure 7a) can be converted to RC ladders (Fig-
Actual thermal systems correspond to the complex RC net of Fig- ure 7b) by the Foster – Cauer transformation known in linear cir-
ure 4. In a test, P(t) power is applied at some thermally connected cuit theory (see e.g., Annex C in [3]). These two processes (the
nodes and terminated by constant temperature at their boundar- exponential decomposition by deconvolution and the Foster –
ies. In case constant Pon power is switched on at zero-time (step Cauer transformation in a sequence), provide a direct synthesis
function), a single series RC element in Figure 7a will produce method for transforming measured transients into a one-dimen-
exponential temperature increase after switching on the power sional physical compact model of the complex thermal system.
(current), adding T(t) = Pon •R•(1 – e – t/τ) temperature (voltage)
term to the chain response. The R magnitude denotes the thermal The structure function (Figure 9) is an excellent graphic tool to
resistance of the fragment; τ =R•C is a time constant where C is characterise the heat conducting path. In the ladder of Figure 9b
the thermal capacitance. Accordingly, at the input (in this case at this chart sums up the thermal resistances, starting from the heat
the junction) we get a sum of exponential functions, source (junction) along the x-axis and the thermal capacitances
along the y-axis.
A low gradient section in the structure function means that, at
12 Electronics COOLING | SUMMER 2021Electronics COOLING | SUMMER 2021
the corresponding structural detail, even a small volume such as a simulated in the tool and structure functions can be composed
thin material layer that has low thermal capacitance causes large of those. Geometry and material parameters can be fine-tuned
change in thermal resistance. These regions have low thermal until the simulated and measured structure functions match.
conductivity or small cross-sectional area. • Measured structure functions can be compared to an already
identified “golden device”. This technique is advantageous in
production control.
Figure 9. Structure function: the graphic representation of the thermal RC equivalent of
the system
Steep sections of the function correspond to material regions of high
thermal conductivity, because a huge amount of matter represents
tiny additional thermal resistance only. These are typically metals;
the steepness also may indicate large cross-sectional area. Sudden Figure 10. Structure functions of the three samples of the same manufacturing lot and
the test bench
breaks in the slope indicate material or geometry changes.
In this short overview of the origin of structure functions and
Consequently: their possible use in thermal transient measurements and sim-
• Thermal resistance and capacitance values of details in an as- ulations, we intended to draw the attention of thermal engineers
sembly can be measured based on the temperature response on to the growing importance of thermal transient testing. We hope
a single power step. In this way structure function methodology that we succeeded to raise the awareness of the readers towards
can be used for device characterization or failure analysis. this very important method. Use cases and application fields can
• When geometrical dimensions are known, heat transfer co- be found in the papers listed in the references and in other related
efficients and specific heat values can be directly determined publications of the authors.
from the structure functions, either in-situ, in a real system or
in its mock-up. REFERENCES
• Moreover, in instruments where the thickness of samples can [1] https://en.wikipedia.org/wiki/Convolution, acessed 15-MAY-
be controlled or at least determined, thermal parameters of 2021
material layers or sheets can be measured, as the function of [2] V.Szekely: "Identification of RC networks by deconvolution:
thickness and pressure. Chances and Limits", IEEE Trans. On Circuits and Systems
– I: Fundamental Theory and Applications, Vol.45, No.3,
Figure 10 shows the structure functions converted from the tem- pp.244-258, 1998. DOI: 10.1109/81.662698
perature transients of Figure 1. The internal layers of different qual- [3] JEDEC Standard JESD51-14, "Transient Dual Interface Test
ity can be observed, and also the flat plateau corresponding to the Method for the Measurement of Thermal Resistance Junction-
thermal paste after the divergence point at 0.75 K/W and 1.1 J/K. to-Case of Semiconductor Devices with Heat Flow through a
Single Path" (November 2010) Available online: http://www.
In structure functions, many details of an actual assembly can be jedec.org/sites/default/files/docs/JESD51-14_1.pdf (accessed
distinguished along with their partial thermal resistance and ca- on 13 January 2021).
pacitance values. However, it should be noted that the structure [4] D. Schweitzer, H. Pape, L. Chen: “Transient Measurement of
function analysis is not a fully automated (“black box”) technique. the Junction-To-Case Thermal Resistance Using Structure
Functions: Chances and Limits”, Proc. 24th SEMITHERM,
There are three ways to assign actual assembly components to San Jose, CA, 2008, DOI: 10.1109/STHERM.2008.4509389
sections in the structure function. These are: [5] Katsuaki Suganuma (editor) : “ Wide Bandgap Power Semi-
• The manufacturer of the device may know all internal geom- conductor Packaging”, 1st Edition (Materials, Components,
etries and material parameters. In such a way, a “synthetic” and Reliability), eBook ISBN: 9780081020951, Paperback
structure function can be built up by, for example, superpos- ISBN: 9780081020944, Woodhead Publishing, May 2018
ing slices of material with given thermal resistance and ca- [6] P. Szabo; O. Steffens; M. Lenz; G. Farkas: “Transient junc-
pacitance in a spreadsheet tool, and comparing the measured tion-to-case thermal resistance measurement methodology
structure functions to it. of high accuracy and high repeatability”, IEEE Trans. on
• An approximate model can be built up in a finite element or Components and Packaging Technologies , 2005, Vol. 28,
a finite difference simulation tool. Thermal transients can be Issue: 4 pp: 630-636
Electronics-COOLING.com 13F E AT U R E D
Thermal Quality Assessment of Semiconductor
Components
Voon Hon Wong, Diane DuVall, Andras Vass-Varnai
SIEMENS Digital Industry Software
Sujay Singh
ON Semiconductor
Márta Rencz
Budapest University of Technology and Economics
Voon Hon Wong
Hon Wong is the APAC Business Development Manager in the Mechanical Analysis Business Development Team, based in Singa-
pore. He represents the Simcenter Flotherm and MicReD product lines. He has been using CFD tools for thermal and flow analyses
in electronics for two decades and has worked on thermal management and design issues. He is also experienced in the Energy,
Building and Process industries, etc. using CFD solutions. He was previously with Flomerics and Vestas prior to joining Mentor
Graphics, a Siemens Business. He graduated from the University of London and holds a PhD. from Cranfield University.
Diane DuVall
Diane M. DuVall joined Siemens in 2018 as a Presales Industry Consultant for the semiconductor industry. Diane is a passionate advo-
cate for semiconductor customers in realizing their success through digital transformation with Siemens products. Diane obtained a
BS in Chemical Engineering from Pennsylvania State University and a MBA from Arizona State University. Diane began her career as a
wafer process engineer moving to product engineering and then marketing and sales positions, and has over thirty years of industry
experience with Motorola SPS, VLSI Technology, Rockwell Semiconductor, Conexant, Skyworks Solutions, and Jazz Semiconductor.
Diane's background also includes experience with semiconductor test data analytics at Galaxy Semiconductor and Mentor Graphics, complementing
her product engineering experience. Diane also gained experience in electronics while working for Navman Wireless, focusing on GPS solutions.
Andras Vass-Varnai
Andras Vass-Varnai obtained his MSc and PhD degrees in electrical engineering at the Budapest University of Technology and
Economics. He started his professional career at the MicReD group of Mentor Graphics as an application engineer in 2007.Andras
worked most for over 10 years as a product manager, supporting development projects, such as the DynTIM or the Powertester
instruments. Before starting his current role as a global business development manager in Siemens, Andras worked out of Seoul,
Korea, supporting the Asian business activities. He is working out of Chicago IL currently, with dedicated focus on the US market
growth. His main topics of interest include thermal management of electric systems, advanced applications of thermal transient testing, characteri-
zation of TIM materials and reliability testing of high power semiconductor devices.
Sujay Singh
Sujay Singh received the Ph.D. degree in physics from The State University of New York at Buffalo, Buffalo, NY, USA, in 2016. Sujay
started his career at Fairchild Semiconductor as a Thermal Characterization Reliability Engineer in 2015. He is currently a Senior Prin-
cipal Reliability Engineer at ON Semiconductor. He is involved in the process, device, and packaging development teams to assess
the thermal and mechanical properties and reliability of power semiconductors. His current research interests include electronic and
thermal transport in micro/nanoscale, semiconductor device packaging, reliability, failure analysis, and resistive switching.
Márta Rencz
Márta Rencz received the Electrical Engineering degree, the Doctor in Engineering Degree and the PhD degree from the Budapest
University of Technology and Economics. She has received the Doctor of Science degree from the Hungarian Academy of Science
in the field of Microelectronics. She is a professor at the Budapest University of Technology and Economics. She has participated
in numerous international research projects, mostly in the field of investigating, measuring and modeling multi-physical effects in
electronics. She has published her theoretical and practical results in more than 300 technical papers. She was a co-founder
and CEO of MicRed Ltd that is now part of Siemens DI, where she still holds a research director position.
14 Electronics COOLING | SUMMER 2021Electronics COOLING | SUMMER 2021
R
INTRODUCTION packages, the presence of these defects in the die attach layer will
eduction in early life failures and continuous quality increase the overall thermal resistance of the package, and hence
improvements are “table stakes” for semiconductor negatively affect the junction temperatures of these devices. The
manufacturers servicing the automotive industry. “In- lifetime and reliability will be reduced accordingly.
dustry analysts expect that the automotive semiconduc-
tor market will be the fastest growing end use market for chips We can quantify this using the power semiconductor example in
from 2017–21, with a 6.4 percent CAGR and a total market val- Figure 1. The lifetime curve for this device operating at the max-
ue of between $39-42 billion with conventional vehicles contain imum junction temperature is shown. The typical and maximum
an average of $330 value of semiconductor content while hybrid junction to case thermal resistances of the device vary between
electric vehicles can contain up to $1,000 and 3,500 semiconduc- 0.14-0.17K/W. Using an average value of 0.15K/W for illustration
tors.” [1] The global power electronics market size is projected to purposes, a small increase of 5% in the thermal resistance due to
grow from USD 35.1 billion in 2020 to USD 44.2 billion by 2025, the presence of voids, will give a value of 0.1575K/W. This will
at a CAGR of 4.7%. [2] To satisfy the automotive quality stan- increase the junction temperature by just under 14°C. The num-
dards to support this market growth, semiconductor companies ber of cycles to failure is reduced from 26 million down to 1.6
are still challenged to achieve zero defects and continue to look million – corresponding to a tenfold reduction in the expected
for new ways towards this goal. lifetime of the device.
Historically, semiconductor companies would deploy early life
failure reduction efforts with electrical testing or geospatial tech-
niques to reject or test out potential failures. Burn-in and pre-
dictive test techniques like part average testing have been around
for a long time. Additionally, other geospatial methods, such as
visual defect screening and algorithmic yield clustering looking
for abnormal patterns, are used to predict early life failures. In
the quest for zero defects, companies must reduce defects and
also reduce variability. As thermal metrics are one of the most
important characteristics of a power electronics component, in-
line thermal resistance measures add another road to quality for
semiconductor companies. Furthermore, the quality of the man-
ufactured components heavily depends on the stability of process
parameters which are not always simple to control.
Figure 1. Thermal resistance variation impact shown on a lifetime curve for a power
semiconductor device
As an example, the materials used in die attach compounds con-
tain chemicals that are hygroscopic in nature. Moisture is ab- Thermal Quality Test Process
sorbed from the environment when the material is exposed. Con- In contrast to the visual identification of die attach voids, tran-
sequently, any temperature increase during the curing process sient thermal testing can be used to detect the presence of any
can result in moisture evaporation that leads to voiding. The die defects [3]. The tester communicates with an external handler,
attach pastes also contain volatile compounds which can outgas a robotic arm in our example, to pick up the components, place
and cause voids with elevated temperatures. Voids can also arise them onto the test jig, and bin them after the automatic evalu-
from the thawing of the die attach paste. The pastes are typically ation is completed. This processes cycles continuously until all
stored in plastic syringes at -40°C. During the thawing process pri- samples are evaluated and binned.
or to the application of the pastes, there is a difference in the coef-
ficient of thermal expansion between the plastic and paste, which During the actual device test, a short heating pulse is supplied to
can trap pockets of air at the interface between the two different the die and then turned off. This is followed by a brief cooling
materials. This can then lead to voids when the paste is applied. period where the temperature data is captured (Figure 3). The
heating and cooling times will vary according to the design and
The presence of voids in die attach joints can lead to the develop- internal layout of the packages to be tested, but typically, these
ment of cracks and interfacial delaminations. If the packages are will be in the order of maximum a few hundred milliseconds.
subjected to a reflow process, any absorbed moisture will vapor- This is sufficient to detect any defects within the structure. Con-
ize, resulting in higher stress concentrations and the formation of sequently, the total testing time for a device, including the time
cracks. Interfacial delaminations are caused by voids near or at for the external handler to position the device onto the test jig
the interfaces. The presence of these voids reduces the adhesion and bin it afterwards, would be on the order of seconds, at most.
between the two surfaces, and potentially leading to failure. Hence the test throughput for this would be extremely high, and
it will be possible to test every single component after the assem-
Besides the adverse effects on the mechanical strength of the bly process.
Electronics-COOLING.com 15In a production environment, it is not necessary to carry out a commercially available software [5]. An accurate thermal simula-
full thermal characterization test for every single component. A tion model is useful for investigating the presence of voids and to
shortened testing time that is able to sense the thermal response quantify how the overall thermal resistance of the packages will
of the defective layer will be sufficient. Based on the theory estab- change with respect to the void size variation. Ultimately, the
lished by Prof. Szekely, the mimimum heating time required to results from the void tests can be used to set the binning criteria
resolve the layer is one order of magnitude longer than its time for the tester.
constant. [4]
The thermal quality tests can begin once all the previous steps
A process for implementing and improving thermal quality test- are completed. The flowchart in Figure 4, includes a fourth step
ing is shown in Figure 4. This involves an initial thermal charac- marked in yellow. This represents a potential approach in which
terization test of a golden reference device (good sample without the collected test data are used to finetune the binning criteria by
any defects). The results from this test is used as the reference for overriding the recipe files that define the test conditions.
comparisons with the other samples to be tested.
Initially, the binning criteria is manually set by the operator (Fig-
Additionally, the structure function curve for the golden refer- ure 5). Multiple bins can be defined, and the minimum and max-
ence is used to calibrate a thermal simulation model created using imum thermal resistance values are specified at different time
Figure 2. Tester with optional robotic arm Figure 3. Reduced heating and cooling times for thermal quality tests
Figure 4. Thermal quality test workflow
Figure 5. User defined binning criteria. Three bins are created – good (green), medium (yellow), and poor (red)
16 Electronics COOLING | SUMMER 2021Electronics COOLING | SUMMER 2021
intervals. These bands are displayed graphically in the software. Voids within the die attach layer of the package were then simu-
lated through the use of cuboid blocks, as seen in Figure 8.
Devices whose measured thermal resistances fall within the pre-
set, defined bands will be placed in the correct bin automatical- Different void sizes were modelled, ranging from 1.34% to
ly by the test handler. The implementation of different bins can 65.71% by volume and resultant thermal impedance curves are
improve the production yield by reducing the number of faulty shown in Figure 9. The larger the void size, the higher the tem-
components in assemblies. perature elevation.
Identifying Binning Criteria
Thermal simulations using of a TO-220 device were carried out
(Figure 6). The objectives for these tests were to determine the
suitable measurement times for this device, quantify the thermal
effects of die attach voids and also to use the simulation results to
determine the binning criteria.
Figure 9. Thermal Impedance curves of the corner void simulations
Figure 6. TO-220 MOSFET structure used in the thermal simulations Thermal impedance curves are suitable to observe the effects of
voids in the model, structure functions can later help to analyze
This device was measured previously with a transient thermal tes- the exact location of the void. The thermal impedance curves
ter [6] and the test results were used to calibrate the simulation can also be used to estimate the required measurement times. In
model prior to any die attach void investigations. Figure 7 shows this case, we see that the curves begin to diverge at around 0.5
the results of this automated calibration exercise. With a calibrat- ms. At 5ms, we are already able to distinguish the differences
ed thermal model, we would be confident of the accuracy of the between most of the cases. By around 30 ms and beyond, the
thermal and transient response of this device for our subsequent thermal impedance curves become parallel to one another. By
investigations. delaying the measurement time to 50 ms, we would ensure that
heat flow path within the package has travelled to the die attach
and beyond. Visually, it is possible to view the differences in
thermal resistance or thermal impedance for all the different
void size cases. The only two exceptions are the two initial cas-
es with void sizes of 1.34% and 3.72%. The curves for both lie
very close to the no defect case. This indicates the lower limit of
the detectable void sizes on thermal impedance for this device
under test.
We are able to visualize the heat flow path within the package by
plotting the heat flux vectors developed at 50ms, as shown in Fig-
ure 10. The heat travels down towards the heatsink upon which
the device is mounted on. It then spreads out in a conical fashion
towards the other structural layers within the device.
Figure 7. Thermal model calibration result
Figure 8. Simulated voids emanating from the top left corner of the die attach
Electronics-COOLING.com 17You can also read