Focus on Energy The full potential of the Dutch subsurface - EBN
←
→
Page content transcription
If your browser does not render page correctly, please read the page content below
Focus on Energy The full potential of the Dutch subsurface
The Netherlands, land of…
Energy consumption Energy production
The Netherlands is an energy nation. We consume but also produce large
quantities of energy. Our most important energy source is natural gas. Follow- Energy (in)dependence per source State revenues: 280 bln Euro since 1966
1800
ing the discovery of the large Groningen gas field in 1959, hundreds of small 1.621
Production in The Netherlands 2009 2010 2011 2012 2013 2014 2015
fields were discovered by the natural gas industry. To this day, new fields 1350
1.202
Source: CBS
15
Source: CBS
1.138
continue to be discovered and brought into production, with this new gas also
12 14,5
Consumption in The Netherlands
900
10,4 10,7 10,3
PJ
being consumed in our complex energy system. Alongside natural gas, we use 5,3
462
many other sources such as oil, coal, renewable energies, and nuclear energy. 450
136 138
95
This infographic provides insight in the production and consumption of energy 0
0 0 39
in The Netherlands and provides a glance into the future energy system in Natural gas Oil Coal Renewable Nuclear Nominal Dutch state income from natural gas
energy and oil production in bln Euro
which renewable energies will play an ever growing part.
2016
Primary energy consumption Energy production in The Netherlands
Import Export
Other 3% Nuclear 1% Renewable Other 4%
11328 PJ energy 7% 9292 PJ
Renewable
energy 4%
Oil 5% Natural
Natural
Coal 17%
3144 PJ Gas 38%
Consumption 1927 PJ Gas 84%
natural gas Average yearly
investments oil &
76%
Direct use
gas sector 2005-2015
1,6 bln
Euro per year
Oil 37%
17%
Electricity
7% 600
17%* 5% 19% 46% 13% Feedstock Ca. 800 Ca.
offshore
155
Onshore producing wells
producing wells
offshore
platforms
Offshore production
Gas 14,0 Bln m3
Gas and oil reserves Oil 8,18 mln barrels
Households 429 PJ (17%) Industry 1187 PJ (46%) Electricity
Natural gas 74% Energy function 625 PJ (De)central production
Remaining gas
Groningen
891 Bln m3
665 Bln m3
2500
396 PJ Small fields 226 Bln m3
inactive/
Electricity 19% Natural gas 34% Of which onshore 109 Bln m3 decommissioned wells
Natural gas 42% Of which offshore 117 Bln m3
Biomass 4% Oil 20%
Heat 3% Electricity 17%
Coal 35%
Remaining oil 199 mln barrels
Of which onshore 129 mln barrels 200
Of which offshore 70 mln barrels production locations
Wind 7% 24%
Source: Annual report Natural resources and Geothermal energy in the Netherlands 2015 , TNO
Coal 15%
on land
remaining gas
Biomass 4% in Groningen field
Mobility Heat 11%
Gas and oil production
489 PJ (19%) Nuclear 4%
Gas production 49,7 Bln m3
Biomass/gas 4%
Groningen 28,1 Bln m3
477
Oil 96% Solar 1% Small fields 21,6 Bln m3
Energieverbruik
Feedstock 562 PJ Of which onshore 7,5 Bln m3
Biomass 3% Other 7% Of which offshore 14,0 Bln m3
Electricity 1%
Oil 85%
Import balance 32 PJ Oil production 10,69 mln barrels discovered
Of which onshore 2,52 mln barrels
gas fields
Source: Nationale Energieverkenning 2016, ECN, PBL, CBS, RVO
Natural gas 15%
Of which offshore 8,18 mln barrels
Agriculture
136 PJ (5%) Schoonebeek
Primary energy mix Gas and oil drillings Largest oil field
in The Netherlands
Natural gas 89% 2015 3144 PJ / 2030 2986 PJ (current policies)
Number of drillings 35
of which exploration 11
Biomass/gas 8% of which succesful 8
Natural 38% 32 % Renewable 4% 14%
gas energy Succespercentage 73%
Heat 5% % success last 10 yrs. 64%
Oil 37% 41% Nuclear 1% 1%
Oil 1% Gas fields
Coal 17% 13% Other 3% -1%
Geology & technology Gas and oil fields Oil fields
Electricity -3% **
Duration of drilling to 4km in The Netherlands
Source: hoewerktgaswinnen.nl
2 months
Source: IPCC 5th Assessment, 2014: Lifecycle analysis “Min” values
Greenhouse gas emissions
Other sectors *** Depth of gas fields
253 producing
with electricity production (generic data)
2-4 km
345 PJ (13%) 800 gas fields
Production duration of 4 gas storages
Natural gas 42% a small field
10825_1 - 2016 / design and realisation: a-design.nl
600 5-30 years
gCO2eq / kWh
Electricity 35%
Biomass/gas 12%
400 * part of final end use of energy
** Net delivery to electricity grid Remaining reserves
891 199
*** Trade, services, government,
water and waste management Gas Oil
Other 10% 200
Bln m3 mln barrels
Oil 1% 0 • Figures represent 2015 unless displayed otherwise.
• Excluding changes in energy inventories and
Wind Solar PV (rooftop) Natural gas Coal bunkering for international shipping and aviation
Powered by EBN
2
Contents
Foreword 4
Executive summary 6
1. Energising the transition 8
OUR DUTCH GAS 16
2. Reserves, resources, production & economics 18
2.1 Reserves and contingent resources 20
2.2 Maturation 20
2.3 Stranded fields and prospective resources 21
2.4 Industry activity 22
2.5 Drilling costs 24
2.6 Production 25
2.7 Recovery factor 26
2.8 Economics 27
3. Exploring for new prospects and play concepts 32
3.1 Exploration activity 34
3.2 EBN exploration studies 35
Ventoux: An Upper Jurassic lead mapped on new seismic data 35
Upper Jurassic shallow marine sandstones in the northern offshore 38
Triassic reservoir sands in the Dutch northern offshore 38
Dinantian carbonates: synergy between hydrocarbon and geothermal projects 40
Hydrocarbon shows revisited 42
4. Reservoir stimulation and production optimisation 44
4.1 New insights into hydraulic fracturing 46
4.2 Gas well deliquification 49
5. Infrastructure in a changing environment 52
5.1 Cost reduction initiatives 54
5.2 Integrating offshore wind with oil and gas production 54
RETURN TO NATURE 56
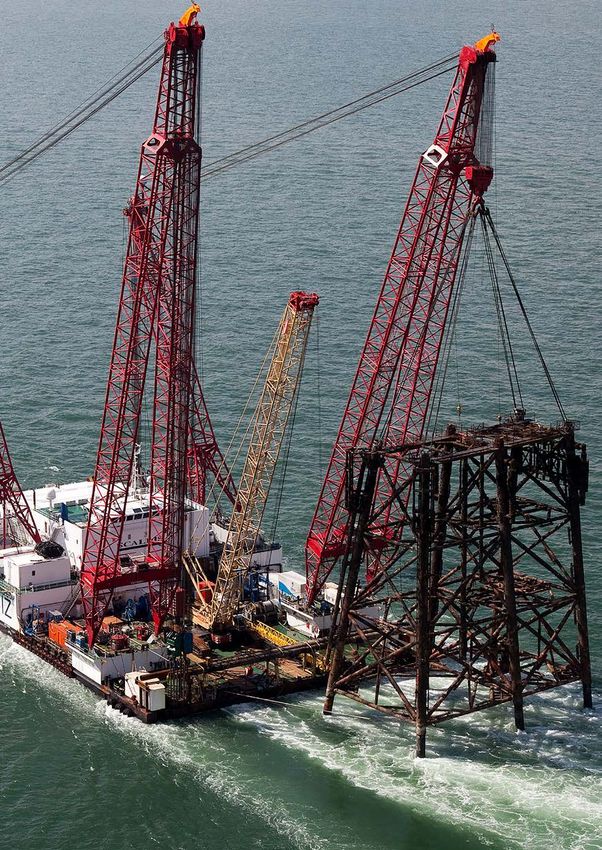
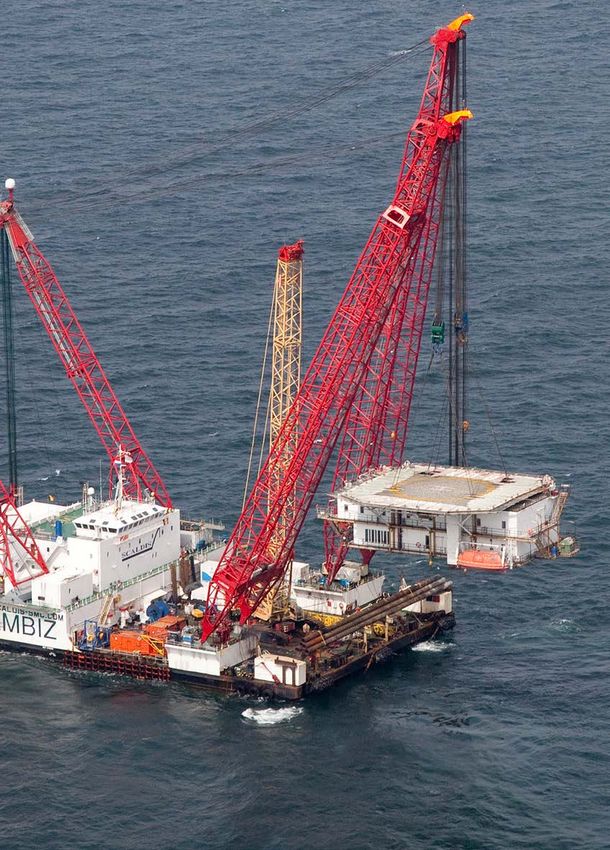
6. Decommissioning and re-use of oil and gas infrastructure 58
6.1 The decommissioning landscape in the Netherlands 60
6.2 Decommissioning: a joint effort 64
6.3 Future use of installations: re-using, repurposing and recycling 67
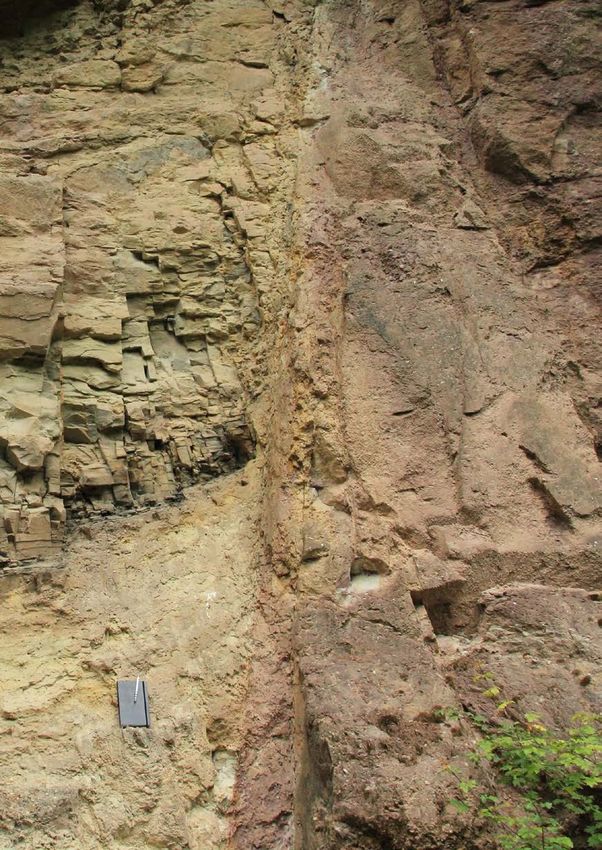
6.4 Innovative decommissioning – natural seals 68
NEW ENERGY 72
7. Geo-energy from the Dutch subsurface 74
7.1 EBN’s involvement in geothermal energy 76
7.2 Exploring the potential of ultra-deep geothermal energy 77
7.3 Accelerating development of geothermal energy in Brabant 78
7.4 Geothermal energy in the ‘heat roundabout’ 79
7.5 Potential synergies between geothermal energy and hydrocarbons 80
7.6 Carbon Capture Utilisation and Storage 80
8. Research, development and innovation 85
8.1 Joint industry efforts 86
8.2 In-house research 88
8.3 Student projects 90
Glossary 94
References 95
Acknowledgements 95
About EBN 96
Disclaimer 97
3
4
Foreword
The energy transition:
From deliberation
to deeds
According to the Energy Agenda of the Ministry of knowledge of the subsurface and of investing in
Economic Affairs (December 2016), it is “crucial subsurface projects, we can be an exceptionally
that in the coming years, the remaining, largely valuable partner in the energy transition.
marginal, gas reserves on the Dutch part of the
continental shelf can still be connected to the infra- We believe that it is especially important that the
structure (platforms and pipelines) present in the energy transition proceeds smoothly. The run-up
North Sea. The stimulation to support the develop- phase is over and it is now time for the implementa-
ment of small fields will therefore be continued. tion of the transition and the achievement of tangible
The reduction of gas production in the North Sea has results – in other words: there’s an urge to go from
the inevitable consequence of accelerating the deliberation to deeds. The parties that have joined the
decommissioning, dismantling and removal of the so-called ‘Transition Coalition’ (of which we are one)
platforms and associated infrastructure. The terres- are attempting to speed up the energy transition
trial gas-producing locations will also have to be together. The fact that over 60 parties have joined,
cleared up in the future.” emphasises the prevailing conviction that we are
striving to attain a CO2-neutral energy system. In
Two of our strategic pillars connect with this perfectly. order to accomplish this, the subsurface will continue
In what we call ‘Our Dutch Gas’ we are working on to play an important role in the coming decades. Our
optimising exploration and production of our gas focus is therefore no longer so much on oil and gas,
fields, in a sustainable and safe manner. Within the but on energy – specifically, energy from the Dutch
theme ‘Return to Nature’ we are pioneering the subsurface, as is reflected by the title of this year’s
effective dismantling and repurposing of abandoned edition of Focus.
oil and gas platforms.
The transition to a sustainable energy mix is a joint
One challenge arising from the energy transition that effort and we are proud to present interviews with
touches on another of EBN’s areas of interest is the representatives of the Dutch energy world in this
search for sustainable solutions, for example to meet publication. Add to these interviews the thorough
the demand for both low and high temperature heat. description of our activities and a glimpse of what the
We have therefore added a priority to our strategy: future holds, and we believe that this edition is well
‘New Energy’. This theme focuses on developing worth reading.
sustainable energy from the subsurface, such as deep
and ultra-deep geothermal energy, CCUS and energy We would like to know your ideas about the energy
storage. We support the Ministry of Economic Affairs transition and look forward to have a dialogue!
in the development of geothermal energy, and
together with the Ministry and TNO we explore Jan Willem van Hoogstraten,
participation in so-called ‘Green Deals’. Given our CEO
5
Executive summary
The national Energy Agenda foresees gas continuing to play a role in the decades to come. Domestic natural gas
is preferable to importing resources, due to its relative low CO2 emission during production and its important
contribution to the Dutch economy. Optimal usage of gas resources (‘Our Dutch Gas’) is one of the three pillars
on which EBN’s focus on realising the best value for Dutch geological resources rests. The other two pillars are:
taking control of the decommissioning challenge (‘Return to Nature’); and optimising geothermal developments
(‘New Energy’).

Our Dutch Gas                                                       This may add some 150 bcm until 2050.
•   Total reserves from small fields developed with             •   Additional exploration opportunities identified
    EBN participation declined by 15% in 2016 com-                  by EBN include the Ventoux lead in block F08,
    pared to 2015 due to falling oil and gas (O&G)                  which consists of multiple Upper Jurassic targets
    prices. Reserves accounted for 117 bcm and con-                 that can be tested with a single exploration
    tingent resources for 181 bcm. The prospective                  well. Furthermore, recent work shows that the
    resources included 200 bcm of risked, recover-                  Jurassic Kimmeridgian to Volgian sands from
    able volumes from the Rotliegend and 30 – 40 bcm                which hydrocarbons are produced in the UK and
    from the Triassic and Carboniferous.                            Germany are also present in the Dutch sector,
•   The maturation figure of 2016 is 9.3 bcm for all                opening up a potential new play.
    small fields, which is comparable to the 2015 fig-          •   A regional study has found that Triassic Main
    ure. Production from small fields was 8% less                   Buntsandstein reservoir sands do occur north of
    than in 2015.                                                   the main fairway, which shines new light on
•   The total invested CAPEX was 50% of that in                     the Triassic prospectivity in the Dutch northern
    2015. Because of the lower costs in the service,                offshore; 44 untested structures have been iden-
    supply and construction industries, the potential               tified.
    of   the   remaining   reserves    and   contingent         •   The Lower Carboniferous Dinantian carbonates
    resources is still high and rewarding. It is expected           have recently become an exploration target for
    that investment will recover in the longer run to               both      hydrocarbons   and   geothermal   energy.
    between some EUR 700 million and EUR 1 billion.                 Evaluation of recent wells and seismic mapping
•   Due to the low gas price, the net profit margin of              show the potential for fractured and karstified
    small fields has declined sharply, but it is still              producing reservoirs.
    positive. The unit OPEX has been stable since               •   Tight reservoirs greatly benefit from hydraulic
    2014 at around EUR 0.06/Nm . Given the current
                                   3
                                                                    fracturing. Recent modelling shows that the
    trends in gas price and expected decreasing pro-                benefits also apply to reservoirs with good per-
    duction costs per Nm3, profit margins are likely                meability, even during advanced stages in their
    to recover in 2017.                                             production life. Hydraulic fracturing adds value
                                                                    even when the economic time horizon is short. A
•   EBN sees potential for an upside scenario from                  portfolio analysis of the hydraulic fractures in
    enhanced activities such as exploration, tight gas              the Netherlands reveals that virtually all fracking
    development, increased recovery, infrastructure                 jobs with pre-fracking production are a technical
    optimisation and resources that could follow                    success and almost always have a positive effect
    from collaboration within the energy industry.                  on the NPV.

                                                            6
•   Liquid loading is a common challenge for fields                1) Establish a National Platform that drives
    in the mature or tail-end production phase.                    the agenda for decommissioning and re-use,
    Recent work shows that deliquification methods                 2) Establish a National Decommissioning Data-
    that use velocity strings and foam have a success              base, 3) Promote effective and efficient regula-
    rate over 70%, with an NPV of EUR 2 – 20 million               tion, and 4) Share learnings. These priorities
    per well. These techniques are a very valuable                 have been implemented within a JIP between
    asset and justify the costs of installation.                   nine operators and EBN.
•   The transition to a sustainable energy system is
    manifested by the current development of wind              New Energy
    farms offshore, resulting in an electricity grid to        •   With its potential for geothermal energy, Carbon
    which offshore platforms could be connected.                   Capture Utilisation and Storage (CCUS) and
    This would eleminate the need for local power                  energy storage, the Dutch subsurface can con-
    generation and subsequently reduce CO2 emis-                   tribute significantly to a sustainable energy mix.
    sions and operational costs dramatically, extend-              EBN will explore synergies with the development
    ing the lifetime of the installations.                         of geothermal energy and will facilitate the
                                                                   development of CCUS.
Return to Nature                                               •   Ultra-deep geothermal energy (UDG) could
•   Ultimately, the O&G infrastructure will be                     deliver an important contribution to the transi-
    decommissioned. Estimated decommissioning                      tion to a sustainable heating system, especially
    costs amount to some EUR 7 billion in total for                for industrial processes where higher tempera-
    the Dutch upstream O&G industry. The total                     tures are necessary. The first step in UDG devel-
    infrastructure in line for decommissioning com-                opment will be to explore the Dinantian play in
    prises 506 platforms and locations, over 5,500                 three regions. The ultimate objective is to unlock
    km of pipelines and about 1400 wells.                          the UDG potential in the safest, most cost-effec-
•   Sustainable dismantling of the infrastructure is               tive way. EBN anticipates that there will be ample
    key and all the possibilities for future use should            room for synergy between the three sub-plays,
    be investigated. Naturally, the first choice should            resulting in increased quality and reduced costs.
    be to consider re-using the infrastructure for oil         •   Because of its expertise in approaching subsur-
    and gas. A second option would be to utilise the               face projects, EBN has worked together with TNO
    infrastructure for alternative purposes, such as               and Geothermie Brabant B.V. on two concepts:
    power-to-gas, CO2 storage and compressed air                   integral project development and the introduc-
    energy storage. Onshore, the re-use of O&G wells               tion and application of the portfolio approach
    for geothermal purposes is being investigated                  for geothermal projects in Brabant. The combi-
    and parts of the pipeline network could be used                nation of both has great benefits for geothermal
    in the production and transportation of biogas.                projects.
    As a last option, the materials should be opti-            •   The geothermal and hydrocarbon sectors have
    mally recycled.                                                joined forces to investigate how synergies might
•   It is a shared responsibility of the O&G industry to           be exploited. EBN is hosting an exploratory
    decommission safely, environmentally responsibly               roundtable discussion on behalf of DAGO, Sticht-
    and    cost-effectively.   Initial   priorities   in           ing Platform Geothermie and KVGN regarding
    The Netherlands Masterplan for Decommissioning                 synergies between gas and geothermal energy.
    and Re-use, as presented in November 2016, are:

                                                           7
8

Energising 1
the transition

              Energising the transition

      9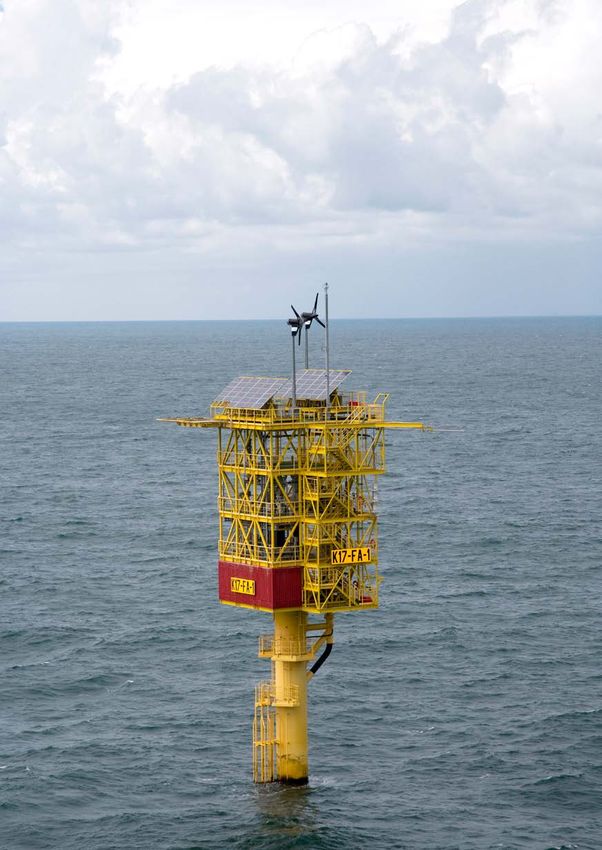
F
ossil fuels currently meet 92% of the Given the importance of natural gas for meeting the
demand for energy in the Netherlands, demand for energy in the Netherlands, the best way
revealing the great challenge for the tran- to reduce CO2 emissions is to use Dutch gas. The
sition to a climate-neutral energy system. Energy Agenda confirms that domestic natural gas
Natural gas currently accounts for 38% of the Dutch is preferable to importing resources, due to the
primary energy mix – a share that has remained relative low CO2 emission during production in the
fairly constant in recent decades. What particularly Netherlands (see Focus 2014). Furthermore, domestic
defines the versatility of natural gas are its trans- production contributes significantly to the Dutch
portability, its capacity to achieve high tempera- economy.
tures when combusted and its chemical structure.
On top of this, due to its historical availability, Additionally, the hydrocarbon assets and infra-
natural gas is the main source of energy for house- structure, as well as the knowledge and expertise of
holds, industry and agriculture in the Netherlands, the Dutch subsurface resulting from decades of oil
and it is used to generate 42% of Dutch electricity. and gas (O&G) production, could be used effectively
Moreover, it is an important feedstock for several to reduce CO2 emissions by developing alternatives
industries. The national Energy Agenda published late to natural gas. EBN and other parties in the gas
2016 by the Ministry of Economic Affairs foresees gas sector have defined a programme in which the
continuing to play a role in the decades to come. strengths of the natural gas value chain are exploited
to speed up sustainable projects. For this endeavour
Making the energy system more climate-friendly to succeed, far-reaching collaboration, innovation
means meeting the energy demand with the right and creativity are required. As part of EBN’s renewed
type of supply. Natural gas occupies the middle rung strategy, EBN will explore synergies with the develop
on the ‘the ladder of seven’, a system ranking the ment of geothermal energy and will facilitate the
options for energy supply with respect to CO2 emis- development of CCUS (Carbon Capture Utilisation
sions developped by the national Dutch gas associa- and Storage). Other projects are offshore energy
tion KVGN. Top priority is 1) energy saving, followed integration, renewable gas, LNG in heavy transport
by using 2) renewable sources, 3) green gas, 4) Dutch and hybrid heat pumps.
natural gas, 5) imported natural gas, 6) oil and 7) coal.
Ladder of seven
10Number of offshore installations that reach cease 1
of production - worst and best case scenarios
150
Number of offshore installations
100
50
0
2016 2024 2032 2040 2048 2056
EUR 0.125/m and reserves only
3
EUR 0.25/m3 and maturation of all resources
However, the Dutch gas industry faces many low, a significant number of platforms and facilities
challenges. Earthquakes in Groningen and damage will operate at a loss and will risk being decommis-
due to gas production from the Groningen field lead sioned at rather short notice. Once the infrastruc-
to concerns of safety. Concern is also being expressed ture has been removed, the associated resources can
about small field exploration and production pro never be economically developed and could be lost
jects. NOGEPA is currently working on a code of forever, even if gas prices would rise in the future.
conduct to improve stakeholder engagement by
operators active in the Netherlands. The current The major impact of trends in gas price and resource
situation regarding financial investments in explo- maturation on the viability of the offshore infra-
ration and production in the Netherlands is rather structure is illustrated in Figure 1 , which was
bleak. In 2015 and 2016 the average gas price fell published in Focus 2016. The difference between the
significantly, causing a drop in investments. Main- worst and best case scenarios is approximately
taining high investment levels, is important to 100 bcm of reserve maturation, which has a signifi-
ensure sufficient resource maturation and reserve cant impact on the COP (cessation of production)
replacement and, consequently, to guarantee future dates and remaining asset life. Dismantling the
production levels. Furthermore, if gas prices remain infrastructure too rapidly will limit the options for
using O&G infrastructure to support the transition
to a sustainable energy system. Furthermore, this
could negatively impact the cost effectiveness of
The Dutch gas sector intrinsically bears a decommissioning infrastructure, as dismantling
responsibility to adapt to New Energy realities. activities will face more time pressure. On the other
To start a dialogue with stakeholders based on hand, the low gas price environment has sharpened
transparency and facts, EBN has developed an the focus on reducing unit OPEX levels. In 2016,
energy infographic as shown on the inside front several operators succeeded in reducing these costs,
cover. Created from publicly available data from thereby improving the likelihood of production
renowned institutes, the graphic accurately remaining economically viable in the future. The
depicts the role of energy sources in Dutch end recent dramatic fall in rig rates, coupled with the
use and the relation to energy production in the introduction of innovative investment solutions,
Netherlands. has opened up opportunities for new developments
against lower costs. In order to be able to maintain
11Our Dutch Gas Return to Nature New Energy
EBN creates value and facilitates the transition to a sustainable energy system
Based on the developments in the upstream O&G industry described in this chapter, as well as those in the
energy policy arena, EBN has honed its strategy to accommodate the changing context. EBN focuses
on creating value from geological resources in a safe, sustainable and economically sound manner. This
strategy has three main pillars: optimal usage of Dutch gas resources (‘Our Dutch Gas’); taking control of
the decommissioning challenge (‘Return to Nature’); and strengthening, improving and developing geo-
thermal energy (‘New Energy’).
adequate production and maturation levels, it is to maximise the economic production of oil and gas
essential that the industry continues to focus on fur- in mature fields, and the dynamics and potential of
ther cost reduction, and on supporting technical and the offshore infrastructure are presented in Chapter 5.
innovative solutions and knowledge sharing. These first chapters together represent ‘Our Dutch
Gas’. The objectives and activities of decommission-
This edition of Focus elaborates on several develop- ing and re-use are illustrated in Chapter 6, and
ments and activities that facilitate EBN’s strategy. represent ‘Return to Nature’. Furthermore, ‘geo-
In Chapter 2 the reserves and resources are described, energy’ is represented by Chapter 7: Developments
as well as current activities and the related econom- and challenges regarding geo-energy from the
ics. The results of exploration studies regarding Dutch subsurface. Finally, Chapter 8 describes EBN’s
promising Dutch prospects are illustrated in research, development and innovation activities.
Chapter 3. Chapter 4 focuses on techniques available
Groningen production
The merits of production from the Groningen field have been overshadowed by induced seismicity,
which has had a major impact on the day-to-day lives of many inhabitants of the area. Since 2013, the
Dutch government has focused on reducing the yearly production level and has been pursuing safer
production methods as well as damage control and compensation.
Over the last few years, production has decreased significantly and fluctuations in production have
been removed. EBN developed a variety of activities to contribute to a safer and improved production
plan of the Groningen field, in line with its mission and the policy of the Minister of Economic Affairs.
Several studies focused at contributing to a better understanding of the processes in the subsurface
around the earthquake-prone area. This work complements the investigations carried out by NAM and
other parties such as State Supervision of Mines and KNMI. See Chapter 8 for more information on
these studies.
1213
The energy supply
of the future
Interview with Diederik Samsom,
former leader of the Dutch Labour
Party (Partij van de Arbeid)

After graduating from Delft University of Tech-             I think so – and even before 2050 – but maybe
nology with a degree in physics, specialising in            I’m somewhat optimistic. Policymakers usually
nuclear physics, Diederik Samsom worked for                 tend not to want to outline exactly what the energy
Greenpeace and was director of the Dutch energy             mix would look like, but now we are able to sketch
supplier Echte Energie (now Greenchoice). From              out clearly what will happen. First, we’ll have
2003 to 2016 he was a member of the Dutch House             about 35 gigawatts (GW) from offshore wind.
of Representatives; from 2012 to 2016 he was par-           We currently aim for 6 GW offshore wind in the
liamentary leader of the Dutch Labour Party.                Netherlands. The amount of wind parks should
During his time in the House of Representatives             increase to 35 at sea and six to eight on land.
he was very involved in energy issues.                      Further, I think that solar energy will supply up to
                                                            60 GW in 2050. That’s bizarrely massive – in
What sparked your interest in the energy                    total, enough for the entire built-up environment.
sector?                                                     As well as this we still need to have over 6 GW of
I was 15 years old when the Chernobyl nuclear               energy from geothermal sources to meet the total
disaster occurred. In the Netherlands we didn’t             demand for heat. It’s important to develop ultra-
actually suffer much from this disaster, but the            deep geothermal energy quickly, particularly for
dramatic event was my wake-up call. From that               industrial purposes. There would then be a system
moment on, I knew that everything had to be dif-            running on geothermal energy, a fairly stable
ferent – that if we didn’t change our energy sys-           source, and on sun and wind, both of which are
tem, things would go wrong for planet earth. And            not stable. As a back-up system for the lon-
then when I read Thea Beckman’s book Kinderen               ger-term variations, power-to-gas is needed:
van Moeder Aarde (Children of Mother Earth)                 about 4 GW. Finally, we need green gas made from
I knew for sure that I wanted to work for Green-            biomass: about 25 GW. Green gas is needed not
peace, to do my bit. In the years that followed, the        just for energy but also as a new renewable feed-
energy question dogged me.                                  stock for the chemical industry.

Together with Jesse Klaver (currently leader                Our energy supply currently consists of
of the Green Left party) you submitted a                    about 75% oil and gas, 17% coal and 3 – 4%
proposal for a climate Act that would help                  renewables. What exactly needs to happen to
attain a completely sustainable energy mix                  achieve a sustainable energy mix by 2050?
in the Netherlands by 2050. Is such an                      I think that in 2050, gas will no longer be extracted
energy supply attainable?                                   in the Netherlands. Offshore wind energy and

                                                       14
© Tessa Posthuma de Boer
solar energy are relatively simple, because we’ve public issues involved. That’s exactly why EBN
already made good progress here. Geothermal has such a pivotal role to play. EBN can represent
energy is a bit more complicated, but the biggest the public interest and act like a catalyst by co-
challenge is green gas. Transitioning our entire investing and contributing knowledge and expe-
economy will also be a big job. We need to speed rience. That’s EBN’s strength. Geothermal energy
up the current transition. Regarding geothermal will be EBN’s new pillar, but EBN should also play
energy, we need to ensure that before 2025 it’s in a role in gas storage. The gas that’s converted
the same situation as offshore wind is now: with power-to-gas for the energy sector as well
(almost) unsubsidised, with a network that we as as the chemical industry will have to be trans-
a society have paid for. The big challenge is to ported and stored and the gas that’s co-produced
develop a new model in which production, trans- with geothermal energy will have to be processed.
port and delivery are linked to each other. Gasunie I hope that in the future, storage of CO2 will not be
should transform itself from a gas mover into a necessary and that all captured CO2 can be used.
heat mover, and EBN from an oil and gas driller to But I think that to drastically reduce CO2 emis-
a geothermal driller. sions and achieve negative emissions, storage will
be necessary.
So you see EBN as having a clear role
in the transition to a sustainable energy What are you yourself going to
mix? contribute to this sustainable future?
Yes, I advocated this years ago. I foresee EBN My wake-up call when I was 15 will always play a
being given the statutory mandate to participate role in my life. So I’ll also carry on fighting for a
wherever energy is obtained or stored in the sub- sustainable energy supply. In what form I don’t
surface. This should result in EBN participating in know for sure yet, but my ambition is to leave the
at least as many projects as it does now in the oil next generation an earth as beautiful as the one
and gas sector. Of course, wells will have to be we found.
drilled for this and, as with all drilling, there are
15EXPLORATION AND PRODUCTION
GAS STORAGE OF OIL AND GAS FIELDS, BOTH
ONSHORE AND OFFSHORE
16Our
Dutch Gas
The Netherlands still possesses a considerable potential of oil
and gas reserves and resources. Exploration and production in
a cost-efficient and safe and sustainable way is continuing to
provide the necessary energy from hydrocarbons during the
energy transition. Whenever sustainable alternatives are
insufficient, Dutch gas will remain the most preferred option.
EBN will continue to encourage the oil and gas industry to
innovate and develop new knowledge, and to urge its partners
to improve sustainability performance.
1718
Reserves,
  resources,
             2
 production

             Reserves, resources, production & economics
& economics

     19
A
ll the on- and offshore fields in volumes were transferred to contingent resources.
the Netherlands except for the giant The contingent resource base increased by 2 bcm to
Groningen field are referred to as “small 181 bcm, which still has high potential for recovery.
gas fields”. These fields continue to be These volumes are either not technically mature yet
the core of the Dutch O&G industry. In this chapter, or are currently not economically attractive.
the status of the small fields portfolio is evaluated.
Small gas field production has been declining for In 2016, the gas price in the Netherlands reached its
over a decade. EBN believes that if investment levels lowest value since 2010. In this challenging com-
pick up again, this decline can be slowed down or mercial environment, many projects were being
even halted. The project portfolio of opportunities delayed. This decrease in price, however, sparked a
identified in or near fields is still rich, as is the pressure on costs. Under current conditions, several
potential for exploration in underexplored plays or of the opportunities in the contingent resource
near the established margins of the known gas plays portfolio are therefore still as attractive as they were
(Chapter 3). before the downturn in the industry. EBN foresees
more gas field developments over the next few
2.1 Reserves and contingent resources years. EBN’s focus to stimulate future O&G develop-
In 2016, the industry was largely influenced by falling ments will be on five themes:
O&G prices. The gas price declined gradually and is 1. Sharing knowledge to contribute to reducing
now half the price in 2012. The lower gas prices have CAPEX and OPEX;
affected EBN’s reserve base. At the end of 2016, the 2. Reducing the time lag on project start-up;
total developed reserves from small fields in which 3. Selecting high-ranking exploration areas;
EBN is participating were 117.1 bcm, compared to 4. Supporting technological and innovative solutions;
143.4 bcm at the end of 2015 (Figure 1 ). Total gas 5. Contributing to the energy transition by stimula
production from small fields was 20.6 bcm in 2016. ting synergies within the energy industry.
In 2016, far fewer projects matured than in the pre-
vious year: only five gas fields were brought into 2.2 Maturation
production compared to 14 in 2015. A second reason Maturation is defined as the amount of known
for the reserve decline is that the tailend volumes of resources moving into the reserves category as a
some of the mature gas fields were evaluated as result of investments and planned projects. In 2016,
sub-economic at current gas prices, and so these the combined volumes of resources matured to
1 Reserves and resources from small fields
400
Reserves and resources (bcm GE)
350
300
250
203 201 191 179 181
200
150
100
172 166 159 143 117
50
0
2012 2013 2014 2015 2016
Reserves Contingent resources
20reserves plus reserves from new projects was around dropped in proportion to the decline in CAPEX. This
13.7 bcm, which is higher than in 2015 and thereby can be interpreted as being a direct result of lower
breaks a four-year decline (Figure 2 ). On the costs in the service, supply and construction indus-
downside, 4.4 bcm moved from reserves to the tries. Rig rates have also dropped considerably,
resource category, mainly as a result of project resulting in significantly decreased costs for drilling
cancel
lations or extended delays. This leads to a wells.
maturation figure of 9.3 bcm for all small fields in
2016, which is comparable to the 2015 figure. 2.3 Stranded fields and
prospective resources
However, there is also a large negative adjustment Stranded fields are gas discoveries for which no
of the recoverable reserves within producing fields. plans for development have been defined yet.
Due to the volatility of this category and the direct Obviously, the designation ‘stranded’ is not
dependence on gas price, EBN does not include these immutable, since options for developing such
volumes in the maturation numbers, but they do fields are often being revisited. In the analysis in
contribute to the adjusted reserve database, as can this chapter, EBN includes all stand-alone proven
be seen in Figure 2 . In years with good gas prices, gas accumulations that do not yet count as reserves.
less gas was expected to be left in the uneconomic The largest stranded gas resources are in the
tail-end of the production due to anticipated COP Rotliegend, the dominant play in the Netherlands.
dates further in the future. In 2016 however, the The expected ultimate recovery for these fields is
large downward revision of reserves in known fields small compared to their in-place volume; poor
was seen, primarily because of COP dates moving reservoir quality is one of the main reasons these
forward in time. These volumes, combined with fields have not yet been developed. Of the more
the loss of reserves due to cancelled or executed than 65 bcm of gas in place in the Rotliegend
projects, fully offset the amount of gas matured. stranded fields, currently only 25 bcm is expected
Figure 2.2 Reserves replacement 2016 to be recoverable (Figure 3 ). However, there is
With a total invested CAPEX of slightly less than significant scope for increasing these recoverable
EUR 600 million in 2016, investment was 50% of volumes by using optimised development concepts
that in 2015. Excluding COP date adjustments, it is for these types of fields, such as horizontal wells
encouraging that the level of maturation has not and reservoir stimulation technology (Chapter 4).
2
Changes in the status of reserves
40 1400
30 1200
Reserves (100% bcm GE)
1000 Reserves to resources
CAPEX (EUR million)
20
Maturation (resources to reserves)
800
10 Reserves added by new projects
600 Reserves revision in projects
and fields
0
400 Capex small gas fields
-10 200
-20 0
2012 2013 2014 2015 2016
213 4
Hydrocarbons initially in place and Hydrocarbons initially in place and
ultimate recoverable volumes ultimate recoverable volumes
in stranded fields in gas prospects
Risked cumulative volume (bcm GE)
Risked HCIIP of economically attractive prospects
300
Risked UR of economically attractive prospects
60
Cumulative volume (bcm GE)
250
50
200
40
Risked HCIIP of prospects
150
30
Total HCIIP of fields
100
Total UR of fields
20
50
10
0
0
Triassic
Zechstein
Rotliegend
Carboniferous
Other stratigraphies
Multiple
stratigraphies
North Sea Group
Cretaceous
Jurassic
Triassic
Zechstein
Rotliegend
Carboniferous
Hydrocarbons initially in place and
Each year EBN re-evaluates the prospective exploration opportunities, particularly when new
ultimate recoverable volumes
resources portfolio on the basis of expected future drilling locations are required.
in stranded A final reason is that
fields
gas prices and cost levels, resulting in a ranking in these figures, the expected economic lifetime of
60
based on likelihood of being economic. Analysis of the vital infrastructure through which the gas is to
Cumulative volume (bcm GE)
the prospective portfolio with respect to strati- be evacuated has not yet been taken into account.
50
graphic level clearly shows that the vast majority of Sometimes, exploration opportunities are not pur-
the volume is in the Rotliegend play (Figure 4 ). sued because of imminent COP dates, yet other
40
The full Rotliegend portfolio is expected to contain operators successfully manage to extend the COP
300 bcm (risked), of which over 250 bcm is expected dates of
30 their facilities by unlocking near-field
to be present in prospects with potential economic exploration opportunities.
Total HCIIP of fields
viability. In turn, 200 bcm could be recovered from 20 Total UR of fields
these prospects. The Triassic and Carboniferous 2.4 Industry activity
plays are expected to yield 30 to 40 bcm of risked Looking10at industry activity since 2000, it is clear
recoverable resources, considering only the econo that the total area covered by production licences
mically attractive prospects. 0
has remained relatively constant (Figure 5 ). This
Triassic
Zechstein
Rotliegend
Carboniferous
Other stratigraphies
Multiple
stratigraphies
is to be expected since many of the older licences
These substantial volumes are not reflected in the were granted for 40 years or even indefinitely. Con
number of exploration wells drilled in 2016 (section sequently, changes in total area licensed for produc-
3.1). There are three reasons for this. Firstly, most of tion are due to additions, rarely to relinquishments.
the individual prospects are small and their economic Recently, a duration of 25 years for production
development is attractive only if low-cost develop- licences has become the norm. Figure 5 shows that
ment alternatives are used; there is no room for cost for exploration licences there is more fluctuation
overruns or for finding low case volumes. Secondly, over time.
onshore operators are facing increasingly complex Statistical analysis reveals there is no significant
licensing trajectories, causing them to pursue fewer correlation between the total area of exploration
22Total licensed area (on- and offshore)
70
5 60 Total licensed area (on- and offshore)
60 240
50
Oil price (USD/bbl) / Rig rate (kUSD/d)
50 200
40
Licensed area (103 km2)
Km2 ('000)
40
30 160
20
30 120
10
20 80
0
10 40
2004
2006
2000
2008
2002
1994
1996
1990
1984
1986
1998
1980
1988
1992
2010
1982
2012
Rig rates halved since 0
Onshore XL Onshore PL
0
2000
2001
2002
2003
2004
2005
2006
2007
2008
2009
2010
2011
2012
2013
2014
2015
2016
2014, resulting in Offshore XL Offshore PL
25-30% reduction in Yearly avgexploration
Onshore Brent $/bbllicence Offshore exploration licence
Onshore production licence Offshore production licence
well costs per day Oil price (nominal) Rig rate (nominal)
6 Number of offshore
Number exploration
of offshorewells
wellsdrilled
drilledinand
the rig
Southern
rate North Sea
30
30 300
25
25 250
of wells wells
20
Rig rate (kUSD/d)
20 200
of exploration
15
15 150
licences and oil price or rig rate for the
Number
period 2000 – 2016, even when a delay 10
10 100
Number
(rig rate lagging oil price by one, two or
three years) is included. Also over a 5
5 50
longer period (1980 – 2016) such cor-
0
relation has not been found. Addition- 0 0
Figure 2.5 & 2.6 & 2.7 & 2.8 Expl_vs_km2_19
2000
2001
2002
2003
2004
2005
2006
2007
2008
2009
2010
2011
2012
2013
2014
2015
2016
2007
2008
2009
2010
2011
2012
2013
2014
2015
2016
ally, there is no clear correlation
between the number of exploration Netherlands UK SNS Denmark
Exploration Production
wells and rig rate or oil price (Figure 6 ).
Appraisal Rig rate (nominal)
Despite the halving of the rig rate since
2014, the decline in drilling effort in the
last three years is obvious, reflecting
7 Number of offshore exploration wells drilled in the Southern North Sea
budget cuts by nearly all operators.
30 Total licensed area (all XL’s)
Also, halving the rig rate does not halve
25
the well expenditures, and personnel 25
costs remain relatively high. Analysis of
Number of exploration wells
20
recent AFEs indicates that halving the 20
rig rates reduces total well cost per day by
15
25 – 30%.
Km2 ('000)
10
The tendency to cut down on explora- 10
tion projects is seen in other Southern 5
North Sea countries as well. As is shown 5
in Figure 7 , in Denmark no explora- 0
2000
2001
2002
2003
2004
2005
2006
2007
2008
2009
2010
2011
2012
2013
2014
2015
2016
tion wells were drilled at all in 2016. In 0
Netherlands UK SNS Denmark
23Figure 2.9 Wells - Duration - costs
Target Average offshore well duration per phase Average well costs 8
100
100
120
120
60
60
40
40
80
80
20
20
0
Jurassic and younger (dry well) 31 12 EUR 12 mln
Jurassic and younger (completed and tested) 31 21 EUR 16 mln
Lower Triassic and Zechstein (dry well) 46 14 EUR 13 mln
Lower Triassic and Zechstein (completed and tested) 46 31 EUR 20 mln
Rotliegend (dry well) 79 18 EUR 26 mln
Rotliegend (completed and tested) 79 39 EUR 31 mln
Rotliegend (stimulated wells) 106 65 EUR 55 mln
Carboniferous (dry well) 68 12 EUR 15 mln
Carboniferous (completed and tested) 68 33 EUR 26 mln
Days drilled to TD Days to complete and test
Days to abandon Days to complete, stimulate and test
total, 137 Target Average offshore
exploration wells were drilled in the well duration
by stage. per phase
Generally, Average well cost
the deeper the target, the longer
120 100 80 60 40 20 0 20 40 60 80 100 120
offshore Netherlands in the period 2000 – 2016, each individual stage takes. The figure shows that
Jurassic and younger (dry well) 31 12 EUR 12 mln
compared
Jurassic andto 91 (completed
younger in the and
UK Southern North Sea and
tested) the post-TD
31 (total
21 depth) time differs significantly.EUR 16 mln
For Rotliegend wells extra days related to stimulation is shown
47 in the Danish offshore. In this period the average The difference in days between a well that has been
Lower Triassic and Zechstein (dry well) 46 14 EUR 13 mln
amount of exploration wells in the Netherlands was
Lower Triassic and Zechstein (completed and tested)
plugged
46
and abandoned
31
and a completed well with aEUR 20 mln
8.1 wells/year, compared to 5.4 wells/year in the UK Jurassic or younger target is ten days, whereas this
Rotliegend (dry well) 79 18 EUR 26 mln
and 2.8 wells/year in Denmark. These numbers have difference increases to 20 days for a Rotliegend
Rotliegend (completed and tested) 79 39 EUR 31 mln
dropped considerably for the UK and Denmark when well. Interestingly, all individual stages for a well
Rotliegend (stimulated wells) 106 65
compared to the average of last five years (both with a Carboniferous target are on average shorterEUR 55 mln
2.2 wells/year), Carboniferous
whereas(dry the
well)amount of wells drilled than
68 for a Rotliegend
12 well, a result of the fact thatEUR 15 mln
in the Netherlands has remained fairly constant Carboniferous (completed and tested)
many
68
very complex
33
wells drilled in the past had aEUR 26 mln
with 7.8 wells/year. days to drill to TD Rotliegend
days to complete and test target.
daysFor Rotliegend
to complete, wells,
stimulate and teststimulation
days to abandon
activities have been added as an extra stage. A well
2.5 Drilling costs with an additional fracking job requires 54 more days
Figure 2.10 General_4_-_Production_Forecast
Well costs are largely governed by depth, technical than an average Rotliegend well that has not been
complexity and rig rates. Figure 8 shows the aver- fracked. Half of this extra time is due to complexity
age total rig time and total costs for all offshore related to long horizontal sections in the trajectory.
wells drilled in the last ten years. The data is split The remaining extra days are needed for a relatively
9
Small field production vs. gas price
Small Fields Gas Production* (bcm/year GE)
35 30
30
25
Gas price (EUR/MWh)
25
20
20
15
10 Production
15
Gas price
5
* From fields with
0 10 EBN participation
2009
2010
2011
2012
2013
2014
2015
2016
2410
Small field historic gas production and forecast
40
Production* (risked, bcm/year GE)
30
20
Reserves
Resources
10
Prospects
*From fields with
EBN participation 0
2010 2015 2020 2025 2030
Figure 2.10 General_4_-_Production_Forecast
long cleaning up and testing period after the actual tion and the production forecast based on EBN’s
fracking job. Both factors also partly account for the reserve and resource database. The volumes shown
increased cost of these wells, as do the costs of the are regarded as the business-as-usual setting, the
fracking job itself. The resulting extra costs are most likely scenario if the industry continues to drill
substantial, yet these are more than compensated for and develop its portfolio in the same pace as in pre-
by the incremental flow rates, as is explained in vious years. However, EBN sees potential for an
Section 4.2. Smallupside
field historic gas production
scenario and forecast
from enhanced activities such as
40
bcm/year GE)
exploration, increased recovery, tight gas develop-
Small field production forecast
2.6 Production 30 ment and infrastructure optimisation as described in
30
Figure 9 shows small field gas production vs. gas Chapters 3 – 5. These volumes are shown in Figure 11 .
25
(risked,GE)
price between 2009 – 2016. In 2016, gas production It also includes resources that could follow from
(bcm/year
from small fieldsReserves 20which is 8%
was 20.6 bcm (100%),
20 collaboration concepts within the energy industry
less than in 2015, when 22.4 bcm was produced. In such as gas-to-power, CCUS and geothermal dual-
Resources
15
Production*
the last eight years, a decline in production
10 of 6 – play concepts, although this upside is difficult to
Prospects
Production*
Business as usual
11% per year has been observed, with 10
the exception quantify. EBN’s upside is a growth scenario that is
*From fields with
EBN upside
of 2012 and 2013 when
EBN the decline was0 2 – 3%. In
participation not part of EBN’s reserves and resource database. In
5
those years, the*From
gas price was historically the2010
fields with high- 2015 this may2020
total, add some 150 2025 2030
bcm until 2050. This will
EBN participation
est. It is not unrealistic to expect that0the 4 – 6% enable production to be maintained above 20 bcm/
2010
drop in production will be offset by a favourable 2015 2020 six to seven
year for the next 2025years, depending
2030 on
trend in gas prices in the future. how fast innovative concepts will be implemented
and how quickly the gas price will recover. The (infill)
EBN aims to stabilise the gas production from small potential of remaining reserves and contingent
fields at current production level. It is expected that resources is still high and rewarding. It is vital to
annual production will remain slightly below 20 bcm continue exploration and drilling activities to main-
in coming years. Figure 10 shows historical produc- tain the production levels in the small field portfolio.
11
Small field production forecast
30
25
Production* (bcm/year GE)
20
15
Business as usual
10
EBN upside
5
*From fields with
EBN participation
0
2010 2015 2020 2025 2030
25Figure 2.13 & 2.14 graphs TLE
12
Technical and economic recovery factor against field size
30 100%
90%
85% 84% 90%
25 79% 22,78
23,15 21,04 80%
70% 20,46
Volume (bcm GE)
70%
20
60%
15 50%
40%
10 9,24
28,7%
8,28 30%
7,21 6,98
21,9% 5,47 20%
5 4,80 4,24
4,05
2,97 12,4%
10,84% 2,32 1,94 1,82 10,4% 10%
0,79 0,56 0,42 0,37 1,6%
6,11% 4,52% 3,13% 2,74%
0 0%
Very small fields (121) Small fields (80) Medium sized fields (24) Large fields (43) Very large fields (18)
[10 bcm]
Average static GIIP Average dynamic GIIP Average UR techniocal Average UR economic
Expected ultimate % of technical UR wich Relative GIIP gap
recovery factor is uneconomic
2.7 Recovery factor from very small fields (10 bcm). The
100%GIIP gap shown in the figure is the
by using various factors, one being the impact of field volume of gas90%that is not drainable by the current
120
size on production characteristics (Figure 12 ). The wells but is 80%
assumed to be present.
factor100
refers to the technically recoverable volume
70%
from existing wells over the dynamic GIIP (Gas Ini- It is important to keep in mind that the distribution
80 60%
tially in Place) at the end of the field’s life. The assets of fields is skewed: 20% of the total volume is present
50%
included
60 in the analysis are the on- and offshore in 70% of the smaller fields. In comparison, the fields
40%
small fields in production in 2016 with EBN as a with a volume larger than 10 bcm represent some
40 30%
partner. These assets have been classified into five 40% of the total portfolio’s recoverable volume. A
20%
groups20 Figure 2.13 clear relation between field size and performance is
by technically recoverable volume, ranging
10%
0 0%
13 #Fields Expected Ultimate Recovery Factor
Expected recovery factor
North Sea Group #Fields 3
Lower Cretaceous #Fields 8
Scruff Group #Fields 2
Upper Triassic Group #Fields 41 +- 1 stand dev
Lower Triassic Group #Fields 12
Zechstein Group #Fields 11
Rotliegend Group #Fields 152
Carboniferous #Fields 312
0% 10% 20% 30% 40% 50% 60% 70% 80% 90% 100%
Expected recovery factor
26Figure 2.15 production and investment levels of the small fields
Experience and knowledge greatly contribute to maximising field
recovery, emphasising40 the urge for industry cooperation
30
visible: larger fields yield higher recovery factors, following the low gas price environment. The low
Reserves (bcm GE)
20
show a lower relative GIIP gap and have a smaller prices have made the industry reluctant to invest in
segment of technically recoverable volume
10 that is new projects. Since the low point of the gas price in
sub-economic. The main reason for this is that larger April 2016, actual gas prices have upturned. However,
0
fields justify higher CAPEX due to larger expected it is not expected that investments will recover to their
revenues; investments such as higher compressor previous level in 2017, because most O&G projects have
-10
stages and end of field life (EoFL) measures increase long lead times. In the longer run, however, it may be
the recovery factor (red line) significantly
-20
compared expected that annual investment levels of some EUR
2012 2013 2014
to regular reservoir depletion. 700 million to EUR 12015
billion are 2016
regained, depending
Reserves to resources Reserves revision in projects (*)
on futureMaturation
Reserves added by new projects gas price developments. A recovery of the
Not only the field size, but also the stratigraphy is key investments is crucial to maintain adequate resource
for a field’s ultimate recovery factor. In Figure 13 the maturation and production levels.
average ultimate recovery factor per stratigraphic
group is depicted, excluding the 19 fields producing Figure 15 shows revenues, costs and profits that are
from multiple stratigraphies. It shows30
that the larger associated with exploration and production from
the number of fields producing from a certain forma- small fields on- and offshore in 2012 – 2016. The net
tion, the higher the recovery factor. This
20 reflects that profit margin has declined sharply, but has remained
experience and knowledge greatly contribute to max- positive. This decline is mainly the result of the
Reserves (bcm GE)
10
imising field recovery, emphasising the urge for low average gas price in 2016, which dropped
industry cooperation. For all stratigra
phies with from just below EUR 0.20/Nm3 in 2015 to just above
0
more than ten fields, error bars depicting one EUR 0.13/Nm3 in 2016. Furthermore, the figure shows
standard deviation have been included.
-10 This reveals that finding costs, largely based on geology and
that the Carboniferous shows large uncertainty in geophysics costs (e.g. seismic surveys and dry explo-
recovery factor, as is to be expected -20
from this highly ration wells), have decreased slightly since 2015.
heterogeneous stratigraphic interval. This is mainly due to the reductions in general
-30
2012 activities2014
2013 and investment
2015 level as described above.
2.8 Economics Production (left axis)
Depreciation is shown on a unit-of-production
Reserves replacement
Figure 14 shows the investment level in small fields, basis, including depreciation over successful explo-
which has dropped significantly over the last years ration wells that have been capitalised in the balance
14
Production and investment levels
30 1600
1400
25
Investments (EUR million)
Production* (bcm GE)
1200
20
1000
15 800
600
10
400
5
200
0 0
2012 2013 2014 2015 2016
Production Investments * From fields with EBN participation
27Figure 2.16 profit margins small fields
15
Costs and profit margins of small field production
0.30 Based on current gas price
0.25
developments and expected
decreasing unit OPEX, profit
Price (EUR/Nm3)
0.20
margins are expected to
0.15 recover in 2017
0.10
0.05
0
2012 2013 2014 2015 2016
Finding costs Production costs Net profit
Depreciation Taxes
Figure 2.17 _ 2.18 opex production uoc offshor
sheet and excluding any accelerated depreciation. cost-cutting. For 2017, a further reduction of OPEX is
Production costs are the operating costs in the fig- expected, in response to a continuing decline in
ure. The unit OPEX has stabilised since 2014 at production and more focus on reducing costs.
Offshore production vs. OPEX
around EUR 0.06/Nm , which means that in the last
3
25 1200
few years the industry has been able to lower OPEX to Driven by a low gas price environment, operators are
compensate for the decreasing production volumes. increasingly 1000
20 focused on reducing OPEX. As a result,
Production (bcm GE)
OPEX (EUR million)
OPEX is analysed further below. Based on the current the unit OPEX has decreased for offshore gas fields 800
gas price developments and expected decreasing 15 two years (Figure
in the last 17 ). The significant
600
production costs per Nm3, profit margins are increase in the years before 2014 has clearly been
10
expected to recover in 2017. halted, which is a welcome development, as bringing 400
down the unit OPEX is essential for maintaining
5
200
Figure 16 shows the production level versus OPEX adequate profit margins and assuring an economi-
for small fields, offshore only. Production from these cally viable
0 future for O&G production activities. 0
gas fields is steadily declining, as explained earlier. Lower OPEX is2012 2013 to 2014
also likely 2015window
extend the 2016
Production OPEX
However, since 2014, offshore OPEX has also been of opportunity that the infrastructure can offer
declining and this trend continued in 2015 and 2016. with respect to gas production, the potential for
It is attributable not only to the lower production re-using the infrastructure and a cost-effective
Figure
levels, but 2.17
also _to
2.18
theopex production
industry’s uocfocus
greater offshore
on gas decommissioning.
16 17
Offshore production vs. OPEX Unit OPEX (offshore)
25 1200 0.08
0.07
1000
Unit OPEX (EUR/Nm3 GE)
20
Production (bcm GE)
0.06
OPEX (EUR million)
800
15 0.05
600 0.04
10 0.03
400
0.02
5
200
0.01
0 0 0
2012 2013 2014 2015 2016 2012 2013 2014 2015 2016
Production OPEX
28You can also read