FRAMED: Data-Driven Structural Performance Analysis of Community-Designed Bicycle Frames - arXiv
←
→
Page content transcription
If your browser does not render page correctly, please read the page content below
FRAMED: Data-Driven Structural
arXiv:2201.10459v1 [cs.LG] 25 Jan 2022

                                         Performance Analysis of Community-Designed
                                                       Bicycle Frames
                                                   Lyle Regenwetter, Colin Weaver, Faez Ahmed
                                                       Massachusetts Institute of Technology
                                                    Email: {regenwet, weaverc, faez}@mit.edu,

                                                                            Abstract
                                                  This paper presents a data-driven analysis of the structural per-
                                              formance of 4500 community-designed bicycle frames. We present
                                              FRAMED — a parametric dataset of bicycle frames based on bi-
                                              cycles designed by bicycle practitioners from across the world. To
                                              support our data-driven approach, we also provide a dataset of struc-
                                              tural performance values such as weight, displacements under load,
                                              and safety factors for all the bicycle frame designs. By exploring
                                              a diverse design space of frame design parameters and a set of ten
                                              competing design objectives, we present an automated way to an-
                                              alyze the structural performance of bicycle frames. Our structural
                                              simulations are validated against physical experimentation on bicycle
                                              frames. Through our analysis, we highlight overall trends in bicycle
                                              frame designs created by community members, study several bicycle
                                              frames under different loading conditions, identify non-dominated de-
                                              sign candidates that perform well on multiple objectives, and explore
                                              correlations between structural objectives. Our analysis shows that
                                              over 75% of bicycle frames created by community members are in-
                                              feasible, motivating the need for AI agents to support humans in de-
                                              signing bicycles. This work aims to simultaneously serve researchers
                                              focusing on bicycle design as well as researchers focusing on the de-
                                              velopment of data-driven design algorithms, such as surrogate models
                                              and Deep Generative Methods. The dataset and code are provided
                                              at http://decode.mit.edu/projects/framed/.

                                         1   Introduction
                                         The bicycle is one of the most ubiquitous consumer products in our modern
                                         society. Despite this fact, making bicycles accessible to more people has nu-

                                                                               1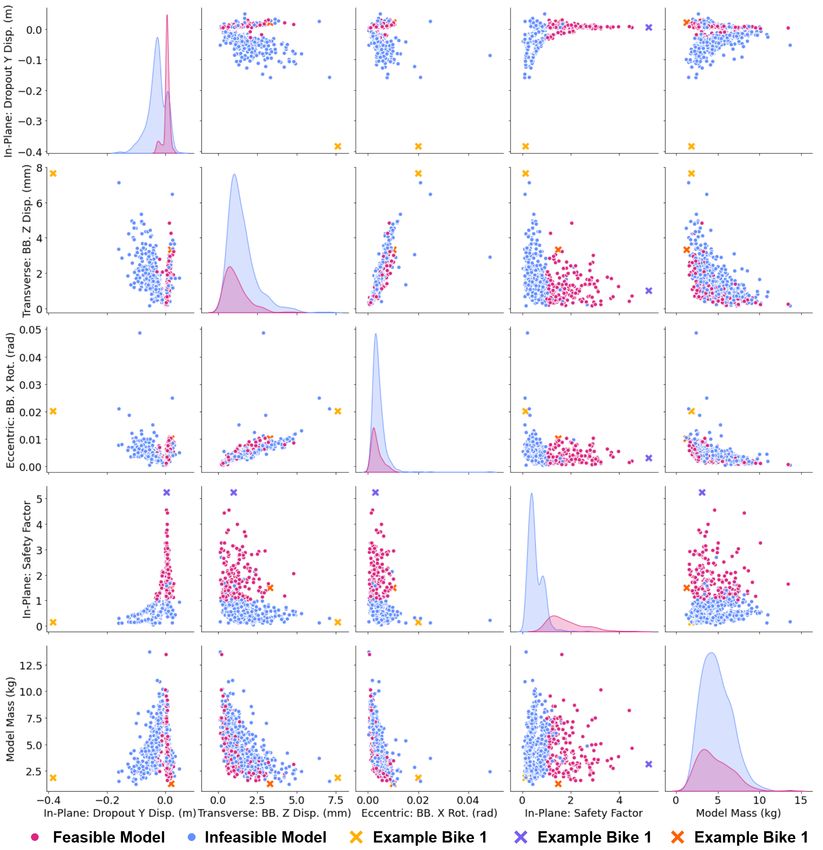
2                                    L. Regenwetter, C. Weaver, F. Ahmed

merous societal benefits, such as boosting public health [1], mitigating traf-
fic congestion [2], and reducing emissions [3]. These tantalizing prospects
provide ample motivation to improve accessibility to bicycles and to im-
prove their performance to increase appeal. With some estimates putting
the number of privately owned bicycles at over 580 million [4], even in-
cremental improvements in bicycle design methodology would undoubtedly
have an immense impact.
    One strategy to improve bicycle accessibility and ridership is to harness
data-driven methods to accelerate the design process of customized bicycle
frames, making them faster and cheaper to acquire. Data-driven methods
have shown great promise in accelerating design tasks and enabling design
automation across countless design domains. Data-driven approaches to
design can tap into the immeasurable expertise captured within existing
designs ranging from products on the market to rough prototypes to early-
stage design concepts. Designers can leverage design principles implicitly
embedded in quality data to accelerate their own design process. Addition-
ally, tools like surrogate models trained on design data can help designers
rapidly evaluate early stage design concepts without the need for expensive
and time-consuming simulation or physical experimentation. The availabil-
ity of quality data is an incredible asset in any design domain, and we aim
to introduce and leverage this data for the bicycle frame design task.
    In this paper, we pursue a data-driven approach to bicycle frame de-
sign and optimization. The key contributions of this work are summarized
below:

    • We introduce a dataset of 4500 bicycle frames inspired by bicycles
      designed by community members using the BikeCAD software. This
      dataset consists of a set of 37 design parameters for each frame and
      an associated 3D model for all frames that are geometrically valid.

    • We provide a corresponding dataset of ten structural performance val-
      ues under three load cases (in-plane, transverse, and eccentric loading)
      for each frame, consisting of seven deflections, two safety factors, and
      a weight value.

    • We validate our structural simulations against results from physical
      testing of bicycle frames and show that our simulation results corre-
      late with existing studies. We also validate our finite element mesh
      resolution with a mesh convergence study.

    • We carry an in-depth exploration of bicycle design and performance
      data — We identify general trends, study several interesting frame
      designs in detail, identify a Pareto front of non-dominated designs,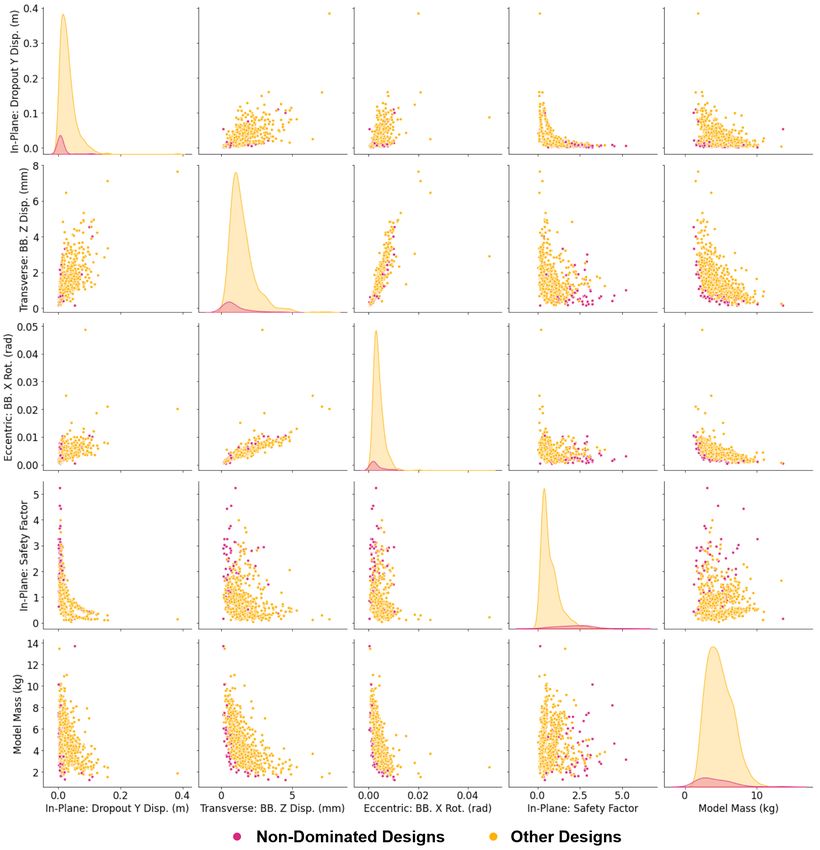
FRAMED: Data-Driven Structural Performance Analysis of
Community-Designed Bicycle Frames                                             3

      and explore correlations between design parameters and performance
      values.

2   Structural Optimization of Bicycles Frames
Structural considerations of a bicycle frame, such as geometry, material,
and size can drastically affect the rider experience. Typically, designers
attempt to minimize weight and cost of the frame, but removing too much
material could mean increasing the likelihood of the bicycle frame to fail
under pressure, decreasing the power transfer of pedaling into forward ac-
celeration, or amplifying the nerve damaging effects of vibrations in intense
bicycle riding.
    Since the inception of bicycles in the 1800s, people have sought to better
understand how they work and how they can be improved upon. Recent
studies [5, 6] have taken this search for an optimized bicycle to new extents
through in depth analysis of what physical features of a bicycle are most
influential to the rider experience. In general, it is important for a bicy-
cle to be lightweight to allow fast acceleration and maneuverability, strong
enough to resist failure under heavy loading, and to have a high stiffness to
maximize the power transfer of pedaling into acceleration. These conflict-
ing objectives are not always intuitive to understand, nor are they easily
maximized.
    Simulation of bicycle frames provides useful insight into how the rider
experience can be improved. One of the earlier attempts at simulating the
effects of varying loads on a bicycle frame Soden et al. [7] uses finite element
analysis (FEA) and a representation of a bicycle frame as a set of linear
beams connected at a series of nodes to predict the deflections a frame might
see under different riding conditions. Since then, with the development of
advanced CAD software and exponential growth in computational power,
researchers have been able to represent more complex geometries [8], de-
velop more accurate estimates for stresses in bicycle frames [9], and perform
in-depth analysis of bicycle frame material selection [10].
    Several studies have expanded on bicycle frame simulation with data
driven approaches to structural optimization of bicycles. For example,
Cung & Lee [11] simulate nearly 400 combinations of parameters for the 4
main tubes in the bicycle frame and their dimensions. They use these sim-
ulations to fit a model that determines the significance of each parameter
in changing the structure of the bicycle frame. Cheng et al. [12] use FEA
to optimize the bicycle frame by simulating drop frame testing. Their work
aims to minimize the permanent deflection a bicycle frame experiences af-
ter drop frame testing while also minimizing the weight of the frame using
compromise programming. Other studies seek to optimize the bicycle frame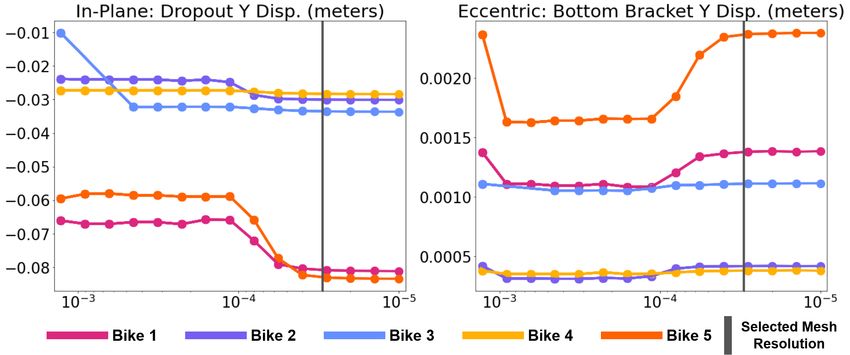
4                                     L. Regenwetter, C. Weaver, F. Ahmed

by changing bicycle geometry. Lin et al. [13] creates a model that mini-
mizes the deflection a frame experiences under various loading conditions by
changing the angles that different tubes meet each other at. Covill et al. [14]
fits a regression model to capture how influential parameters affect bicycle
frame deflection after simulating loading cases on 82 frames.
    Existing work at the intersection of numerical simulation and data-
driven design for structural optimization of bicycles has shown great po-
tential and paved the way for data-driven design to improve the rider ex-
perience. However, existing work has a few gaps — the designs considered
are not based on real-bikes created by framebuilders and enthusiasts, they
are limited in size by the number of bikes simulated, no large-scale publicly
available bicycle frame dataset exists, and often the studies are limited to
a small set of design parameters and load cases. To overcome these issues,
FRAMED has the following advantages:

    • We consider a significantly larger design space, parameterizing the
      bicycle frame across 37 parameters

    • We simulate bicycle frame models that are slightly modified from a
      collection of real bicycle designs, most of which are created by frame-
      builders and enthusiasts.

    • We simulate over 4500 bicycle frame models, considerably more than
      previous data-driven design studies and release our dataset publicly
      for other researchers to use standardized loading conditions and datasets
      for data-driven design.

3    Methodology
In this section, we discuss the various methodology decisions behind the
dataset including design parameterization, modeling, analysis of geometric
feasibility, load cases, material selection, and meshing.

Parameterization and Modeling
We utilize a dataset named BIKED [15], which comprised of 4500 indi-
vidually designed bicycle models sourced from hundreds of designers on
the BIKECAD software. The BIKED dataset contains over 1300 design
parameters, of which we identified 200 parameters that directly relate to
the bicycle frame. To reduce the design space and ensure that 3D models
can be reliably built from these design parameters, we make several key
simplifications to these bicycle frame models:
FRAMED: Data-Driven Structural Performance Analysis of
Community-Designed Bicycle Frames 5
Table 1: Summary of parameters used to dictate the bicycle frame design
space
Parameter Type Data Type Count
Frame Geometry Relations Continuous 18
Tube Outer Diameters Continuous 9
Tube Thicknesses Continuous 7
Frame Material Categorical 1
Seat/Chain Stay Bridge Flags Boolean 2
Total 37
1. We only consider the “diamond” frame bicycle frame topology.
2. We assume all tubes have constant cross section and are straight
3. We do not consider rounded junctions or fillets at the intersections of
tubes
These simplifications allow us to simplify the design space to 37 param-
eters. Most of these parameters are taken directly from BIKED, while a
few are calculated deterministically by combining multiple BIKED design
parameters. These 37 parameters can roughly be broken down into several
groups, such as tube diameters, tube thicknesses, and dimensions of the
high-level frame geometry. Additionally, we maintain two parameters from
BIKED which serve as boolean flags indicating whether or not the frame
has chain stay or seat stay bridges (bridges are crosspieces between the
stays that add support). Finally, we use a single material parameter, which
is discussed in more detail below in Section 3. A summary of the param-
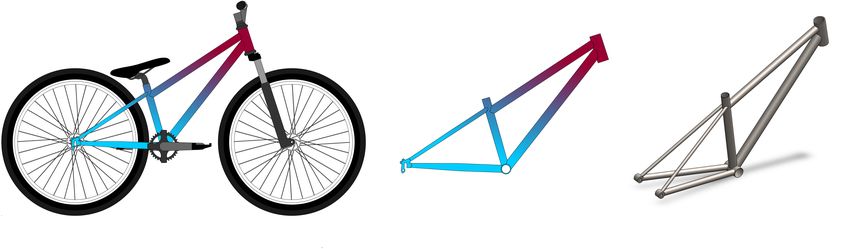
eter types is included in Table 1. A side-by-side comparison of an original
BIKED bicycle model, the same BIKED model with the frame isolated,
and the corresponding 3D model generated based on this BIKED model is
shown in Figure 1.
One of the key limitations acknowledged by BIKED’s authors is the
limited diversity present in certain design parameters, largely due to pe-
culiarities stemming from the BikeCAD software from which designs were
sourced. BikeCAD has no 3D modeling feature or inbuilt simulation ca-
pabilities, so many parameters adding “depth” to the model are largely
irrelevant in BikeCAD designs. This issue is especially pronounced in the
tube thicknesses, with over 99% of all models having the same tube thick-
ness values. To promote diversity of our dataset, we manually override the
seven tube thicknesses parameters with randomly sampled thicknesses. We
sample a 7D vector from a Sobol sequence, then logarithmically scale these
vectors in an element wise fashion to a range of 0.5-10 mm. The resulting6 L. Regenwetter, C. Weaver, F. Ahmed
Figure 1: Side-by-side comparison of full bicycle, frame, and 3D model.
Figure 2: Different views of example bicycle frame model.
bike models’ seven tube thickness values randomly lie between 0.5 and 10
mm, with a bias towards thinner tubes.
Using these parameters, we create an adaptive 3D bicycle frame model
which automatically builds itself based on predefined geometric formulas,
taking our 37 parameters as input variables. Figure 2 shows several views of
the frame model after building itself using a set of parameters corresponding
to a conventional road bike.
Geometric Feasibility
Our 37 variable parameterization makes for a diverse design space, but also
introduces possibilities for infeasible combinations of parameters. To avoid
geometrically infeasible models, we implement a list of geometric “checks.”
A few of these checks are listed below:
• Tube thicknesses, diameters, and lengths must be positiveFRAMED: Data-Driven Structural Performance Analysis of
Community-Designed Bicycle Frames 7
• Seat stays and chain stays must intersect with the seat tube and
bottom bracket respectively.
• Head tube and seat tube angles are between 0 and 180 degrees.
We find that 219 of 4512 of BIKED’s models fail these explicit feasibility
checks. Despite these checks, 97 bicycle models still fail to build correctly
when the parameters are fed into the adaptive 3D frame model, possibly due
to geometric infeasibilities. Hence, there are 4101 geometrically valid frame
designs remaining. A breakdown of overall design feasibility is included in
Figure 6.
Load Cases and Simulation Setup
We seek to develop a concise set of tests which effectively evaluate a wide
variety of structural considerations of the bicycle frame. We follow the
methodology proposed in Vanwelleghem et al. [6] to evaluate in-plane,
transversal, and eccentric stiffness. The authors propose three load cases to
evaluate bicycle frames. Though Vanwelleghem et al.focus only on stiffness
and don’t specify load magnitudes in their methodology, we require loads
to roughly estimate maximum stresses and safety factors. Soden et al. [7]
study forces applied to the bicycle during actual ridership in several road
racing conditions (starting, climbing, braking, etc.) and find a maximum
pedal force of 1447 N across these conditions. We base our selected loads
based on these findings and illustrate our load cases in Figure 3. Based on
these studies and domain knowledge, we introduce three load cases which
are applied to every bicycle frame. These cases are defined as follows:
1. In-Plane Stiffness: We apply 2000 N upwards to the dropouts and
2000 N downwards to the bottom bracket while holding the head tube
fixed. We measure vertical and lateral displacements at the bottom
bracket and dropouts as well as safety factor.
2. Transverse Stiffness: We apply 500 N laterally to the bottom bracket
while holding the head tube fixed and preventing lateral deflection
at the dropouts. We measure lateral displacement at the bottom
bracket.
3. Eccentric Stiffness: We apply a 2000 N downward force and 140 Nm
twist to the bottom bracket (representing a pedal 2000N force applied
at an offset of 7 cm from the bottom bracket). We measure vertical
displacement and twist of the bottom bracket as well as safety factor.8 L. Regenwetter, C. Weaver, F. Ahmed
Figure 3: Diagrams of the three simulations designed to test frames during
in-plane, transverse, and eccentric load cases.
Six displacements and one rotation are measured across the three load-
ing cases, which can be used to find various directional and rotational stiff-
nesses of the frame. Additionally, safety factors are measured for Simula-
tions 1 and 3. Finally, we also note the weight of the frame model. We
note that these forces may not cover extreme use cases. De Lorenzo et al.[5]
study forces on a bicycle during “aggressive off-road cycling”, including a
2.5 meter jump and find a maximum rear wheel loading of 4000 N.
Material Properties
BIKED provides a categorical “material” parameter consisting of one of
six material classes. The breakdown of bicycle frames by material in the
original dataset is shown in Figure 4. Three of these, steel, aluminum,
and titanium are isotropic while carbon and bamboo are anisotropic. Since
anisotropic materials are difficult to simulate without additional informa-
tion about material orientation, we replace bamboo and carbon fiber, as
well as the unspecified “other” category with aluminum. BIKED does not
specify the alloy of steel, aluminum, and titanium used in bicycle mod-
els. Therefore, we select material properties of steel, aluminum, and ti-
tanium that are representative of common bicycle tube alloys. We select
steel properties common of a heat-treated chrome-molybdenum steel such
as AISI 4130 Steel, which is a rough average of the steels used in bicycle
fabrication. We select aluminum and titanium properties of 6061-T6 alu-FRAMED: Data-Driven Structural Performance Analysis of
Community-Designed Bicycle Frames 9
Table 2: Selected material properties for steel, aluminum, and titanium
used in simulation
Material Steel Aluminum Titanium
Elastic Modulus (GP a) 205 69 105
Poisson’s Ratio 0.285 0.330 0.310
Shear Modulus (GP a) 80 26 41
Density (kg/m3 ) 7850 2700 4429
Tensile Strength (M P a) 731 310 1050
Yield Strength (M P a) 460 275 827
minum and Ti-6Al-4V, respectively, which are two of the most commonly
used alloys in the industry. These properties are summarized in Table 2
Figure 4: Breakdown of bikes by material in original BIKED data.
Mesh Resolution
In numerical simulations, mesh resolution is an essential parameter that bal-
ances the tradeoff between computation cost and simulation fidelity. Since
this work simulates thousands of models, appropriately balancing compu-
tational cost and fidelity was essential. To study this balance, we randomly
selected five bicycle frame models to test in each of our three simulation
setups. For each study, we tested a logarithmic sweep of mesh resolutions
with minimum cell size ranging from 0.01 mm to 1.28mm. Meshes are gen-
erated using SolidWorks’ “Blended curvature-based mesh.” In each test,
the maximum cell size was set to 100 times the minimum cell size and the
cell growth ratio between adjacent cells was set to 1.3. We examined con-
vergence across mesh resolutions for each of our ten parameters of interest
and documented two sample plots in Figure 5.
Although displacement values stabilize for fine mesh size, we observe in
our studies that safety factors do not perfectly stabilize at even the finest of10 L. Regenwetter, C. Weaver, F. Ahmed
Figure 5: Convergence study calculating two quantities of interest at dif-
ferent mesh resolutions across five different bicycle frame models. Mesh
resolution is shown on horizontal axes and is measured in meters. The
selected mesh resolution of 0.03 mm is indicated on the plots.
mesh resolutions tested. Qualitative analysis of simulation results indicates
that the safety factors are reflecting extreme local stress concentrations at
the junctions of the tubes. Thus, the low safety factors at finer resolutions
can likely be attributed to imperfect modeling of the bicycle frame, partic-
ularly the infinite curvature at the tube junctions in the model. As such,
we advise users of the dataset to expect some error in reported stress and
safety factor values.
In general, displacement values are stable for mesh resolutions between
0.16 mm and 0.32 mm. Above 0.64 mm, displacement values are relatively
unstable and simulations occasionally fail to converge. Displacement values
are also relatively unstable for mesh resolutions between 0.04 and 0.16. We
hypothesize that this range of mesh resolutions critically impacts fidelity
since tube thicknesses may be as small as 0.5 mm and an accurate simulation
should place several cells spanning the thickness of any key geometry. Below
0.04 mm, displacements are fairly stable.
We select a mesh resolution of 0.03 mm for our simulations to attain
a reasonably precise estimate of displacements while avoiding the extreme
cost and overestimates of stresses brought about by finer meshing.
4 Validation
To demonstrate that our frame model and meshing setup yield meaningful
simulation results, we validate against existing published data. Validation
using physical testing is usually a costly and time-consuming method, butFRAMED: Data-Driven Structural Performance Analysis of
Community-Designed Bicycle Frames 11
Table 3: Validation Study Results
DeRosa SLX Casati Gold Line Holland SL/SP
Front Rear Model Front Rear Model Front Rear Model
Defl. Defl. Mass Defl. Defl. Mass Defl. Defl. Mass
Actual 0.40 0.15 1.966 0.44 0.15 1.966 0.38 0.13 1.962
Simulated 0.297 0.116 1.69 0.3028 0.124 1.80 0.26 0.107 1.77
Error 26% 23% 14% 31% 17% 8% 32% 18% 10%
is often the most rigorous. Fortunately, many existing studies have pub-
lished results of physical experimentation on bicycle frames. Few of these,
however, publish enough details on parametric data about the bikes they
test for us to construct an accurate 3D bicycle frame model for simulation.
We select a 1996 study by Damon Rinard [16] in which they physically
tested over 70 bicycle frames for transverse deflection of the front and rear
triangles. From their study, we select three frames for which we were able
to find sufficient parametric data to approximate the 3D frame models: the
DeRosa SLX, Casati Gold Line, and Holland SL/SP. Much of the paramet-
ric data comes from [17], which also provides estimates for frame mass. We
mimic Rinard’s loading and measurement setup and compare simulated
deflection values with reported values as well as frame model mass with
reported frame mass. These results are presented in Table 3.
The comparison shows that our simulations have similar trends of de-
flection and mass as Rinard’s studies. However, our simulations tend to
underestimate the front and rear deflections. This discrepancy is often ex-
pected between simulation and real-world testing and does not mean that
the simulations are incorrect. There can be many reasons to explain the dif-
ference, a few of which we discuss here. First, the discrepancy in mass can
largely be explained by the fact that our model does not include the frame’s
fork while the experimental values do, attributing to the underestimation
of mass values. Second, we suspect that measured deflections in Rinard’s
studies fail to eliminate deflection caused by the compliance of his clamping
scheme. This likely explains why the simulated values for front and rear
deflections are consistently off by around the same amount of deflection, as
the moment on the clamping mechanism is roughly the same for each test
since the distance from the clamp to the front and rear parts of the bicycle
do not vary a whole lot from test to test. For these reasons, we suspect that
our simulations are accurate. Nevertheless, it is important to report these
validation results against real-world experimentation. In future work, we
will conduct our own physical validation to accurately model our bicycle
frames.12 L. Regenwetter, C. Weaver, F. Ahmed
5 Analysis
Model Validity
Overall, we find that a significant proportion of frame models fail to with-
stand the fairly demanding load cases. Taking a minimum Factor of Safety
(FoS) of 1.0, we find that 3112 of 4198 frames simulated fail under at least
one of the loading cases. Recall that 219 of the original 4512 models failed
our geometric feasibility checks and 97 models failed to render due to ge-
ometry issues. The overall breakdown is shown in Figure 6. The relatively
few frames that successfully accommodate the loading cases reflect the dif-
ficult balance of parameters and complexity of the bicycle design problem.
Designers may often not anticipate that a particular bicycle design is struc-
turally deficient until physically testing the frame.
Figure 6: Breakdown of bikes by validity or type of infeasibility.
Exploring the Performance Space
Through our simulations, we captured ten structural performance values
for each of the 4101 geometrically valid bicycle frames. To make for easier
visualization, we explore a subset of this space with five of these ten per-
formance values: Dropout displacement during in-plane loading, bottom
bracket displacement during transverse loading, bottom bracket rotation
during eccentric loading, safety factor during in-plane loading, and weight.
Additionally, we consider a subset of 780 models randomly selected from
the 4101. Figure 7 shows a visualization of this subset, with histograms over
each performance parameter and scatterplots over each pair of performance
parameters. Additionally, points and histograms are organized based on bi-
cycle frame model validity. In this case, we take a frame model to be valid
if both safety factor values measured (one not shown) are greater than 1.
Additionally, we label three bicycle frames on these plots to analyze in the
following section. Based on these plots, we can make several observations.
For example, looking at this histograms, we see that the distributions of
deflections for valid bicycle frames are much more densely centered around
0 than for invalid frames (In general, valid frames have smaller deflection
magnitudes). We can also see that the two distributions align very closelyFRAMED: Data-Driven Structural Performance Analysis of Community-Designed Bicycle Frames 13 for mass and are drastically different for safety factors. Based on the scat- terplots, we can also observe some correlations between objectives. For example, heavier models tend to have deflections with smaller magnitudes. We discuss these correlations in more detail below. Figure 7: Plot showing: 1) Histograms over each performance parameter (diagonal plots). 2) Scatterplots over each pair of performance parameters (off-diagonal plots). 3) Labeling of bicycle frame models into feasible and infeasible models. 4) Three example frames that we discuss as case studies.
14                                   L. Regenwetter, C. Weaver, F. Ahmed

 (a) Frame 1 (Invalid)       (b) Frame 2 (Valid)        (c) Frame 3 (Valid)

Figure 8: Highlighted Example Frames, showing the frame with the highest
vertical deflection (left), the frame with the highest safety factor (middle),
and the lightest valid frame (right).

Case Studies
Here, we examine three sample frames that stand out for various reasons.
Frame 1 has the highest vertical deflection during in-plane loading, highest
deflection in transverse loading, and fourth highest rotational deflection in
eccentric loading, each measured at the bottom bracket. Frame 2 has the
highest safety factor during in-plane loading and fairly low displacements
in each of the load cases. Frame 3 is the lightest valid model, boasting
reasonable safety factors and modest deflections. Models of the three frames
are shown in Figure 8

Frame 1 This frame’s most noteworthy design characteristics are the un-
conventionally small diameter of the down tube and the large thickness of
the seat tube. These two driving factors explain why the bicycle frame has
exceptionally low vertical compliance as the seat tube prevents it from com-
pressing much with its unusual stiffness. However, this frame still exhibits
large transverse compliance, likely due to the small second moment of area
of the major tubes. Being made of lightweight titanium, this frame is also
one of the lightest in the dataset.

Frame 2 This frame is notable for its exceptionally high safety factor to
mass ratio, which it achieves partially through the use of titanium, a ma-
terial well known for its high strength and low weight. This frame model
effectively optimizes two very important considerations in bicycle design.
With consistently large tube outer diameters, yet relatively moderate thick-
nesses, this frame takes advantage of having a large second moment of area
to increase its bending stiffness and resistance to failure under high stress
FRAMED: Data-Driven Structural Performance Analysis of
Community-Designed Bicycle Frames                                           15

riding conditions.

Frame 3 This steel frame is similarly notable to Frame 2 for its high
safety factor to mass ratio, but it achieves this while maintaining a very
low mass in comparison to modern bicycle frames. An unconventionally
short seat tube eliminates most of the accumulated mass a normal design
would have, but does not cause for a large loss in vertical compliance. This
difference in design does not have a large effect on transverse stiffness since
the other tubes carry most of the load for out of plane forces, allowing
the frame to still be reasonably stiff and safe yet light and desirable. In
general, the diameter and thickness of the tubes carefully align to save
weight without compromising too much.

Pareto-Front

Next, we explore optimality in the bicycle frame performance space. In our
performance space, we have clear objectives: Minimizing the magnitude of
deflections, maximizing safety factors, and minimizing mass. Highlighting
non-dominated designs is a helpful design tool when searching for optimal-
ity. We say that one design “dominates” another if it outperforms that
design in every single performance metric. Any design that is not domi-
nated by any other design in the dataset is considered “non-dominated.”
The collection of these non-dominated points is typically the subset of de-
signs candidates that should be considered when selecting a final design and
is called a Pareto front. Figure 9 repeats the scatterplots and histograms
shown in Figure 7, except highlighting non-dominated (Pareto front) points.
Additionally, since our in-plane loading case sees both positive and negative
displacements and our goal is to bring deflections as close to 0 as possible,
we plot the absolute value of deflections instead of the original values.
   We determine that 57 of 780 designs are non-dominated, meaning that
the vast majority of designs are inferior by all considered metrics to at least
one other bicycle in the group. We can also appreciate that the distribution
of objectives over non-dominated points are significantly more favorable
than the distributions over the overall design space, confirming that these
non-dominating points indeed constitute the kind of “elite” subset that we
would expect. Manually examining the designs in such a subset may be
a helpful tool for designers, especially after further filtering any infeasible
designs.
16                                   L. Regenwetter, C. Weaver, F. Ahmed

Figure 9: Histograms and scatterplots over performance space with Non-
Dominated points (Pareto front) marked.

Parameter-Performance Correlations
Here we delve into correlations between performance objectives. We com-
pute Pearson Correlation Coefficient for each pair of objectives, using the
absolute value for all displacements. Heatmap visualization of these correla-
tions is shown in Figure 10. In general, displacements are highly correlated,
but tend to negatively correlate with safety factors and bicycle frame model
mass. Safety factors were positively correlated. Interestingly frame model
mass was not strongly correlated with safety factor, potentially indicating
that many bicycle frame models “waste” mass without putting it to good
FRAMED: Data-Driven Structural Performance Analysis of
Community-Designed Bicycle Frames                                          17

use.

           Figure 10: Correlation Matrix of Design Objectives.

   Overall, we provide the performance and design parameter values for
community members, researchers, and bicycle framebuilders to better un-
derstand these relationships and find key insights about their design choices.

6      Limitations
FRAMED is the first dataset that provides both parametric and perfor-
mance values for a large set of community designed bicycle frames. How-
ever, it has a few limitations, which we discuss below. FRAMED inherits
BIKED’s challenges with limited diversity in certain design parameters. We
attempt to mitigate this by resampling these parameters. This resampling
process makes FRAMED less suitable for studies about the existing bicycle
design space and more suitable for surrogate models aiming to capture a
wider portion of the design space.
18 L. Regenwetter, C. Weaver, F. Ahmed
FRAMED expands significantly on previous data-driven studies of bi-
cycle frame design, with a considerably larger and more comprehensive
design space. Nonetheless, FRAMED’s design space is still far more re-
stricted than the real-world bicycle design space. For example, the design
space only considers bikes with a conventional diamond frame, and excludes
other bicycle frame configurations, such as bicycles with rear suspension
mechanisms. It also excludes bicycle designs with non-cylindrical tubes
and bicycles made from materials other than the three we support. We aim
to expand FRAMED in future work, to include more types of geometries.
Though we validate FRAMED’s results, we acknowledge potential in-
accuracy in the simulations, especially reported stresses and safety factors.
Further validation against physical bicycle frames with better known sizing
and parameters would help resolve this uncertainty. We also acknowledge
that our frame modeling has a few assumptions. For example, we do not
model curvature at the junctions of tubes since automating the parametriza-
tions of these curves and fillets would be too complex and they make our
simulations less robust.
7 Future Work
A natural extension of FRAMED is the fitting of surrogate models, which
can drastically accelerate the early-stage conceptual design of bicycle frames
by rapidly estimating design performance without the need for expensive
and time-consuming simulation or physical prototyping. Another exciting
extension of FRAMED would be to select an optimal performer to physi-
cally fabricate and test.
This research also has applications outside of bicycle design in the
broader community of data-driven research. One of FRAMED’s core contri-
butions is the introduction of a dataset of 4500 bicycle frame designs as well
as associated structural performance values for these designs. FRAMED
is therefore well positioned to support advancements in data-driven design
tools like surrogate models. FRAMED may even support AI-based design
tools such as performance-aware generative methods. Advanced AI-based
design frameworks, such as Deep Generative Models (DGMs) have shown
promising initial results on a variety of design problems. FRAMED is par-
ticularly well positioned to accelerate DGM development since not only do
DGMs lack quality data and benchmark problems, most current DGMs do
not account for design performance at all [18].FRAMED: Data-Driven Structural Performance Analysis of Community-Designed Bicycle Frames 19 8 Conclusion This study presents a data-driven approach to bicycle frame design, analy- sis, and optimization. To do so, we develop a dataset of 4500 individually- designed bicycle frames, simulate each in three loading conditions, and extract ten performance parameters of interest. We perform several valida- tion studies on our data, such as comparing simulation results to physical experimental results on real bicycle frames, and demonstrating convergence at the selected mesh resolution. Through our analysis, we highlight general themes across bicycle designs in the dataset, study a selection of frames in greater detail, identify a non-dominated subset of the design space, and explore correlations between design objectives. Through our dataset and analysis, we aim to provide a resource for the bicycle design community, in particular, to help increase accessibility to custom bicycles and positively impact bicycle ridership. We simultaneously aim to support researchers in developing data-driven design methods like surrogate models or Deep Generative Models.
20                                   L. Regenwetter, C. Weaver, F. Ahmed

References
 [1] P. Oja, S. Titze, A. Bauman, B. De Geus, P. Krenn, B. Reger-Nash,
     and T. Kohlberger, “Health benefits of cycling: a systematic review,”
     Scandinavian journal of medicine & science in sports, vol. 21, no. 4,
     pp. 496–509, 2011.
 [2] T. L. Hamilton and C. J. Wichman, “Bicycle infrastructure and traffic
     congestion: Evidence from dc’s capital bikeshare,” Journal of Envi-
     ronmental Economics and Management, vol. 87, pp. 72–93, 2018.
 [3] O. Edenhofer, Climate change 2014: mitigation of climate change.
     Cambridge University Press, 2015, vol. 3.
 [4] O. Oke, K. Bhalla, D. C. Love, and S. Siddiqui, “Tracking global
     bicycle ownership patterns,” Journal of Transport & Health, vol. 2,
     no. 4, pp. 490–501, 2015.
 [5] D. S. De Lorenzo and M. L. Hull, “Quantification of Structural
     Loading During Off-Road Cycling,” Journal of Biomechanical
     Engineering, vol. 121, no. 4, pp. 399–405, 08 1999. [Online]. Available:
     https://doi.org/10.1115/1.2798337
 [6] J. Vanwalleghem, I. De Baere, M. Loccufier, and W. Van Paepegem,
     “Development of a multi-directional rating test method for bicycle stiff-
     ness,” Procedia Engineering, vol. 72, pp. 321–326, 2014.
 [7] P. Soden, M. Millar, B. Adeyefa, and Y. Wong, “Loads, stresses, and
     deflections in bicycle frames,” The Journal of Strain Analysis for En-
     gineering Design, vol. 21, no. 4, pp. 185–195, 1986.
 [8] D. Covill, A. Blayden, D. Coren, and S. Begg, “Parametric finite el-
     ement analysis of steel bicycle frames: the influence of tube selection
     on frame stiffness,” Procedia Engineering, vol. 112, pp. 34–39, 2015.
 [9] D. Covill, P. Allard, J.-M. Drouet, and N. Emerson, “An assessment of
     bicycle frame behaviour under various load conditions using numerical
     simulations,” Procedia engineering, vol. 147, pp. 665–670, 2016.
[10] L. B. Lessard, J. A. Nemes, and P. L. Lizotte, “Utilization of fea in
     the design of composite bicycle frames,” Composites, vol. 26, no. 1, pp.
     72–74, 1995.
[11] C.-P. Chung and C.-F. Lee, “Parameters decision on the product char-
     acteristics of a bike frame,” Procedia-Social and Behavioral Sciences,
     vol. 40, pp. 107–115, 2012.
FRAMED: Data-Driven Structural Performance Analysis of
Community-Designed Bicycle Frames 21
[12] Y.-C. Cheng, C.-K. Lee, and M.-T. Tsai, “Multi-objective optimiza-
tion of an on-road bicycle frame by uniform design and compromise
programming,” Advances in Mechanical Engineering, vol. 8, no. 2, p.
1687814016632985, 2016.
[13] C.-C. Lin, S.-J. Huang, and C.-C. Liu, “Structural analysis and opti-
mization of bicycle frame designs,” Advances in Mechanical Engineer-
ing, vol. 9, no. 12, p. 1687814017739513, 2017.
[14] D. Covill, S. Begg, E. Elton, M. Milne, R. Morris, and T. Katz, “Para-
metric finite element analysis of bicycle frame geometries,” Procedia
Engineering, vol. 72, pp. 441–446, 2014.
[15] L. Regenwetter, B. Curry, and F. Ahmed, “Biked: A dataset for com-
putational bicycle design with machine learning benchmarks,” Journal
of Mechanical Design, vol. 144, no. 3, 2022.
[16] D. Rinard, “Frame deflection test,” 1996. [Online]. Available:
https://www.sheldonbrown.com/rinard/rinard{ }frametest.html
[17] E. Bicycle, “The bicycle info project.” [Online]. Available: http:
//www.equusbicycle.com/bike/columbus/columbuschart.htm
[18] L. Regenwetter, A. H. Nobari, and F. Ahmed, “Deep generative models
in engineering design: A review,” arXiv preprint arXiv:2110.10863,
2021.You can also read