TOWARDS FILLING THE GAPS AROUND RECURRENT EVENTS IN HIGH-DIMENSIONAL FRAMEWORK: LITERATURE REVIEW AND EARLY COMPARISON
←
→
Page content transcription
If your browser does not render page correctly, please read the page content below
T OWARDS F ILLING THE G APS AROUND R ECURRENT E VENTS IN
                                           H IGH -D IMENSIONAL F RAMEWORK : L ITERATURE R EVIEW AND
                                                              E ARLY C OMPARISON

                                                                                              A P REPRINT
arXiv:2203.15694v1 [stat.ME] 29 Mar 2022

                                                                                             Juliette Murris
                                                   Inserm, Centre de recherche des Cordeliers, Université de Paris, Sorbonne Université, Paris, France
                                                                                      HeKA, Inria, Paris, France
                                                                       RWE & Data, Pierre Fabre, Boulogne-Billancourt, France
                                                                               juliette.murris@pierre-fabre.com

                                                                                        Anaïs Charles-Nelson
                                                AP-HP, Hôpital Européen Georges-Pompidou, Unité de Recherche Clinique, APHP.Centre, Paris, France
                                                   Inserm, Centre d’Investigation Clinique 1418 (CIC1418) Épidémiologie Clinique, Paris, France

                                                                                           Audrey Lavenu
                                                                    Université de Rennes 1, Faculté de médecine, Rennes, France
                                                                IRMAR, Institut de Recherche Mathématique de Rennes, Rennes, France
                                                                   CIC Inserm CIC 1414, Université de Rennes 1, Rennes, France

                                                                                          Sandrine Katsahian
                                                  Inserm, Centre de recherche des Cordeliers, Université de Paris, Sorbonne Université, Paris, France
                                                                                      HeKA, Inria, Paris, France
                                                AP-HP, Hôpital Européen Georges-Pompidou, Unité de Recherche Clinique, APHP.Centre, Paris, France
                                                    Inserm, Centre d’Investigation Clinique 1418 (CIC1418) Épidémiologie Clinique, Paris, France
                                                    HEGP, Service d’informatique médicale, biostatistiques et santé publique, AP-HP, Paris, France

                                                                                             A BSTRACT
                                                   Background Study individuals may face repeated events overtime. However, there is no consensus
                                                   around learning approaches to use in a high-dimensional framework for survival data (when the
                                                   number of variables exceeds the number of individuals, i.e., p > n). This study aimed at identifying
                                                   learning algorithms for analyzing/predicting recurrent events and at comparing them to standard
                                                   statistical models in various data simulation settings. Methods A literature review (LR) was con-
                                                   ducted to provide state-of-the-art methodology. Data were then simulated including variations of
                                                   the number of variables, the proportion of active variables, and the number of events. Learning
                                                   algorithms from the LR were compared to standard methods in such simulation scheme. Evaluation
                                                   measures were Harrell’s concordance index, Kim’s C-index and error rate for active variables. Re-
                                                   sults Seven publications were identified, consisting in four methodological studies, one application
                                                   paper and two reviews. The broken adaptive ridge penalization and the RankDeepSurv deep neural
                                                   network were used for comparison. On simulated data, the standard models failed when p > n.
                                                   Penalized Andersen-Gill and frailty models outperformed, whereas RandkDeepSurv reported lower
                                                   performances. Conclusion As no guidelines support a specific approach, this study helps to better
                                                   understand mechanisms and limits of investigated methods in such context.

                                           Keywords Recurrent Events · Survival Analysis · High-Dimensional Data · Machine Learning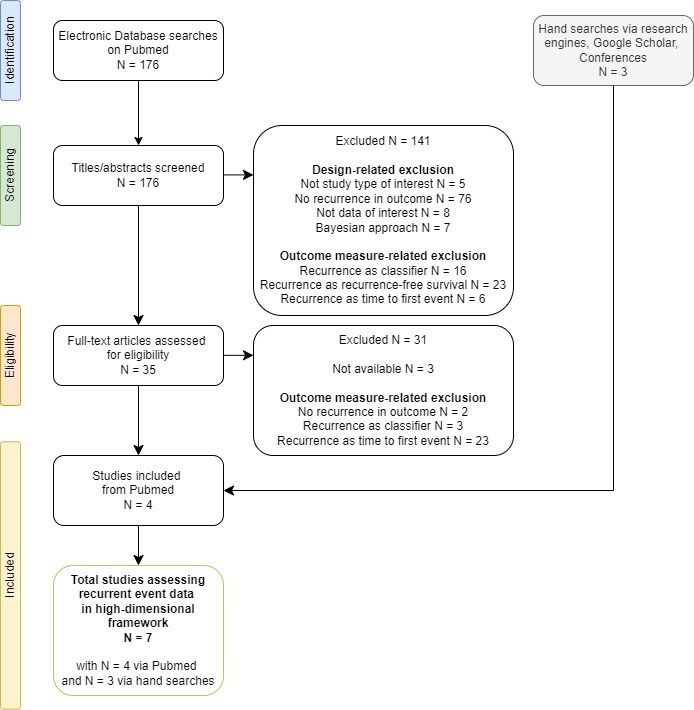
Murris, et al. (2022)                                       A P REPRINT

1   Introduction
Study individuals may face repeated events over time, such as hospitalizations or cancer relapses. In either clinical
trials or real-world set, survival analysis usually focuses on modeling the time to the first occurrence of the event.
Nonetheless, variables may have a varying impact on the first event and on subsequent occurrences. When dealing with
multiple occurrences of an event, it becomes a matter of modeling recurrent events (Figure 1).

                                         Figure 1: Recurrent Event Framework

Two main challenges arise when analyzing recurrent events. First, interindividual heterogeneity emerges as some
subjects may be more likely than others to experience the event. Second, events for an individual are not independent,
raising intraindividual heterogeneity. These issues have been statistically addressed through two approaches, marginal
and conditional models. Marginal models involve implicitly averaging over the history of previous recurrent events.
Conditional models can condition on the history of the events.

Moreover, modern technologies enable data to be generated on thousands of variables or observations, as per
genomics, medico-administrative databases, disease monitoring by intelligent medical devices, etc. While massive data
describe large numbers of observations, high-dimensional data are characterized when the number of variables studied
p is greater than the number of individuals n. It is precisely the context of high dimension that will be of particular
interest in this paper. Standard statistical models may no longer be applied in this case, as they tend to face convergence
problems and non-clinically relevant significance of the variables can arise. To help solve high dimension problems,
many machine learning methods have emerged.

Literature reviews have previously been conducted on recurrent events, but none has dealt with a high di-
mensional framework [Rogers et al., 2014, Twisk et al., 2005, Amorim and Cai, 2015]. The objectives of this study
were to identify innovative methodology for the analysis and the prediction recurrent events in high-dimensional
survival data and to compare them to standard methods using simulated data.

The literature review for the identification of innovative approaches is first detailed. Methodology compo-
nents used for the comparison are then developed and results are outlined. Last sections finally summarize main points
of discussion and provide the key messages from this paper.

                                                            2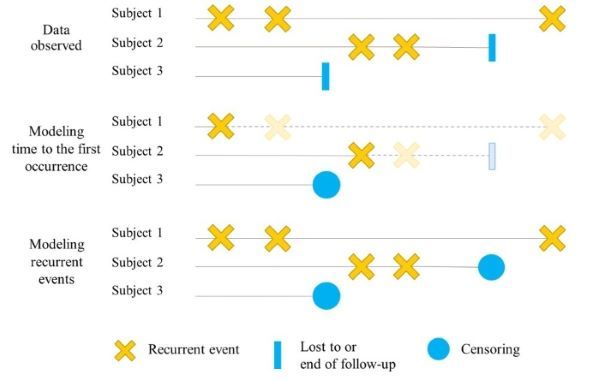
Murris, et al. (2022)                                     A P REPRINT

2   Literature review

A literature review was conducted on PubMed based on Cochrane recommendations [Tacconelli, 2010, Higgins et al.,
2019]. Hand searches were then carried out via relevant search engines and conferences [noa, 2013]. Inclusion criteria
were either methodological or observational studies that analyzed any recurrent outcome. Reviews and/or surveys were
also eligible. Methods were considered if the publication mentioned that data in a high-dimensional framework were
used or if machine learning techniques were employed. Exclusion criteria were any Bayesian approach and clinical trial
design. Research equation included (but was not limited to) the following key terms (and associated MeSH Terms):
‘recurrence’, ‘survival analysis’, ‘high-dimension’ and ‘machine learning’. Two reviewers assessed the eligibility of
publications independently and any discrepancies were discussed. Data were summarized descriptively based on
the following categories: publication and study characteristics, statistical/machine learning approaches used, and
application of data.

Extraction was performed in November 2021 and led to the identification of 176 hits through electronic re-
search on Pudmed (Figure 2). Overall, after confirming the outcome of interest dealt with recurrence, the primary
reason for exclusion was the non-consideration of recurrent events as time-to-event for each occurrence. Recurrence
was considered as a classifier (19/176), as a recurrence-free survival outcome (23/176), or as a time-to-first event
(29/176). This may be the illustration of authors’ caution when dealing with recurrent events in high dimensions, as no
published guidelines or recommendations exist to date. In addition, three full-text articles could not be reviewed as
they were not available. After title, abstract and full-text thorough review, four publications were included from the
electronic database search. Three additional papers from the hand searches were identified.

                              Figure 2: Flowchart of Included Publications via Pubmed

                                                          3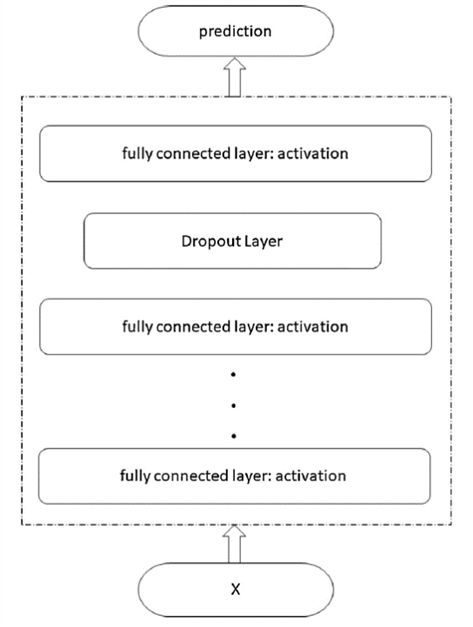
Murris, et al. (2022)                                      A P REPRINT

A total of seven relevant publications were selected, consisting in four methodological studies, one application paper
and two literature reviews (Table 1). Two articles describing learning algorithms for variable selection strategies were
identified. First, focused on accelerating coefficient estimation with a coordinated descent algorithm and penalizing
partial likelihood. Zhao et al. [2018] provided an extension of Ridge penalization for estimating and selecting variables
simultaneously. Gupta et al. [2019] and Jing et al. [2019] developed deep neural networks extensions for the analysis
of recurrence, respectively. In addition, Kim et al. [2021] proposed an application paper aiming at estimating time
between two breast cancer recurrences. However, the methodology used in the latter was an extension of a recurrent
neural network which was unfortunately not published in any peer-reviewed journal. Finally, two literature reviews
mentioned learning algorithms for recurrent event data analysis, even though none of them provided guidelines [Wang
et al., 2019, Bull et al., 2020].

Findings from this literature review demonstrated the current gap in the literature and vast differences in the
context and methods of interest. In particular, not all developed models were based on simulated data, such as Jing et al.
[2019]. Also, none of the included publications compared their performance one to another. For instance, variable
selection approaches were compared to standard statistical model only, while neural networks were compared to other
neural networks or random forests. No head-to-head comparison across standard methods, learning algorithms and
deep neural network seemed to have been performed.

                                                            4
Table 1: Papers Identified from the Literature Review
Data used for Code availability
# Year Author Title Type Description Evaluation measure
application / reproducibility
Regularization method with
Lasso penalized
penalization and use of the
semiparametric
coordinated descent algorithm, Number of selected
Wu, regression on Variable Chronic septic
#1 2013 which computes the deviations of predictor variables and No
et al. high-dimensional selection granulomatosis
the optimization problem and regression coefficients
recurrent event data
updates the parameter value
via coordinate descent
iteratively
Extension of the broken adaptive ridge
MSE
method to recurrent events, involves
Variable selection for Number of predictor
repetition and reweighting of
Zhao, recurrent event data with Variable Chronic septic variables selected
#2 2018 penalized L2 models Yes
et al. broken adaptive ridge selection granulomatosis correctly, and number of
Simultaneous variable selection and
regression predictor variables
parameter estimation, accounts for
selected incorrectly
clustering effects
Introduction to survival analysis,
Machine Learning for overview of classical methods and
Wang, Literature
#3 2019 Survival Analysis: of learning methods / / /
et al. review
A Survey Recurrent events are mentioned, but
ML methods are not developed
5
CRESA: A Deep
LSTM neural networks with the
Learning Approach to Deep MIMIC III
Gupta, introduction of the cumulative Harrell’s C-index
#4 2019 Competing Risks, neural Machine failure No
et al. incidence curve to take into account MAE
Recurrent Event networks data
Murris, et al. (2022)
competitive and/or recurrent events
Survival Analysis
Extension of the DeepSurv model
(neural networks for competitive
A deep survival Deep
Jing, events) with the use of ranking in the Myocardial infarction
#5 2019 analysis method based neural Harrell’s C-index Yes
et al. loss function on the differences Breast cancer omic data
on ranking networks
between observed and predicted
values
Summary of existing methodology to
Harnessing repeated
provide clinical prediction depending
measurements of
on the nature on input data
Bull, predictor variables for Literature
#6 2020 Both statistical and learning / / /
et al. clinical risk prediction: review
approaches are described, but no
a review of
ML methods for recurrent events
existing methods
highlighted
Deep Learning-Based
Prediction Model for Use of Weibull Time To Event
Breast Cancer Deep Recurrent Neural Network, an Breast cancer
Kim, Harrell’s C-index
#7 2021 Recurrence Using neural extension of recurrent neural registry in Yes
et al. MAE
Adjuvant Breast Cancer networks network to sequentially estimate Korea
A P REPRINT
Cohort in Tertiary time to next event
Cancer Center Registry
LSTM = long short-term memory; MAE = mean absolute error; ML = machine learning. Articles were sorted by publication year. #1 to #3 were identified via hand searches and #4 to
#7 via Pubmed.Murris, et al. (2022) A P REPRINT
3 Materials and method
Standard statistical models were not designed to handle high dimension. The most commonly used ones were described
and compared to approaches identified in the literature review. The latter were detailed in the coming sections. Only
published approaches with available code were considered (Table 1). Measures of performance for evaluation and
comparison were described and were selected in order to stick to survival framework, to specificities inherent to
recurrent event data and to machine learning stakes. Finally, the simulation scheme was developed.
3.1 Notations
Let Xi be a p-dimensional vector of covariates, β the associated regression coefficients, λ0 (t) the baseline hazard
function, Yi (t) an indicator of whether subject i is at risk at time t, δi = 1 when the subject experienced the event
(else 0). Let Ei and Ci be the time to event or censoring, Ti = Ei ∧ Ci for the patient i, with a ∧ b = min(a, b).
Ni∗ (t) denoted the number of events over the interval [0, t]. Of note, i = 1, . . . , n, with n the number of subjects and
X ∈ Rn∗p denoted the covariates matrix for all subjects.
3.2 Modeling recurrent events
3.2.1 Standard statistical models
Andersen-Gill (AG), Prentice, William et Peterson (PWP), Wei-Lin-Weissfeld (WLW) and the frailty models were
developed as extensions of the Cox model [Andersen and Gill, 1982, Prentice et al., 1981, Wei et al., 1989, Vaupel et al.,
1979, Cox, 1972]. These methodologies commonly used models to handle recurrent event data. Their characteristics
are summarized in Table 2. Further details on time scales and how models accounted for subject at risk can be found in
Appendix.
Table 2: Standard Statistical Models for Recurrent Events Analyses
Model Components and specificities
Conditional model, accounts for the counting process as a time scale and unrestricted set for subjects at risk
AG Recurrent events within individuals are independent and share a common baseline hazard function
Intensity of the model: λi (t) = Yi (t) ∗ λ0 (t) ∗ exp(β t Xi )
Conditional model, counting process as time scale and restricted set for subjects at risk
PWP Stratified AG, stratum k collects all the kth events of the individuals
Hazard function: λik (t) = Yi (t) ∗ λ0k (t) ∗ exp(βkt Xi )
Marginal model, also stratified, calendar time scale and semi-restricted set for subjects at risk
WLW Intra-subject dependence
Hazard function: λik (t) = Yi (t) ∗ λ0k (t) ∗ exp(βkt Xi )
Extension of AG model
Frailty Random term zi for each individual to account for unobservable or unmeasured characteristics
Intensity of the model: λi (t) = Yi (t) ∗ λ0 (t) ∗ zi ∗ exp(β t Xi )
AG = Andersen-Gill; PWP = Prentice, William et Peterson; WLW = Wei-Lin-Weissfeld.
3.2.2 Learning algorithms for variable selection
A common approach to address high-dimension challenge is variable selection. Penalizing models help to reduce the
space of parameter coefficients, which is called shrinkage. Widely used for regression and classification problems,
Lasso penalization accepts null coefficients to select variables and Ridge helps to deal with multicollinearity in the data.
Both penalization approaches have been extended to Cox models in standard survival analysis framework [Tibshirani,
1997, Simon et al., 2011]. The purpose is to solve a constrained optimization problem of the partial log-likelihood of
the Cox model, which is written
n
X n
X n
X
L(β) = δi β t Xi − δi ∗ log exp(β t Xi ) (1)
i=1 i=1 j∈R(τi )
6Murris, et al. (2022) A P REPRINT
With R(t) the set of individuals who are “at risk” for the event at time t. For CoxLasso, regularization is
performed using an L1 norm penalty and β̂ = arg maxβ L(β), kβk1 ≤ s and for CoxRidge an L2 norm penalty
and β̂ = arg maxβ L(β), kβk2 ≤ s, with s ≥ 0. The lower the value of s, the stronger the penalization. Hy-
perparameters, named penalty coefficients, are used to determine its value and enable to control the impact of the penalty.
Zhao et al. [2018] proposed an extension of these methods to recurrent events by developing the broken adaptive ridge
(BAR) regression. The first iteration consists of a penalized L2 model
p
X
β̂ (0) = arg min(−2 ∗ Lmod (β) + ξn βj2 ), ξn ≥ 0 (2)
β j=1
If penalization hyperparameter ξn ≥ 0, this is a Ridge penalty, and if ξn = 0 then β (0) is not penalized. We update for
each iteration ω:
p
X βj2
β̂ (ω) = arg min(−2 ∗ Lmod (β) + θn (ω−1)
), ω ≥ 1 (3)
β j−1 β̂j
BAR estimates are defined by β̂ = limk→∞ β̂ (ω) . The estimator benefits from the oracle properties of both penalties
for model covariate selection and estimation. Cross-validation is recommended to optimize values of hyperparameters
ξn and θn . According to Kawaguchi et al. [2020], estimates are not sensitive to variations of ξn and optimization can be
performed only on θn . In the absence of a consensual single measure on cross-validation under recurrent events, two
values for θn were studied in this paper, thereby considering two separate models.
3.2.3 Deep neural network
RankDeepSurv is a deep neural network proposed by Jing et al. [2019] with fully connected layers (all neurons in one
layer are connected to all neurons in another layer) (Figure 3).
Figure 3: RankDeepSurv Neural Network Diagram (sourced from Jing 2019)
The specificity of the RankDeepSurv neural network lies in the loss function adapted to survival, which results from the
sum of two terms: one to constrain the survival model using an extension of the mean square error and the other to
evaluate the rank error between observed and predicted values for two individuals. The loss function is written as
Lloss (θ) = α1 ∗ L1 (θ) + α2 ∗ L2 (θ) + µ ∗ kθk22 (4)
with
7Murris, et al. (2022) A P REPRINT
• α1 , α2 > 0 constant values, θ the weights of the network, µ regularization parameter for L2 ;
Pn
• L1 = n1 i=1,I(i)=1 (yj,pred − yj,obs )2 , I(i) = 1 if i is censored or if the predicted time to event is before
observed time, else 0;
Pn 2
• L2 = n1 I(i,j)=1 (yj,obs − yi,obs ) − (yj,pred − yi,pred ) , I(i, j) = 1 if yj,obs − yi,obs > yj,pred − yi,pred ,
else 0.
Gradient descent is utilized for solving the minimization of Lloss .
3.3 Evaluation criteria to measure performance
3.3.1 Harrell’s Concordance index
Harrell’s C-index is a common evaluation criterion in survival analysis [Harrell et al., 1996]. This measure is the
proportion of pairs of individuals for which the order of survival times is concordant with the order of the predicted
risk. In the presence of censoring, the denominator is the number of pairs of individuals with an event. The C-index is
estimated as follows
P
i6=j I(ηi < ηj ) ∗ I(Ti > Tj ) ∗ δj
Cˆ = P (5)
i6=j I(Ti > Tj ) ∗ δj
With ηi the risk of occurrence of the event. Of note, when two individuals are censored, then we cannot know which of
the two has the event first. This pair is not included in the calculation. In the same way, if one of the individuals is
censored and its censoring time is lower than the event time of another individual, we cannot know which of the two
has the event first. This pair is also not included in the C-index calculation. If the C-index is equal to 1, it means a
perfect prediction, and if the C-index ≤ 0.5, it implies that the model behaves similarly or worse than random. Models
with a higher C-index close to 1 are preferred. Harrell’s C-index was computed at each event.
3.3.2 Kim’s C-index
Kim et al. [2018] proposed a measure of concordance between observed and predicted event counts over a time interval
of shared observations. It is the proportion of pairs of individuals for whom the risk prediction and the number of
observed events are concordant:
Pn Pn ∗ ∗
t
i=1 j=1 I Ni (Ti ∧ Tj ) > Nj (Ti ∧ Tj ) ∗ I(β Xi > β t Xj
Cˆrec = Pn Pn ∗ ∗
(6)
i=1 j=1 I Ni (Ti ∧ Tj ) > Nj (Ti ∧ Tj )
This extension of the C-index implies:
• Two individuals are comparable up to the minimum time of follow-up;
• A pair contributes to the denominator if the two event counts are not equal.
As per Harrell’s C-index in Equation (5), a score close to 1 indicates a better performance of the model. As opposed to
Harrell’s C-index, Kim’s C-index was computed once across all the events.
3.3.3 Error rate for active variables
When simulating the datasets, the active status of each variable is known. Methods report the significant variables with
a p-value < 0.05 (except deep neural networks). Significant variables are considered as positive tests for their active
status. Some active variables likely have a false negative test (F N ), and some passive variables have a false positive
test (F P ). The error rate (err) is the proportion of misclassified variables after prediction:
FP + FN
err = (7)
p
8Murris, et al. (2022) A P REPRINT
3.4 Simulation scheme
The following assumptions were made:
• Active variables were continuous, and all have the same (non-zero) effect;
• The variables do not vary over time;
• Individuals were at risk continuously until end of follow-up;
• Censoring is not informative.
The generation of the covariates matrix, X ∼ Nm (µ, σ(ρ)). µ = (µ1 ...µp ) = (a...a) and σ(ρ)) was the covariance
matrix with an autoregressive correlation structure and ρ ∈ (0, 1). The coefficients β = (β1 ...βp ) = (b, . . . , b, 0, . . . , 0)
were associated with the p covariates. m coefficients were equal to a constant b ∈ R (the value of the active
coefficients) and p − m coefficients were equal to zero. The sparse rate was described by m p . The baseline hazard
function followed a Weibull distribution with scale α > 0 and shape γ > 0, and λ0 (t) = α ∗ γ ∗ t(γ−1) . The
Rt
cumulated baseline hazard function could be expressed as Λ0 (t) = 0 λ0 (s)ds = α ∗ tγ . Hence the cumulative
hazard function could be expressed as Λ(t) = Λ0 (t) ∗ exp(β t Xi ). Conditional baseline hazard function was then
defined as Λ̃t (u) := Λ̃i (u|Ti−1 ) = Λ(u+t)−Λ(t). A frailty term zi i.i.d. was incorporated to account for heterogeneity.
To maintain censoring rates, censored individuals were randomly drawn (censoring is not informative), as
per Jahn-Eimermacher et al. [2015]. The algorithm of Jahn-Eimermacher [2008] was applied to simulate event times k
for each subject i:
ti,1 = Λ−1 (t)(− log(1 )), ti,k+1 = ti,1 + Λ̃−1
i,tk (− log(k+1 )) (8)
with k ∼ U [0, 1].
Train-test split was employed with a 70-30% distribution. Datasets were generated with:
• N = 100 subjects
• Censoring rate of 20%
• ρ = 0.7
• b = 0.15 α = 1 and γ = 2
• z ∼ Gamma(0.25)
Scenarios include variations of the number of covariates p = 25, 50, 100, 150, and 200 and the sparse rate = 0%, 25%,
and 50%. For each of the 15 scenarios, 100 datasets were generated to account for variability.
4 Results
4.1 Data simulation overview
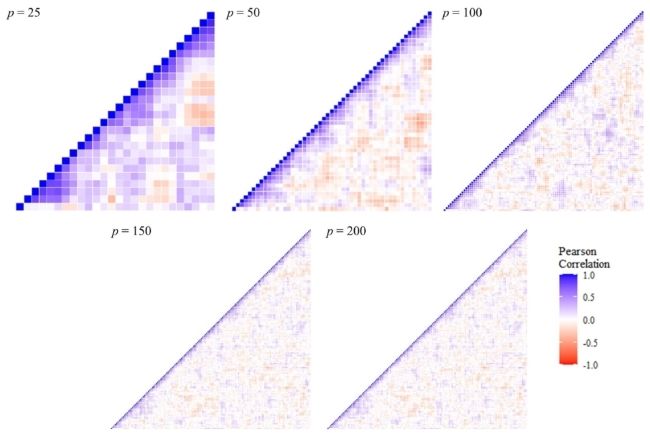
Datasets had identical characteristics in terms of number of individuals, structure of covariates, but differed across
scenarios in terms of number of covariates and sparse rate. In the variance-covariance matrix, the covariates were
highly correlated when they were close, then decreasingly close when they were further apart. Figure 4 captured this
relationship across covariates with five datasets, regardless of the number of covariates. Figure 5 provided a visual
representation of the history of nine individuals and their events over the follow-up period (and made it easier to
understand Figure 1).
9Murris, et al. (2022) A P REPRINT
Figure 4: Heatmaps of Correlation with Variations of the Number of Variables (25, 50, 100, 150, 200)
Figure 5: History of the First Nine Simulated Individuals (for a given training set)
4.2 Evolution of average C-index
The evolution of average C-index was investigated across all 15 scenarios (Figure 6). As expected, the standard models
failed as soon as p > n. Whereas the C-indices were also expected to be around 0.5 when the sparse rate was zero,
they increased as the sparse rate increased. The best performance was obtained using the frailty model. Other models
showed similar trends, except for the WLW and RankDeepSurv models. The C-indices of these two models remained
around the value of 0.5 (and even below) regardless of the scenario. The Kim’s C-index was more stable across the
different number of covariates and sparse rates, although it tended to decrease as the number of covariates increased
with sparse rate = 50%. Small difference across penalty values was noticed as 0.05 penalized models and 0.1 penalized
models followed similar trends.
4.3 Focus on the variability of C-indices for two extreme scenarios
Two extreme scenarios were thoroughly studied: one with no active variable and only 25 variables (A), and another on
which models overall reported great performance with a sparse rate 25% and over 150 variables (B). Similar trends in
variability were observed across the two scenarios and for each C-index (Appendix Figure 8). Kim’s C-index was less
volatile across models and their penalties, with values ranging between 0.39 and 0.63 and 0.28 and 0.76 for (A) and (B),
respectively. Harrell’s C-index was increasingly variable in the first event (A: min = 0.26 and max = 0.74; B: min =
10Murris, et al. (2022) A P REPRINT
0.24 and max = 0.81), second event (A: min = 0.30 and max = 0.75; B: min = 0.17 and max = 0.85), and third event (A:
min = 1 and max = 0).
Figure 6: Evolution of Average C-indices with Sparse Rate Equal to 0% (A), 25% (B) and 50% (C)
4.4 Error rate for active variables
The results on the average error rates were displayed in Appendix Figure 9. In the scenarios where the sparse rate was
equal to 0%, all models reported average error rates below 0.5, except penalized WLW with error rates around 0.75.
Average error rates appeared similar when no penalty was applied. AG model had the lowest average error rate for
11Murris, et al. (2022) A P REPRINT
each p, with a minimum value of 0.018 for the penalized model at 0.1 ∗ log(p) and p = 200. The average error rate
decreased when the penalty increased when p > n. For the scenarios with a sparse rate equal to 25%, the unpenalized
frailty model had the best performance, while the other models provided higher values. Similarly, penalties decreased
the average error rate. Penalized AG models reported average error rates lower than 0.3. Finally, when the sparse rate
was equal to 50%, almost constant average error rates around 0.5 were observed for each model regardless of p.
5 Discussion
The literature review provided in this paper enabled the identification of emerging approaches. A total of seven
publications were found, testifying the shortage of available resources in this area. At the same time, these approaches
had not been compared with one another. This may lead to erratic behavior and confusion when researchers wish to
conduct robust and reliable analyses in such a context. This study thus proposed to evaluate some of the innovative
learning algorithms which were developed to solve the high-dimensional framework when considering recurrent events.
The investigation of the above 15 scenarios on simulated data arose specificities of both methodology and measures
used for their evaluation of performance.
Firstly, unpenalized standard approaches failed as soon as p > n as expected, while penalized helped to im-
prove their performance when p < n. This was typically expected as standard statiscal models were not designed
for p > n cases. AG and PWP models reported equivalent performance, while the frailty model consistently
had the best performance. This was due to the construction of the frailty term from the simulation scheme. The
WLW model performed mediocrely, regardless of if it was penalized or not; this was consistent with previous
findings in the literature, exposing WLW models to be more appropriate with events of different types rather
than recurrent events [Ozga et al., 2018, Ullah et al., 2014]. Nevertheless, these models, each with their own
specificities, can respond to differing needs, especially related to the research questions, but only methodological
issues were meant to be illustrated in this study [Rogers et al., 2014, Amorim and Cai, 2015, Charles-Nelson et al., 2019].
Secondly, variable selection with penalties did not significantly increase performance, and few variables
were even selected when the sparse rate was zero. Since only two values for the hyperparameter were explored, it
seemed quite unlikely these would maximize the model performance. The deep neural network reported poorer
performance; one reason could be that the format of the data was not suitable for the code.
Then, average error rates increased with the sparse rate. When the number of active variables was higher,
the models tended to select the wrong variables. It seemed as if the models had a hard time learning and selecting the
true active variables with a high sparse rate, while they managed to report better C-indices. This was linked to the
variance-covariance structure chosen for data simulation.
With regards to evaluation metrics, Kim’s C-index has shown higher stability and robustness compared to
other metrics and stood for a criterion evaluating the entire set of events. Harrell’s C, on the other hand, was measured
at each event, making it difficult to interpret in terms of global performance.
Nevertheless, some limitations should be noted. The literature review presented several drawbacks. Publica-
tions whose objective was variable selection without explicit dimension reduction, such as Tong et al. [2009] and Chen
and Wang [2013] could not be captured because of the elaborated research strategy. Also, it was not always easy to
assess how the outcome was really considered, especially for neural networks which make little mention of the expected
structure to process the data. Furthermore, as mentioned above, the lack of hyperparameter optimization for variable
selection made BAR approach inconclusive. Also, a cross-validation would have highlighted the robustness of the
results [Heinze et al., 2018]. Furthermore, other evaluation measures have been used in the literature, e.g., the mean
square error, the mean absolute error, the log-likelihood [Wu, 2013, Zhao et al., 2018, Ullah et al., 2014]. An additional
way to investigate active variables would be to assess the importance of the variables by permutation [Fisher et al.].
By choosing a performance measure beforehand, this consists in permuting k times the order of the covariates and
calculating k times the performance of the model. Finally, the simulations scheme itself presented several drawbacks.
Covariates were not time-dependent and shared the same effect on the outcome, which may seem implausible in real
life and made the interpretation of the results hard to generalize. Also, although the simulation of the data maintained
censoring rates, it was not based on a distribution of censoring time, while one should be able to genuinely control them
[Wan, 2017, Pénichoux et al., 2015].
12Murris, et al. (2022) A P REPRINT
6 Conclusion
To the author’s knowledge, this study was the first to compare standard methods, variable selection algorithms, and a
deep neural network in modeling recurrent events in a high-dimensional framework.
Progress in medical care is leading to the use of embedded artificial intelligence (AI) technologies. One il-
lustration of this is the booming market for AI medical devices. Such systems are typically designed to prevent the
occurrence of events either at the hospital, elderly care home or outpatient setting, etc. Should these events be likely to
occur repeatedly, and should all available data/knowledge be captured, then thorough, robust and appropriate analysis
of recurrent events is crucial [Berisha et al., 2021].
Overall, this work raises many concerns for recurrent event data analysis in high-dimensional settings and
highlights the current need for developing further approaches and to assess their performance in a relevant manner.
7 Appendices
7.1 Data components for modeling recurrent events when using standard statistical approaches
7.1.1 Set of individuals at risk
Standard statistical models described do not encounter for individuals at risk in the same way. This induces prior data
management for appropriate application.
• The set of individuals at risk for the kth event comprised individuals who were at risk for the event. Different
definition existed for the set of individuals at risk, mainly based on baseline hazard function;
• The unrestricted set, in which each subject could be at risk for any event regardless of the number of events
presented, at all-time intervals;
• The restricted set contained only the time intervals for the kth event of subjects who had already presented
k − 1 events;
• The semi-restricted set contained for the kth event the subjects who had k − 1 or fewer events.
7.1.2 Timescales
Timescales also embody key components to address at the data management stage. Three common timescales are:
• Calendar time, in which the times denotes the time since randomization/beginning of the study until an event
occurs;
• Gap time, or waiting scale, resets the time to zero when an event occurs, i.e., it corresponds to the time elapsed
since the last event previously observed;
• Counting process is constructed as per calendar time, although it enables late inclusions and/or censoring.
Illustrations for timescales were provided in Figure 7.
13Murris, et al. (2022) A P REPRINT
Figure 7: Timescales in Recurrent Events Analysis
14Murris, et al. (2022) A P REPRINT
7.2 Further graphics from results
Figure 8: Variability of C-indices for Two Extreme Scenarios: Sparse Rate = 0%, p = 25 (A) and Sparse Rate = 25%,
p = 150 (B)
15Murris, et al. (2022) A P REPRINT
Figure 9: Evolution of Average Error Rates with Sparse Rate Equal to 0% (A), 25% (B) et 50% (C)
16Murris, et al. (2022) A P REPRINT
References
Guide to the methods of technology appraisal 2013. page 94, 2013.
Leila D. A. F. Amorim and Jianwen Cai. Modelling recurrent events: a tutorial for analysis in epidemiology. Interna-
tional Journal of Epidemiology, 44(1):324–333, February 2015. ISSN 1464-3685. doi:10.1093/ije/dyu222.
P. K. Andersen and R. D. Gill. Cox’s Regression Model for Counting Processes: A Large Sample Study. The Annals of
Statistics, 10(4):1100–1120, 1982. ISSN 0090-5364. URL https://www.jstor.org/stable/2240714.
Visar Berisha, Chelsea Krantsevich, P. Richard Hahn, Shira Hahn, Gautam Dasarathy, Pavan Turaga, and Julie Liss.
Digital medicine and the curse of dimensionality. NPJ digital medicine, 4(1):153, October 2021. ISSN 2398-6352.
doi:10.1038/s41746-021-00521-5.
Lucy M. Bull, Mark Lunt, Glen P. Martin, Kimme Hyrich, and Jamie C. Sergeant. Harnessing repeated measurements
of predictor variables for clinical risk prediction: a review of existing methods. Diagnostic and Prognostic Research,
4:9, 2020. ISSN 2397-7523. doi:10.1186/s41512-020-00078-z.
Anaïs Charles-Nelson, Sandrine Katsahian, and Catherine Schramm. How to analyze and interpret recurrent events
data in the presence of a terminal event: An application on readmission after colorectal cancer surgery. Statistics
in Medicine, page sim.8168, April 2019. ISSN 0277-6715, 1097-0258. doi:10.1002/sim.8168. URL https:
//onlinelibrary.wiley.com/doi/10.1002/sim.8168.
Xiaolin Chen and Qihua Wang. Variable selection in the additive rate model for recurrent event data. Compu-
tational Statistics & Data Analysis, 57(1):491–503, 2013. URL https://ideas.repec.org/a/eee/csdana/
v57y2013i1p491-503.html.
D. R. Cox. Regression Models and Life-Tables. Journal of the Royal Statistical Society: Series B (Method-
ological), 34(2):187–202, January 1972. ISSN 00359246. doi:10.1111/j.2517-6161.1972.tb00899.x. URL
https://onlinelibrary.wiley.com/doi/10.1111/j.2517-6161.1972.tb00899.x.
Aaron Fisher, Cynthia Rudin, and Francesca Dominici. All Models are Wrong, but Many are Useful: Learning a
Variable’s Importance by Studying an Entire Class of Prediction Models Simultaneously. page 81.
Garima Gupta, Vishal Sunder, Ranjitha Prasad, and Gautam Shroff. CRESA: A Deep Learning Approach to Competing
Risks, Recurrent Event Survival Analysis. In Qiang Yang, Zhi-Hua Zhou, Zhiguo Gong, Min-Ling Zhang, and
Sheng-Jun Huang, editors, Advances in Knowledge Discovery and Data Mining, Lecture Notes in Computer Science,
pages 108–122, Cham, 2019. Springer International Publishing. ISBN 978-3-030-16145-3. doi:10.1007/978-3-030-
16145-3_9.
Frank E. Harrell, Kerry L. Lee, and Daniel B. Mark. MULTIVARIABLE PROGNOSTIC MODELS: ISSUES IN
DEVELOPING MODELS, EVALUATING ASSUMPTIONS AND ADEQUACY, AND MEASURING AND
REDUCING ERRORS. Statistics in Medicine, 15(4):361–387, February 1996. ISSN 02776715, 10970258.
doi:10.1002/(SICI)1097-0258(19960229)15:43.0.CO;2-4. URL https://onlinelibrary.
wiley.com/doi/10.1002/(SICI)1097-0258(19960229)15:43.0.CO;2-4.
Georg Heinze, Christine Wallisch, and Daniela Dunkler. Variable selection - A review and recommendations for the
practicing statistician. Biometrical Journal, 60(3):431–449, May 2018. ISSN 03233847. doi:10.1002/bimj.201700067.
URL https://onlinelibrary.wiley.com/doi/10.1002/bimj.201700067.
Julian P. T. Higgins, James Thomas, Jacqueline Chandler, Miranda Cumpston, Tianjing Li, Matthew J. Page, and
Vivian A. Welch. Cochrane Handbook for Systematic Reviews of Interventions. John Wiley & Sons, September 2019.
ISBN 978-1-119-53661-1. Google-Books-ID: cTqyDwAAQBAJ.
Antje Jahn-Eimermacher. Comparison of the Andersen-Gill model with poisson and negative binomial regres-
sion on recurrent event data. Computational Statistics & Data Analysis, 52(11):4989–4997, 2008. ISSN 0167-
9473. URL https://econpapers.repec.org/article/eeecsdana/v_3a52_3ay_3a2008_3ai_3a11_3ap_
3a4989-4997.htm.
Antje Jahn-Eimermacher, Katharina Ingel, Ann-Kathrin Ozga, Stella Preussler, and Harald Binder. Simulating
recurrent event data with hazard functions defined on a total time scale. BMC Medical Research Methodology,
15(1):16, March 2015. ISSN 1471-2288. doi:10.1186/s12874-015-0005-2. URL https://doi.org/10.1186/
s12874-015-0005-2.
Bingzhong Jing, Tao Zhang, Zixian Wang, Ying Jin, Kuiyuan Liu, Wenze Qiu, Liangru Ke, Ying Sun, Caisheng He,
Dan Hou, Linquan Tang, Xing Lv, and Chaofeng Li. A deep survival analysis method based on ranking. Artificial
Intelligence in Medicine, 98:1–9, July 2019. ISSN 1873-2860. doi:10.1016/j.artmed.2019.06.001.
Eric S. Kawaguchi, Marc A. Suchard, Zhenqiu Liu, and Gang Li. A surrogate l0 sparse Cox’s regression with applications
to sparse high-dimensional massive sample size time-to-event data. Statistics in Medicine, 39(6):675–686, 2020. ISSN
1097-0258. doi:10.1002/sim.8438. URL https://onlinelibrary.wiley.com/doi/abs/10.1002/sim.8438.
17Murris, et al. (2022) A P REPRINT
Ji-Yeon Kim, Yong Seok Lee, Jonghan Yu, Youngmin Park, Se Kyung Lee, Minyoung Lee, Jeong Eon Lee, Seok Won
Kim, Seok Jin Nam, Yeon Hee Park, Jin Seok Ahn, Mira Kang, and Young-Hyuck Im. Deep Learning-Based
Prediction Model for Breast Cancer Recurrence Using Adjuvant Breast Cancer Cohort in Tertiary Cancer Center
Registry. Frontiers in Oncology, 11, May 2021. ISSN 2234-943X. doi:10.3389/fonc.2021.596364. URL https:
//www.frontiersin.org/articles/10.3389/fonc.2021.596364/full.
Sehee Kim, Douglas E. Schaubel, and Keith P. McCullough. A C-index for recurrent event data: Application to hospital-
izations among dialysis patients. Biometrics, 74(2):734–743, June 2018. ISSN 1541-0420. doi:10.1111/biom.12761.
Ann-Kathrin Ozga, Meinhard Kieser, and Geraldine Rauch. A systematic comparison of recurrent event models for
application to composite endpoints. BMC medical research methodology, 18(1):2, January 2018. ISSN 1471-2288.
doi:10.1186/s12874-017-0462-x.
R. L. Prentice, B. J. Williams, and A. V. Peterson. On the regression analysis of multivariate failure time data.
Biometrika, 68(2):373–379, 1981. ISSN 0006-3444, 1464-3510. doi:10.1093/biomet/68.2.373. URL https:
//academic.oup.com/biomet/article-lookup/doi/10.1093/biomet/68.2.373.
Juliette Pénichoux, Thierry Moreau, and Aurélien Latouche. Simulating recurrent events that mimic actual data:
a review of the literature with emphasis on event-dependence. arXiv:1503.05798 [stat], March 2015. URL
http://arxiv.org/abs/1503.05798. arXiv: 1503.05798.
Jennifer K. Rogers, Stuart J. Pocock, John J. V. McMurray, Christopher B. Granger, Eric L. Michelson, Jan Östergren,
Marc A. Pfeffer, Scott D. Solomon, Karl Swedberg, and Salim Yusuf. Analysing recurrent hospitalizations in heart
failure: a review of statistical methodology, with application to CHARM-Preserved. European Journal of Heart
Failure, 16(1):33–40, January 2014. ISSN 1879-0844. doi:10.1002/ejhf.29.
Noah Simon, Jerome Friedman, Trevor Hastie, and Rob Tibshirani. Regularization Paths for Cox’s Propor-
tional Hazards Model via Coordinate Descent. Journal of Statistical Software, 39(5), 2011. ISSN 1548-7660.
doi:10.18637/jss.v039.i05. URL http://www.jstatsoft.org/v39/i05/.
Evelina Tacconelli. Systematic reviews: CRD’s guidance for undertaking reviews in health care. The Lancet Infectious
Diseases, 10(4):226, April 2010. ISSN 1473-3099, 1474-4457. doi:10.1016/S1473-3099(10)70065-7. URL
https://www.thelancet.com/journals/laninf/article/PIIS1473309910700657/fulltext.
R. Tibshirani. The lasso method for variable selection in the Cox model. Statistics in Medicine, 16(4):385–395,
February 1997. ISSN 0277-6715. doi:10.1002/(sici)1097-0258(19970228)16:43.0.co;2-3.
Xingwei Tong, Liang Zhu, and Jianguo Sun. Variable selection for recurrent event data via nonconcave penalized
estimating function. Lifetime Data Analysis, 15(2):197–215, June 2009. ISSN 1572-9249. doi:10.1007/s10985-008-
9104-2.
J. Twisk, N. Smidt, and W. de Vente. Applied analysis of recurrent events: a practical overview. Journal of Epidemiology
and Community Health, 59(8):706–710, August 2005. ISSN 0143-005X. doi:10.1136/jech.2004.030759. URL
https://www.ncbi.nlm.nih.gov/pmc/articles/PMC1733116/.
Shahid Ullah, Tim J Gabbett, and Caroline F Finch. Statistical modelling for recurrent events: an application
to sports injuries. British Journal of Sports Medicine, 48(17):1287–1293, September 2014. ISSN 0306-3674.
doi:10.1136/bjsports-2011-090803. URL https://www.ncbi.nlm.nih.gov/pmc/articles/PMC4145455/.
J. W. Vaupel, K. G. Manton, and E. Stallard. The impact of heterogeneity in individual frailty on the dynamics of
mortality. Demography, 16(3):439–454, August 1979. ISSN 0070-3370.
Fei Wan. Simulating survival data with predefined censoring rates for proportional hazards models: Simulating censored
survival data. Statistics in Medicine, 36(5):838–854, February 2017. ISSN 02776715. doi:10.1002/sim.7178. URL
https://onlinelibrary.wiley.com/doi/10.1002/sim.7178.
Ping Wang, Yan Li, and Chandan K. Reddy. Machine Learning for Survival Analysis: A Survey. ACM Computing
Surveys, 51(6):110:1–110:36, 2019. ISSN 0360-0300. doi:10.1145/3214306. URL https://doi.org/10.1145/
3214306.
L. J. Wei, D. Y. Lin, and L. Weissfeld. Regression Analysis of Multivariate Incomplete Failure Time Data by Modeling
Marginal Distributions. Journal of the American Statistical Association, 84(408):1065–1073, 1989. ISSN 0162-1459.
doi:10.2307/2290084. URL https://www.jstor.org/stable/2290084.
Tong Tong Wu. Lasso penalized semiparametric regression on high-dimensional recurrent event data via coordi-
nate descent. Journal of Statistical Computation and Simulation, 83(6):1145–1155, 2013. ISSN 0094-9655.
doi:10.1080/00949655.2011.652114. URL https://doi.org/10.1080/00949655.2011.652114.
Hui Zhao, Dayu Sun, Gang Li, and Jianguo Sun. Variable selection for recurrent event data with broken adaptive ridge
regression. Canadian Journal of Statistics, 46(3):416–428, 2018. ISSN 1708-945X. doi:10.1002/cjs.11459. URL
https://onlinelibrary.wiley.com/doi/abs/10.1002/cjs.11459.
18You can also read


