In silico analysis of local RNA secondary structure in influenza virus A, B and C finds evidence of widespread ordered stability but little ...
←
→
Page content transcription
If your browser does not render page correctly, please read the page content below

www.nature.com/scientificreports
OPEN In silico analysis of local RNA
secondary structure in influenza
virus A, B and C finds evidence
of widespread ordered stability
but little evidence of significant
covariation
Jake M. Peterson, Collin A. O’Leary & Walter N. Moss*
Influenza virus is a persistent threat to human health; indeed, the deadliest modern pandemic was in
1918 when an H1N1 virus killed an estimated 50 million people globally. The intent of this work is to
better understand influenza from an RNA-centric perspective to provide local, structural motifs with
likely significance to the influenza infectious cycle for therapeutic targeting. To accomplish this, we
analyzed over four hundred thousand RNA sequences spanning three major clades: influenza A, B and
C. We scanned influenza segments for local secondary structure, identified/modeled motifs of likely
functionality, and coupled the results to an analysis of evolutionary conservation. We discovered 185
significant regions of predicted ordered stability, yet evidence of sequence covariation was limited to 7
motifs, where 3—found in influenza C—had higher than expected amounts of sequence covariation.
Influenza belongs to the segmented, single-stranded, negative-sense RNA Orthomyxoviridae family, occupying
four genera (Alphainfluenzavirus, Betainfluenzavirus, Gammainfluenzavirus, and Deltainfluenzavirus). Of these,
Alpha, Beta and Gamma are able to infect humans. Respectively, these genera consist of one species each: influ-
enza A, B and C. Within each genome, influenza A virus (IAV) and influenza B virus (IBV) consist of eight viral
RNA (vRNA) segments, and influenza C virus (ICV) consists of seven. IAV is considered the most threatening
species to human health, possessing multiple antigenically distinct sub-types that can infect human and non-
human hosts—allowing for the antigenic shifts that lead to global p andemics1,2. The deadliest example of this
for influenza was in 1918, when an H1N1 variant killed an estimated 50 million people g lobally3. Due to this
consistent threat, IAV has received a majority of our attention and resources; however, concerns over evolving
lineages of IBV continue to mount4. This development has led to the current quadrivalent vaccines, which pro-
tect against two IAV strains and both main IBV lineages (Victoria and Yamagata)5. ICV is associated with mild
respiratory symptoms in a majority of cases, however it has been found to cause serious illness in children6,7. All
three clades are therefore worthy of additional study.
It is imperative to continue to take the lessons learned during prior pandemics and apply them toward future
potential threats. Work from the first SARS outbreak led to a World Health Organization response model that was
tested against the H1N1 o utbreak8. Despite the considerable action taken prior to the outbreak, vaccine supply
and distribution met a number of roadblocks that decreased efforts to slow its spread8. These impairments were
improved upon and ultimately tested by the severe acute respiratory syndrome coronavirus 2 (SARS-CoV-2)
pandemic. Development and approval time of SARS-CoV-2 vaccines were on an unprecedented time scale,
becoming the new model for future pandemics9.
This new prevention model can be reapplied to influenza, however the biggest issue in influenza vaccine
development is target availability. Current influenza vaccines involve an antibody response to the head domain
of the hemagglutinin protein, one of two viral surface p roteins2,9. The targeting of surface proteins is a common
therapeutic approach, but influenza’s hemagglutinin is a particularly variable target, resulting in vaccines with
Roy J. Carver Department of Biophysics, Biochemistry and Molecular Biology, Iowa State University, Ames, IA 50011,
USA. *email: wmoss@iastate.edu
Scientific Reports | (2022) 12:310 | https://doi.org/10.1038/s41598-021-03767-x 1
Vol.:(0123456789)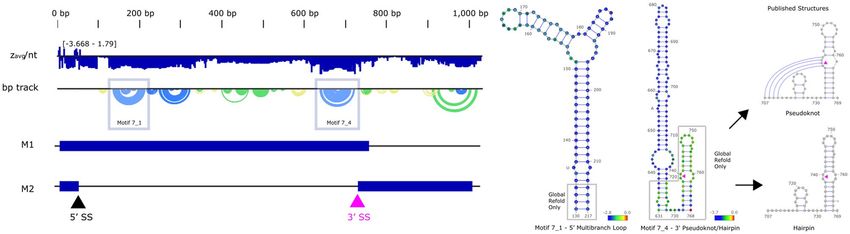
www.nature.com/scientificreports/
short shelf lives and limited efficacy9. Advances in vaccine production (e.g., mRNA vaccines9) hold great promise
in mitigating flu-related illnesses and death, yet there still remains a critical time gap between viral discovery
and vaccine distribution. In that gap, it is necessary to have effective treatments for dealing with active infec-
tions. Only four drugs are FDA-approved for the treatment of influenza, with many influenza strains already
evolving some level of drug-resistance10. Additional therapeutic modalities for treating influenza infections are
therefore sorely needed.
One alternative approach would be the targeting of conserved RNA secondary structures critical to the viral
life cycle. For example, recent work on enterovirus has found an RNA stem loop that undergoes a conforma-
tional change when an inhibitor is used, repressing translation11. This example is novel in that the 5ʹ UTR of the
mRNA forms an internal ribosome entry site (IRES) to promote cap-independent translation, and that a small
molecule library was used to effectively target RNA structure in the IRES11. Similar work was conducted against
the SARS-CoV-2 frameshift stimulatory element, using small molecules to disrupt the secondary structure and
inhibit a critical ribosomal frameshift12. While knowledge of what constitutes a “good” viral RNA target remains
nascent, and there exist few examples within literature, it is imperative to develop a list of novel therapeutic targets
using the tools currently available. With this in mind, it is useful to revisit and thoroughly define the influenza
structurome to gain new insights on potential therapeutic targets.
Almost a decade ago, all three major clades of influenza were analyzed for conserved RNA secondary struc-
tural motifs in silico13,14. Subsequent experimental work focused on validation of local structural motifs15–22,
testing their potential function23 and building global secondary structure models of their genomic vRNA24
and individual positive-sense RNAs25. More recent work using chemical crosslinking coupled to RNA-seq has
focused on defining long-range intra- and inter-segmental RNA-RNA interactions that could be significant to
genome packaging26. Despite this extensive in silico and experimental work on influenza structure/function,
space remains for additional analyses—particularly those significant to drug discovery. This provided the motiva-
tion for our current study, where we apply the ScanFold pipeline to influenza virus. ScanFold is a program
that divides the analysis of RNA secondary structure into two steps: firstly, long sequences are decomposed into
multiple overlapping analysis windows, where each fragment is folded in silico and various thermodynamic
properties are calculated; secondly, models of structure and predicted ordered biases in structure are combined
to generate consensus base pairs that are weighted by their contribution to unusual ordered-stability. In this way,
ScanFold provides local scans of the folding landscape across an RNA and discrete local motifs with high
propensity for ordered (likely evolved) structural m otifs27.
In contrast to previous analyses of influenza, which focused on individual windows and limited h omology14,
our current approach focuses on a single sequence and is able to define motifs (and their extent) in a robust and
reproducible manner. For example, ScanFold has been successfully applied to analyze the genomes of Zika
and HIV27, human herpes v iruses28 and most recently to SARS-CoV-2—where models were used to rationally
design a small molecule inhibitor of viral frameshifting29. An additional motivation for this current study is the
analysis of conservation of motifs of interest. Most previous studies of influenza virus RNA secondary structure
applied simple conservation metrics that were unable to define statistically significant covariation. In this cur-
rent work we sought to assess structure-related sequence covariation using rigorous methods. Thus, by revisiting
influenza with contemporary approaches, we hope to provide additional basic insights to guide investigations
into influenza biology and to expand the list of potentially druggable RNA motifs in these viruses.
Results
Maps of local RNA structural propensity across influenza A, B and C. To generate maps of local
secondary structural propensities, each segment and strand of IAV, IBV, and ICV was submitted to ScanFold-
Scan for analysis (46 RNAs accounting for 81,892 nucleotides of sequence data scanned). IAV sequences (A/
Puerto Rico/8/1934) were selected due to their prevalence in experimental studies, while IBV and ICV reference
sequences (B/Lee/1940 and C/Ann Arbor/1/50, respectively) were selected to provide structural data applica-
ble to the broadest range of viral targets. A scanning window of 120 nucleotides (nt) with a single nt step size
resulted in over 75,000 almost fully overlapping (119 nt) analysis windows. For each window scanned, several
key features were predicted: a minimum free energy (MFE) secondary structure and its associated change in
Gibb’s folding free energy (ΔG°, a measure of thermodynamic stability); a thermodynamic z-score that com-
pares the MFE ΔG° of the natively ordered sequence to the average ΔG° of 100 randomly shuffled versions of
the sequence (z-score, the stability order-bias of the sequence); a partition function, from which is derived an
ensemble centroid structure (best representative of the ensemble of probable conformations); and the ensemble
diversity (ED, an indication of the volatility of the structural ensemble). Overviews of every RNA scanned are
available in Supplemental File 1, and the raw data may be accessed on the RNAStructuromeDB (see “Data avail-
ability”).
A summary of average ScanFold-Scan results for each clade, segment and strand can be found in Table 1.
One of the key features of this analysis is the mapping of local z-scores across each influenza segment and strand
using an approach adapted from Clote et al.30. The z-score metric is an indication of unusual ordered-stability,
where negative values indicate the number of standard deviations more stable the MFE ΔG° of the natively
ordered sequence is versus a pool of randomly shuffled sequences, which can indicate that a sequence has been
driven by evolution to fold into a stable secondary structure. Alternatively, higher z-scores indicate a higher,
less stable predicted MFE ΔG° versus the shuffled pool, signifying an evolutionarily driven region that breaks
up native pairing contacts. A broad picture of the range of z-scores can be seen in Fig. 1. IAV had an overall
average z-score (zavg) of −0.51 ± 1.14 and −0.53 ± 1.14 for the positive and negative strand, respectively, IBV had
−0.56 ± 1.11 and −0.60 ± 1.07, and ICV had −0.63 ± 1.12 and −0.63 ± 1.08. The negative trend observed in these
Scientific Reports | (2022) 12:310 | https://doi.org/10.1038/s41598-021-03767-x 2
Vol:.(1234567890)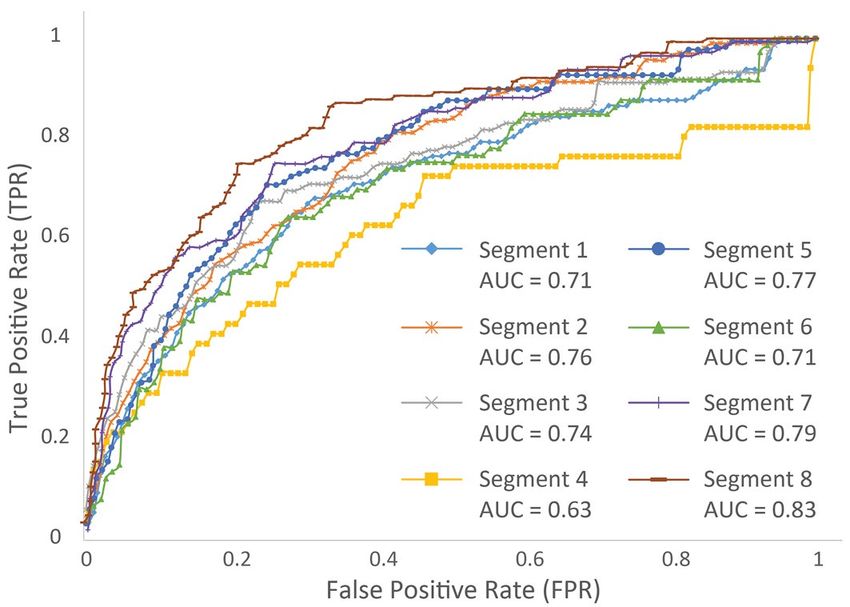
www.nature.com/scientificreports/
zavg & std dev % zavg/nt % zavg/nt % zavg/nt # < −2 motifs
Type & segment (+ / −) < − 0 (+ / −) < − 1 (+ / −) < − 2 (+ / −) (+ / −)
IAV 1 − 0.40 ± 0.98/− 0.44 ± 1.06 62.51/64.36 26.78/29.30 5.90/7.83 2/5
IAV 2 − 0.63 ± 1.20/− 0.63 ± 1.10 64.99/67.82 33.21/32.72 13.86/13.41 8/7
IAV 3 − 0.41 ± 1.05/− 0.26 ± 1.13 65.52/54.40 25.54/23.27 6.43/8.80 5/5
IAV 4 − 0.07 ± 0.84/− 0.42 ± 1.00 53.10/63.17 12.24/29.17 0.90/6.81 6/3
IAV 5 − 0.48 ± 1.05/− 0.62 ± 1.19 64.45/64.18 27.66/34.51 9.96/17.15 7/4
IAV 6 − 0.33 ± 1.18/− 0.40 ± 1.13 54.33/58.11 25.19/28.36 8.89/11.13 2/5
IAV 7 − 1.19 ± 1.23/− 0.69 ± 1.23 83.04/71.26 51.76/36.01 26.87/15.42 5/5
IAV 8 − 1.21 ± 1.42/− 1.24 ± 1.22 79.64/84.18 55.25/57.72 28.40/25.68 6/6
IBV 1 − 0.42 ± 1.20/− 0.69 ± 1.15 61.49/69.41 30.46/40.28 10.45/14.01 8/6
IBV 2 − 0.53 ± 1.03/− 0.71 ± 1.10 70.28/74.20 32.68/36.42 8.07/12.08 2/6
IBV 3 − 0.54 ± 0.96/− 0.64 ± 1.07 69.50/71.32 32.66/39.52 6.43/8.54 1/5
IBV 4 − 0.77 ± 1.05/− 0.35 ± 1.04 75.55/60.35 37.15/24.11 12.71/8.11 2/2
IBV 5 − 0.85 ± 1.08/− 0.66 ± 0.91 74.56/76.66 42.45/32.23 16.03/7.96 4/2
IBV 6 − 0.16 ± 1.13/− 0.57 ± 1.06 52.43/69.05 17.80/31.85 7.86/9.25 2/4
IBV 7 − 0.83 ± 1.05/− 0.58 ± 1.02 77.99/71.83 41.32/38.53 12.50/7.56 3/1
IBV 8 − 0.43 ± 1.11/− 0.46 ± 1.16 63.97/64.07 27.33/29.89 8.90/11.57 1/2
ICV 1 − 0.33 ± 1.02/− 0.39 ± 0.97 62.39/64.44 27.09/23.17 4.99/6.95 2/2
ICV 2 − 0.39 ± 0.97/− 0.64 ± 0.94 64.44/73.51 23.17/32.59 6.95/8.86 5/2
ICV 3 − 0.77 ± 1.18/− 0.60 ± 1.07 70.88/67.44 40.26/31.54 17.34/12.31 12/4
ICV 4 − 0.95 ± 1.03/− 0.91 ± 1.00 80.66/80.86 49.28/46.16 14.79/14.74 0/5
ICV 5 − 0.77 ± 1.21/− 0.56 ± 1.32 75.12/62.38 38.57/29.03 15.11/9.42 7/3
ICV 6 − 0.55 ± 1.34/− 0.66 ± 1.20 59.75/70.88 30.16/30.82 15.93/14.89 4/3
ICV 7 − 0.78 ± 0.93/− 0.69 ± 1.01 79.53/74.88 40.07/29.17 9.19/13.36 1/3
Table 1. Average ScanFold metrics and extracted motifs for each strand. “% zavg/nt” is the percentage of
nucleotides that had zavg scores below the given threshold. “# < −2 Motifs” is the number of extracted motifs for
each strand below the −2 z− score threshold, totaling 185.
Figure 1. z-score violin plots of each influenza virus, with positive (blue) and negative (red) strands for
comparison. While the range of z-scores observed is broad, there is a visual trend toward the negative
(structured) across all clades, with IAV segments 7 and 8 being noticeably lower than other segments. Data from
ScanFold, 120 nt window, 1 nt step, 100 randomizations, 37 ˚C. Image adapted from BoxPlotR51.
data indicate some potential for influenza being inherently structured and are in-line with previous predictions
performed on influenza, which found similar skews in predicted z-score31.
Notably, only IAV positive segment 7 (−1.19 ± 1.23), IAV positive segment 8 (−1.21 ± 1.42), and IAV negative
segment 8 (−1.24 ± 1.22) had z avg below −1, indicating that they are globally ordered. Only these segments/strands
approached the z-score values we29 (and o thers32) recently predicted for the genome of SARS-CoV-2 (average
29
z-score −1.49 )—raising interesting questions about the potential roles of globally ordered RNA structure in each
RNA. In SARS-CoV-2, a likely role is in genome packaging and post-transcriptional gene regulation, whereas in
influenza, which consists of minus (−) sense vRNAs that are packaged and plus ( +) sense RNAs, the likely role is
post-transcriptional control and genome replication/packaging. Potential evolutionary pressure to form struc-
tures useful in post-transcriptional gene regulation and packaging are likely different for the (−) versus the ( +)
RNAs, but as these RNAs comprise sense/antisense pairs, such pressures are likely to have “echoes” across each
strand. Thus, the forces working on influenza RNA structure are likely more complex than those of SARS-CoV-2.
Even in segments/strands without global z-score biases, however, significantly low regions were observed
(Supplemental File 1). This can be assessed from the percentage of nucleotides per segment with z-scores below
a given threshold, the % z avg/nt (Table 1). This latter metric was calculated in the second ScanFold stage,
Scientific Reports | (2022) 12:310 | https://doi.org/10.1038/s41598-021-03767-x 3
Vol.:(0123456789)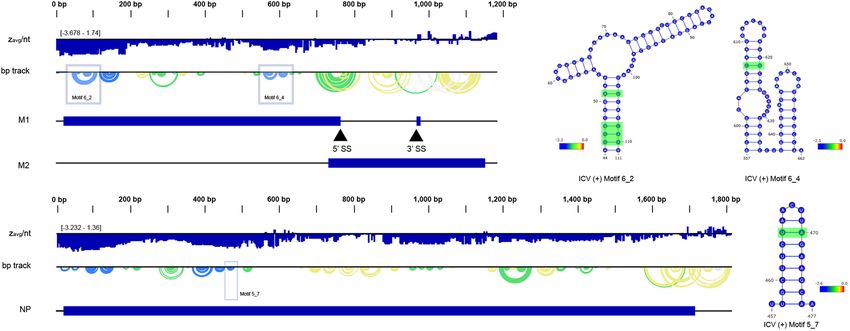
www.nature.com/scientificreports/
Figure 2. (Left) ScanFold data for IAV 7 ( +), with motif 7_1 and 7_4 designated by a blue box. M1 and M2
versions of this transcript are illustrated for reference. The base pair track (bp track) shows arcs correlating to
base pairings, where blue arcs have a < −2 score, green arcs have a < −1 z-score, yellow arcs have a < 0 z-score,
and gray arcs have a z-score > 0. (Right) Motif 7_1 correlates with the published multibranch loop23, aligning
with our reference sequence after global refold (gray boxes). Motif 7_4 has an extended hairpin that occludes
any formation of the 5′ pairing or pseudoknot structure around the 3′ splice site (739–740, purple triangles),
but a global refold reveals the published 3′ pairing25. Two sequence variations from our reference sequence are
annotated at 136 and 655. ScanFold z-scores are overlaid in each nucleotide circle, with blue designating < −2
z-score. Structural images were adapted from VARNA, and the genome illustrations were adapted from NCBI.
ScanFold-Fold (further discussed in the next section), where overlapping window z-score values are parti-
tioned per nucleotide—giving a per-nucleotide metric to assess propensity for ordered stability. Here, it becomes
more apparent that influenza is predominantly biased toward ordered structure, as a majority of nucleotides
showed a predominant shift toward negative z avg/nt. Further lowering the z avg/nt threshold to below −2, the
percentages range from a high of 28.40% for IAV 8 ( +) and a low of 0.90% for IAV 4 ( +). Interestingly, IAV 4
( +) still had 6 predicted motifs with at least one unusually stable (< −2 z avg) base pair (bp). Potential implica-
tions of this are the existence of structure within influenza sequences, with varying degrees of structure across
each segment. These regions were of particular interest, and were further analyzed to address this implication.
Identification of local motifs with propensity for ordered stability and potential functional-
ity. In the second stage of our analysis, ScanFold-Fold was used to identify the base pairs that most con-
tributed to low z-score windows identified by ScanFold-Scan. This was accomplished by generating z-score
weighted consensus structures where recurring base pairs in overlapping low z-score windows are favorably
weighted. This resulted in numerous low z-score base pairs across influenza virus RNAs (listed in Table 1 and
Supplemental File 1). A major feature of ScanFold-Fold is that z-score weighted consensus base pairs can
be partitioned into discrete and unique local structural motifs. An example of these motifs can be seen at the
3ʹ end of ICV 5 (−), where three motifs are predicted in close proximity (1642–1678, 1684–1744, 1747–1800)
(Supplemental File 1). While ICV 5 (−) has a z avg of −0.56 ± 1.32, the range from 1642 to 1800 nt has a z avg of
−4.21 ± 0.63. This is the lowest zavg observed for any predicted motif. The total number of motifs with at least
one unusually stable bp was 185 across the 46 sequences motifs (all 185 motifs, locations, and structures are
available in Supplemental File 2). Notably, ICV 3 ( +) had 12 motifs, 7 of which have zavg below −2 (sequence
and zavg, respectively: 328–353 nt, −2.09 ± 0.53; 357–403 nt, −2.29 ± 0.18; 908–988 nt, −2.34 ± 0.40; 1984–2006 nt,
−2.10 ± 0.08; 2009–2023 nt, −2.40 ± 0.03; 2026–2066 nt, −2.51 ± 0.08; 2070–2129 nt, −2.33 ± 0.04).
Several structural motifs were previously reported for IAV ( +)14,16–21,23,25. We were able to recapitulate one
of them fully in our current analysis (Fig. 2), a multibranch loop from IAV 7 ( +)23. This motif, designated 7_1,
has a zavg of -2.31 ± 0.27. While the published structure was from a different sequence than that used to generate
our ScanFold data (AF389121.1 vs. NC_002016.1, respectively), the two sequences are 99.4% identical. The
ScanFold motif is slightly shorter than the previously published structure (130–217 vs. 134–213), which was
predicted using RNAz33. The four basal stem base pairs are absent in the ScanFold model, as they fell above
the -2 z-score cutoff used to define motifs, and were therefore excluded prior to refold via RNAfold33. Notably,
if the entire segment is refolded using the low z-score (< −2) structure as a folding constraint, the resulting global
model restores these pairs (see “Data availability”). In general, ScanFold motifs are small, as the goal of the
program is to identify highly-stable local folds.
All but one of the remaining published motifs analyzed contain pseudoknot structures (non-nested base
pairs). The folding algorithm used in ScanFold, RNAfold, is unable to predict pseudoknots due to the com-
plexity of non-nested pairing, and instead predicts the nested MFE for a given window. ScanFold predicted
motifs near the previously published IAV 7 ( +)25,34 pseudoknot/hairpin spanning the 3’ splice site of this RNA,
but failed to reconstruct the pseudoknot (Fig. 2). This conserved region is vital for the alternative splicing and
production of the ion channel protein M 234. The pseudoknot and hairpin conformations share two internal
pairings (5′, 714–727, and 3′, 732–768) with a non-nested pairing (707–742) forming only in the pseudoknot
conformation. Using a -2 threshold to extract motifs, the 5′ and non-nested pairings were overpowered by the
upstream motif IAV ( +) 7_4 (637–722), while the 3′ pairing did not meet the threshold. Lowering the threshold
to -1, the 3′ pairing can be partially recovered. Further, a global refold at either z-score threshold resulted in a
Scientific Reports | (2022) 12:310 | https://doi.org/10.1038/s41598-021-03767-x 4
Vol:.(1234567890)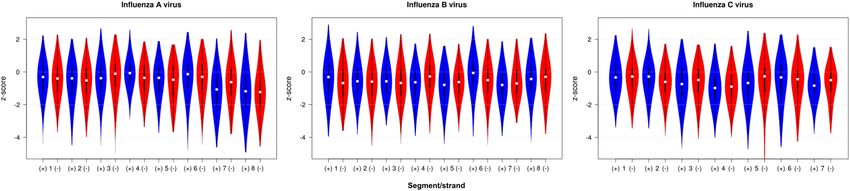
www.nature.com/scientificreports/
Figure 3. ScanFold analysis for motifs (top to bottom panels, respectively) IAV ( +) 4_1, IAV (−) 6_3, IBV
(−) 1_3, and IBV (−) 4_2 (locations designated with blue boxes). The base pair track (bp track) shows arcs
correlating to base pairings, where blue arcs have a < −2 score, green arcs have a < −1 z-score, yellow arcs have
a < 0 z-score, and gray arcs have a z-score > 0. The R-Scape calculations showed observed base pair covariance
(highlighted in green), but the number of observe covarying pairs fell below the expected value (given the
sequence alignment). ScanFold per nt zavg are overlaid in each nucleotide circle, with blue designating < −2
zavg. Structural images were adapted from VARNA, and the genome illustrations were adapted from NCBI.
near complete recovery of the 3′ pairing. IAV ( +) 7_4 is able to occlude the 5′ and non-nested pairings due to the
structure’s low z avg (-2.78 ± 0.45), whereas the 5′ pairing fell above the default threshold (−1.44 ± 0.63). It should
be noted that the initial research that predicted this pseudoknot did not find any low z-score structures in this
region; rather, the potential for structure was deduced from analysis of constraints on codon evolution25. The
pseudoknot was then modeled using DotKnot35, which uses pairing probabilities in a heuristic approach for
non-nested base pair identification25.
Beyond these previously-described motifs, novel structures were also predicted. To assess evolutionary evi-
dence for conserved structure within each motif, we performed covariation analysis. Much of the initial work on
structure conservation in influenza virus focused on simple metrics of conservation (e.g., the percent preserva-
tion of base pairing across alignments) and highlighted potentially supportive mutations; however, the statistical
significance of such variation was not previously assessed. Recently, powerful and user-friendly approaches have
emerged for covariation analysis of RNA s tructure36–38, which can identify statistically-significant c ovariation39,40.
We performed covariation analysis using the cm-builder pipeline36, which chains together the homology
discovery suite Infernal38 with R-Scape40 to provide a robust statistical framework for assessing the poten-
tial significance of sequence covariation (structure supporting mutations). Covariance analysis was conducted
against a database of 438,519 influenza sequences available from the NCBI Influenza Virus Database (see Mate-
rials and Methods).
Only 7 out of 185 low z-score motifs had any covariation identified by R-Scape (examples in Figs. 3 and 4,
all motifs available in Supplemental File 2, and covariance data available in Supplemental File 3). Of those, only
3 motifs (ICV ( +) 5_7 vs. all databases, and ICV ( +) 6_2 and 6_4 vs. ICV database) had observed covarying base
pairs above the expected number predicted for the input alignment. Covariance calculations for motif IBV (−)
4_2 (1725–1835) showed 4 bp observed to covary with 29.5 ± 1.2 bp expected. The highest number of covarying
base pairs were observed in ICV ( +) motif 6_2 (44–111) (Fig. 4); 4 bp were observed with 0.0 ± 0.1 bp expected
within the ICV database. ICV ( +) 6_4 (557–662) was predicted to have 1 observed bp against the ICV database,
Scientific Reports | (2022) 12:310 | https://doi.org/10.1038/s41598-021-03767-x 5
Vol.:(0123456789)www.nature.com/scientificreports/
Figure 4. ScanFold analysis for motifs ICV ( +) 6_2 and 6_4 (blue boxes, upper panel) and 5_7 (lower panel).
The base pair track (bp track) shows arcs correlating to base pairings, where blue arcs have a < −2 score, green
arcs have a < −1 z-score, yellow arcs have a < 0 z-score, and gray arcs have a z-score > 0. The R-Scape results
for ICV ( +) 6_2 had 4 bp observed to covary (highlighted in green) with 0.0 ± 0.1 bp expected, while 6_4 had 1
observed bp with 0.0 ± 0.0 bp expected. ICV ( +) 5_7 showed a single observed bp when 0.0 ± 0.2 were expected.
ScanFold per nt zavg are overlaid in each nucleotide circle, with blue designating < −2 zavg. Structural images
were adapted from VARNA, and the genome illustrations were adapted from NCBI.
with 0.0 ± 0.0 bp expected (Fig. 4). Only one motif, the 8 bp hairpin ICV ( +) 5_7 (456–477), showed evidence
of broad conservation across multiple influenza clades (Fig. 4). ICV ( +) 5_7 showed a single observed covary-
ing base pairing when 0.0 ± 0.2 were expected. These results were based on 24 sequences (13 IAV, 11 ICV), all
coding for the segment 5 nucleocapsid protein. All 24 sequences align with our IAV 5 ( +) reference sequence
from ~ 1139–1165, with the IAV sequences containing up to an 8-nucleotide insertion not seen in ICV. Interest-
ingly, this insertion aligns within ICV ( +) 5_7’s hairpin loop without disrupting the existing structure. Looking
at IAV ( +) 5 in this region (Supplemental File 2), the ordered motif IAV ( +) 5_4 was predicted in this region
(1145–1159), but failed to refold as an individual motif due to only consisting of two base pairs. The global refold
maintains this motif, however, and can be seen as a very small arc next to IAV ( +) 5_3 (Supplemental File 1).
Comparison of ScanFold predicted structures to available DMS‑MaPseq data. Using pub-
licly available probing data for IAV (H1N1 strain)41, we were able to conduct a receiver operating characteristic
(ROC) analysis comparing DMS-MaPseq data to all ScanFold -1 ΔG z-score predicted structures within all
8 positive-sense IAV segments (see “Methods” for greater detail). Briefly, reactivity values are constrained from
lowest to highest values at regular (e.g., 1%) intervals and constrained positions are considered to be paired at
their corresponding thresholds. Here, constrained DMS-MaPseq datasets were cross referenced to ScanFold
predicted structures to yield a true positive rate (TPR) and a false positive rate (FPR) of prediction. The results of
this analysis (Fig. 5 and Supplemental File 4) showed that ScanFold predicted structures had a non-random fit
and agreed well with the probing data. In an ROC analysis, the area under the curve (AUC) is a measure of how
well the data fit and an AUC value of 0.5 would indicate a random fit and a value of 1.0 would indicate a perfect
fit. ScanFold predicted structures for all 8 IAV segments had AUCs which ranged from 0.63 for segment 4 and
up to 0.83 for segment 8 (Fig. 5).
Discussion
Influenza RNAs consist of a short (~ 25 nt) untranslated region followed by one large (or multiple overlapping)
open reading frame(s). Maintenance of coding potential is a strong evolutionary constraint that can severely
limit the available compensatory mutations that also preserve functional RNA structures (e.g., base pairs from
wobble sites in codons)14,21. In fact, the reciprocal effect of structure on codon use led to the initial discoveries of
several elements including the IAV 7 ( +) pseudoknot/hairpin s tructure14,25. Prior research using mutual infor-
mation, assessing linkages between evolving sites, found signal across several stem-loop structures identified in
representative strains of hemagglutinin (segment 4) RNA17. This was observed to be most prominent in H5 and
H7 subtypes, with varying representation across all 16 s ubtypes17. However, Gultyaev et al. had noted in prior
research that it was difficult to maintain significance across all subtypes due to the vast number of influenza vari-
ants, and that covariance was most likely subtype-specific18. Unfortunately, this hypothesis was not supported
by a follow-up analysis using our A/Puerto Rico/8/1934 H1N1 strand against all known IAV H1N1 variants; no
covarying base pairs were observed across all segments and strands. It should be noted here that the absence of
covariation in RNA structure is not necessarily evidence of a lack of f unction37, and that the work to identify
these structures should not be dismissed outright based on this one method.
Scientific Reports | (2022) 12:310 | https://doi.org/10.1038/s41598-021-03767-x 6
Vol:.(1234567890)www.nature.com/scientificreports/
Figure 5. A receiver operating characteristic (ROC) analysis comparing in silico ScanFold −1 z-score
predicted structures to DMS-MaPseq data for IAV (H1N1) segments 1–8. The true positive rate (TPR) is shown
on the y-axis and the false positive rate (FPR) on the x-axis. Each segment is shown with a unique color and data
point marker: segment 1, light blue and a diamond; segment 2, orange and an asterisk; segment 3, grey and an
x; segment 4, yellow and a square; segment 5, dark blue and a circle; segment 6, green and a triangle; segment 7,
purple and a cross; segment 8, maroon and a dash. The associated area under the curve (AUC) is shown below
each segment in the legend.
Given the deep pool of sequences and the ordered structural stability seen across influenza (Fig. 1), the
relative scarcity of covariance is initially quite surprising. These findings echo recent debates over the potential
covariation in structured long noncoding (lnc)RNAs, where initial analyses using R-Scape found little evidence
of covariation in key lncRNAs (such as Xist and HOTAIR), despite numerous studies that supported structure
models and functions for them40,42. Subsequent work challenged this finding43, however the significance of covari-
ation in these RNAs remains a point of contention. Similarly, previous studies posited the existence of conserved
structural elements which were (at least for IAV) subjected to subsequent structural probing20,21,23,24,44–46 and
functional analyses13,14,17–19,22,25,31. No motifs with statistical evidence of covariation were found in IAV, and the
few hits we did observe were in ICV; indeed, the only motif with wide conservation (across clades) was found
in ICV. With this is in mind, it appears that only a few motifs in influenza are evolving under strict structural
constraints.
Our previous study of SARS-CoV-2 found similar results in that, despite extensive evidence of ordered stabil-
ity, only 57 out of 524 motifs showed evidence of covariation29. It may be that viral RNA secondary structures can
be extensively ordered to fold into stable conformations, but that the evolutionary pressures acting on them are
fairly loose. Namely, ordered RNA secondary structural stability may be important for viral function, but specific
base pairs may not be strongly selected for by evolution. The idea that some viral RNA secondary structures,
particularly in influenza, may be under loose structural constraints is supported from recent work on IAV using
chemical crosslinking. Extensive long-range intra- and inter-segmental RNA-RNA interactions were identi-
fied in IAV using the method 2 CIMPL44. An interesting finding of this study was that ablating inter-segmental
base pairs had less of an impact on viral reassortment than one would predict due to multiple redundant inter-
segmental interactions44. It may be possible that a similar pattern of redundancy is at play within local influenza
RNA structures.
Additionally, our previous SARS-CoV-2 analysis noted that, despite the ScanFold results being purely in
silico, they were in agreement with a variety of structure probing data sets (determined via ROC analyses) and
that significantly low z-score structures agreed best with probing d ata29. Interestingly, we observe similar levels of
agreement of ScanFold predicted structures to available probing data for IAV in this study (via ROC analysis).
Furthermore, when previous ScanFold analyses were performed with incorporation of probing data, global
trends in the ΔG z-scores were largely unaffected29 indicating that the z-score metric can highlight significantly
stable regions with or without probing data. Significantly, the z-score metric can highlight interesting trends
in the data. For example, in Table 1 there are remarkable biases predicted across different segments/strains.
For example, in IAV the two spliced segments (IAV 7 and 8; Table 1) were the only ones to have evidence for
global structural ordering (overall z-score < −1 across the sequence) in the ( +)RNA. Notable, in IAV 7 here is a
significant strand bias for ordered folding favoring the ( +)RNA that is not the case for IAV 8—suggesting that
structure plays more significant roles in the ( +)RNA of IAV 7, potentially for splicing, vs. the genomic (−)RNA.
Whereas, in IAV 8 structure could be significant to both the ( +)RNA and (−)RNA; in the latter case, perhaps in
genomic packaging. These interpretations are, however, complicated by the lack of global ordering in the spliced
segments from IBV and ICV: IBV 8 and ICV 6/7. When focusing on local regions near the splice sites, however,
instances of ordered structure were predicted at the 5′ splice sites of IBV 8 (nt 75) and ICV 7 (nt 213) both fall
within motifs comprised of z-score < -1 base pairs (Supplemental File 1); however, the 3′ splice sites: IBV 8 nt 731
, ICV 6 nt 753, ICV 6 nt 902, ICV 7 nt 527 nt were not embedded in predicted motifs. One notable limitation of
Scientific Reports | (2022) 12:310 | https://doi.org/10.1038/s41598-021-03767-x 7
Vol.:(0123456789)www.nature.com/scientificreports/
our approach is that ScanFold cannot predict pseudoknots, which were previously proposed for the 3′ splice
sites of IBV and I CV13. Notably, structural dynamics between pseudoknots and hairpins may also be significant
for splicing of influenza; the static weighted-consensus structures of ScanFold would not reflect this either.
Another interesting consideration is the potential roles of ordered structure in constraining influenza
sequence evolution. As noted above, the bulk of each genome segment is comprised of coding sequence (some-
times multiple ones), which is a major constraint. Focusing on the 12 low z-score base pairs (< -2) that fell within
coding regions, the majority (8/12) had at least one paired nucleotide falling within a wobble position, while 3
base pairs had both nts falling within wobble positions. These observations are in-line with previous work on IAV,
which noted localized suppression of synonymous codon u sage47, which was found to overlap previous predic-
tions of conserved RNA secondary s tructure14, which may be constraining available synonymous substitutions.
Conclusion
ScanFold provides comprehensive in silico analyses of structure within the three major clades of influenza
virus. This work complements previous investigations in its focus on the discovery and advancement of local
motifs of interest. While not as structured as SARS-CoV-2, ScanFold analysis shows influenza to have a
propensity toward structure on the whole. Further, little covariance within influenza is statistically significant,
perhaps owing to the sheer magnitude of similar variants that make covariance a difficult metric for the analysis
of influenza18,42. The presented report also highlights significantly low z-score regions, which have been shown
to correlate well with highly structured s equences29. The identification of 185 novel motifs in this work will
hopefully lower the barrier to entry for further structure/function analysis of influenza. Further, the motifs
provided here, alongside previously described structures, represent high-value targets for additional work to:
(i) analyze their functions, (ii) develop 3D models combining computational and biophysical techniques, and
(iii) assess their druggability.
Methods
ScanFold analysis. Segment nucleotide sequences were downloaded from NCBI for A/Puerto Rico/8/1934
for IAV, B/Lee/1940 for IBV, and C/Ann Arbor/1/50, for ICV (all accession numbers are available in Supple-
mental File 2). ScanFold27 was applied to these sequences, utilizing a 1 nt step, 120 nt window size, 100
randomizations, 37 ˚C on positive and negative strands. These ScanFold parameters have been previously
optimized27,48,49. All ScanFold Data is available at RNAStructuromeDB50.
To focus on local motifs most probable to be structured, the ScanFold 120 nt window, positive and nega-
tive strands, < −2 z-score results were the focus of further evaluation. Motif structures were then extracted, with
motifs being considered separate if they had at least two nucleotides between structures. These structures were
then refolded via the ViennaRNA package RNAfold 33, and any structures that completely unfolded were
removed from the motif pool. The only exception was IAV 4 ( +), which lacked any < −2 z-score motifs. In this
case, the < −1 results were included for covariance analysis. Known motifs (e.g., the IAV 7 ( +) pseudoknot) were
also manually added to the motif pool for covariance modeling.
Covariance. With highly structured motifs now available, the cm-builder script37 was used to build a
covariance model for each segment and database. This script utilizes Infernal38, RNA Framework36, and
R-Scape40 to analyze motifs against sequence databases, resulting in a list of highly structured and highly
conserved motifs. The influenza nucleotide databases were downloaded from the NCBI Influenza Virus Data-
base, selecting for each type, filtering for full-length only, and collapsing identical sequences. These sequences
were downloaded on 12 January 2021, resulting in 381,893 IAV, 55,958 IBV, and 668 ICV sequences. Each motif
was analyzed against an IAV-only, IBV-only, ICV-only database, as well as a database of all available sequences.
All resulting covariance models were then compiled (Supplemental File 3), and any observed covariance was
assessed for significance (Supplemental File 2). IAV H1N1 segments were downloaded on 9 November 2021
(107,762 sequences), and all IAV H1N1 motifs were tested for covariance; no covariance was observed.
Receiver operating characteristic analysis of ScanFold predicted structures. ScanFold pre-
dicted structures for positive-sense IAV segments which contained −1 ΔG z-score base pairs or lower were cross
referenced to available DMS-MaPseq41 probing datasets using ROC analysis, which measures how well the pre-
dicted model fits the in vivo generated data. In this analysis, reactivity data files (generated by Simon et al.) for
each IAV segment had their reactivity sorted from least to most reactive and the lowest values were constrained
to be paired at 1% intervals from 0 to 100 percent. Nucleotide positions constrained to be paired are then cross
referenced to the predicted ScanFold structure (at every constraint threshold) to determine whether that
position is a true positive (TP), false positive (FP), true negative (TN), or false negative (FN) and this is used to
determine a true positive rate (TPR) and a false positive rate (FPR) at each threshold. Equations (1) and (2) show
the TPR and FPR formulas respectively:
TP
TPR = (1)
TP + FN
FP
FPR = (2)
FP + TN
Here, a TP occurs when the nucleotide position is paired in the corresponding connectivity table (CT) file
and considered paired at the corresponding constraint threshold; a FP occurs when the position is unpaired in
Scientific Reports | (2022) 12:310 | https://doi.org/10.1038/s41598-021-03767-x 8
Vol:.(1234567890)www.nature.com/scientificreports/
the CT file and paired at the reactivity threshold; a TN is unpaired in the CT file and unconstrained at reactivity
threshold; and a FN is paired in the CT file and unconstrained at the reactivity threshold. In this way, a completely
unconstrained reactivity file, when compared to a CT file, will yield TPRs and FPRs of zero and completely
constrained files will yield values of one. If a model fits the corresponding data, the TPR will rise significantly
faster than the FPR initially, generating a curve with a larger AUC. If a model is random in regard to the data,
the TPR and FPR will rise at an equal rate, generating a roughly 45-degree line. Results of our ROC analysis of
IAV are visualized in Fig. 5 and raw data is in Supplemental File 4.
Data availability
Influenza ScanFold data is available at the RNAStructuromeDB website: https://structurome.bb.iastate.edu/.
Python scripts used in analyses can be found at: https://github.com/moss-lab/.
Received: 24 September 2021; Accepted: 2 December 2021
References
1. Pizzorno, A. et al. Drug repurposing approaches for the treatment of influenza viral infection: Reviving old drugs to fight against
a long-lived enemy. Front. Immunol. 10, 531 (2019).
2. Webster, R. G. & Govorkova, E. A. Continuing challenges in influenza. Ann. N. Y. Acad. Sci. 1323, 115–139 (2014).
3. Priore, S. F., Moss, W. N. & Turner, D. H. Influenza A virus coding regions exhibit host-specific global ordered RNA structure.
PLoS ONE 7(4), e35989 (2012).
4. Virk, R. K. et al. Divergent evolutionary trajectories of influenza B viruses underlie their contemporaneous epidemic activity. Proc.
Natl. Acad. Sci. USA 117(1), 619–628 (2020).
5. Belshe, R. B. The need for quadrivalent vaccine against seasonal influenza. Vaccine 28(4), D45–53 (2010).
6. Adalja, A. A. Influenza type C as a cause of pediatric pneumonia. Clin. Biosecur. News https://www.centerforhealthsecurity.org/
cbn/2013/cbnreport_01112013.html (2013).
7. Matsuzaki, Y. et al. Clinical features of influenza C virus infection in children. J. Infect. Dis. 193(9), 1229–1235 (2006).
8. Fineberg, H. V. Pandemic preparedness and response–Lessons from the H1N1 influenza of 2009. N. Engl. J. Med. 370(14), 1335–
1342 (2014).
9. McMillan, C. L. D. et al. The next generation of influenza vaccines: Towards a universal solution. Vaccines (Basel) 9(1), 1 (2021).
10. Leoni, G. & Tramontano, A. A structural view of microRNA-target recognition. Nucleic Acids Res. 44(9), e82 (2016).
11. Davila-Calderon, J. et al. IRES-targeting small molecule inhibits enterovirus 71 replication via allosteric stabilization of a ternary
complex. Nat. Commun. 11(1), 4775 (2020).
12. Park, S. J., Kim, Y. G. & Park, H. J. Identification of RNA pseudoknot-binding ligand that inhibits the -1 ribosomal frameshifting
of SARS-coronavirus by structure-based virtual screening. J. Am. Chem. Soc. 133(26), 10094–10100 (2011).
13. Dela-Moss, L. I., Moss, W. N. & Turner, D. H. Identification of conserved RNA secondary structures at influenza B and C splice
sites reveals similarities and differences between influenza A, B, and C. BMC Res. Notes 7, 22 (2014).
14. Moss, W. N., Priore, S. F. & Turner, D. H. Identification of potential conserved RNA secondary structure throughout influenza A
coding regions. RNA 17(6), 991–1011 (2011).
15. Gultyaev, A. P., Fouchier, R. A. & Olsthoorn, R. C. Influenza virus RNA structure: Unique and common features. Int. Rev. Immunol.
29(6), 533–556 (2010).
16. Gultyaev, A. P. & Olsthoorn, R. C. A family of non-classical pseudoknots in influenza A and B viruses. RNA Biol. 7(2), 125–129
(2010).
17. Gultyaev, A. P. et al. Conserved structural RNA domains in regions coding for cleavage site motifs in hemagglutinin genes of
influenza viruses. Virus Evol. 5(2), vez034 (2019).
18. Gultyaev, A. P. et al. Subtype-specific structural constraints in the evolution of influenza A virus hemagglutinin genes. Sci. Rep. 6,
38892 (2016).
19. Gultyaev, A. P. et al. RNA structural constraints in the evolution of the influenza A virus genome NP segment. RNA Biol. 11(7),
942–952 (2014).
20. Priore, S. F. et al. The influenza A PB1-F2 and N40 start codons are contained within an RNA pseudoknot. Biochemistry 54(22),
3413–3415 (2015).
21. Priore, S. F. et al. Secondary structure of a conserved domain in the intron of influenza A NS1 mRNA. PLoS ONE 8(9), e70615
(2013).
22. Priore, S. F., Moss, W. N. & Turner, D. H. Influenza B virus has global ordered RNA structure in (+) and (−) strands but relatively
less stable predicted RNA folding free energy than allowed by the encoded protein sequence. BMC Res. Notes 6, 330 (2013).
23. Jiang, T. et al. Mutations designed by ensemble defect to misfold conserved RNA structures of influenza A segments 7 and 8 affect
splicing and attenuate viral replication in cell culture. PLoS ONE 11(6), e0156906 (2016).
24. Dadonaite, B. et al. The structure of the influenza A virus genome. Nat. Microbiol. 4(11), 1781–1789 (2019).
25. Moss, W. N. et al. The influenza A segment 7 mRNA 3′ splice site pseudoknot/hairpin family. RNA Biol. 9(11), 1305–1310 (2012).
26. Morf, J. & Wingett, S. W. Proximity RNA-seq: A sequencing method to identify co-localization of RNA. Methods Mol. Biol. 2161,
175–194 (2020).
27. Andrews, R. J., Roche, J. & Moss, W. N. ScanFold: An approach for genome-wide discovery of local RNA structural elements-
applications to Zika virus and HIV. PeerJ 6, e6136 (2018).
28. Andrews, R. J., O’Leary, C. A. & Moss, W. N. A survey of RNA secondary structural propensity encoded within human herpesvirus
genomes: Global comparisons and local motifs. PeerJ 8, e9882 (2020).
29. Andrews, R. J. et al. A map of the SARS-CoV-2 RNA structurome. NAR Genom. Bioinform. 3(2), 043 (2021).
30. Clote, P. et al. Structural RNA has lower folding energy than random RNA of the same dinucleotide frequency. RNA 11(5), 578–591
(2005).
31. Michalak, P. et al. Conserved structural motifs of two distant IAV subtypes in genomic segment 5 RNA. Viruses 13, 3 (2021).
32. Rangan, R. et al. RNA genome conservation and secondary structure in SARS-CoV-2 and SARS-related viruses: A first look. RNA
26(8), 937–959 (2020).
33. Lorenz, R. et al. ViennaRNA Package 2.0. Algorithms Mol. Biol. 6, 26 (2011).
34. Dubois, J., Terrier, O. & Rosa-Calatrava, M. Influenza viruses and mRNA splicing: Doing more with less. MBio 5(3), e00070-e114
(2014).
35. Sperschneider, J. & Datta, A. DotKnot: Pseudoknot prediction using the probability dot plot under a refined energy model. Nucleic
Acids Res. 38(7), e103 (2010).
36. Incarnato, D. et al. RNA framework: An all-in-one toolkit for the analysis of RNA structures and post-transcriptional modifica-
tions. Nucleic Acids Res 46(16), e97 (2018).
Scientific Reports | (2022) 12:310 | https://doi.org/10.1038/s41598-021-03767-x 9
Vol.:(0123456789)www.nature.com/scientificreports/
37. Manfredonia, I. et al. Genome-wide mapping of SARS-CoV-2 RNA structures identifies therapeutically-relevant elements. Nucleic
Acids Res. 48(22), 12436–12452 (2020).
38. Nawrocki, E. P. & Eddy, S. R. Infernal 1.1: 100-fold faster RNA homology searches. Bioinformatics 29(22), 2933–2935 (2013).
39. Rivas, E., Clements, J. & Eddy, S. R. A statistical test for conserved RNA structure shows lack of evidence for structure in lncRNAs.
Nat. Methods 14(1), 45–48 (2017).
40. Rivas, E., Clements, J. & Eddy, S. R. Estimating the power of sequence covariation for detecting conserved RNA structure. Bioin-
formatics 36(10), 3072–3076 (2020).
41. Simon, L. M. et al. In vivo analysis of influenza A mRNA secondary structures identifies critical regulatory motifs. Nucleic Acids
Res. 47(13), 7003–7017 (2019).
42. Rivas, E. Evolutionary conservation of RNA sequence and structure. Wiley Interdiscip. Rev. RNA. 12(5), e1649 (2021).
43. Tavares, R. C. A., Pyle, A. M. & Somarowthu, S. Phylogenetic analysis with improved parameters reveals conservation in lncRNA
structures. J. Mol. Biol. 431(8), 1592–1603 (2019).
44. Le Sage, V. et al. Mapping of influenza virus RNA-RNA interactions reveals a flexible network. Cell Rep. 31(13), 107823 (2020).
45. Liu, G. et al. Influenza A virus panhandle structure is directly involved in RIG-I activation and interferon induction. J. Virol. 89(11),
6067–6079 (2015).
46. Williams, G. D. et al. Nucleotide resolution mapping of influenza A virus nucleoprotein-RNA interactions reveals RNA features
required for replication. Nat. Commun. 9(1), 465 (2018).
47. Gog, J. R. et al. Codon conservation in the influenza A virus genome defines RNA packaging signals. Nucleic Acids Res. 35(6),
1897–1907 (2007).
48. Andrews, R. J., Baber, L. & Moss, W. N. Mapping the RNA structural landscape of viral genomes. Methods 183, 57–67 (2020).
49. Lange, S. J. et al. Global or local? Predicting secondary structure and accessibility in mRNAs. Nucleic Acids Res. 40(12), 5215–5226
(2012).
50. Andrews, R. J., Baber, L. & Moss, W. N. RNAStructuromeDB: A genome-wide database for RNA structural inference. Sci. Rep.
7(1), 17269 (2017).
51. Spitzer, M. et al. BoxPlotR: A web tool for generation of box plots. Nat. Methods 11(2), 121–122 (2014).
Acknowledgements
We would like to thank the Roy J. Carver Charitable Trust for their support, as well as grants R00GM112877
and R01GM133810 from the NIH.
Author contributions
W.N.M. conceived of the project. J.M.P. conducted the experiments. J.M.P. and C.A.O. analyzed the results.
W.N.M., J.M.P., and C.A.O. wrote the manuscript.
Competing interests
The authors declare no competing interests.
Additional information
Supplementary Information The online version contains supplementary material available at https://doi.org/
10.1038/s41598-021-03767-x.
Correspondence and requests for materials should be addressed to W.N.M.
Reprints and permissions information is available at www.nature.com/reprints.
Publisher’s note Springer Nature remains neutral with regard to jurisdictional claims in published maps and
institutional affiliations.
Open Access This article is licensed under a Creative Commons Attribution 4.0 International
License, which permits use, sharing, adaptation, distribution and reproduction in any medium or
format, as long as you give appropriate credit to the original author(s) and the source, provide a link to the
Creative Commons licence, and indicate if changes were made. The images or other third party material in this
article are included in the article’s Creative Commons licence, unless indicated otherwise in a credit line to the
material. If material is not included in the article’s Creative Commons licence and your intended use is not
permitted by statutory regulation or exceeds the permitted use, you will need to obtain permission directly from
the copyright holder. To view a copy of this licence, visit http://creativecommons.org/licenses/by/4.0/.
© The Author(s) 2022
Scientific Reports | (2022) 12:310 | https://doi.org/10.1038/s41598-021-03767-x 10
Vol:.(1234567890)You can also read