Performance of low-cost sensors for air pollution measurements in urban environments. Accuracy evaluation applying the Air Quality Index (AQI)
←
→
Page content transcription
If your browser does not render page correctly, please read the page content below
Preprints (www.preprints.org) | NOT PEER-REVIEWED | Posted: 1 June 2021                           doi:10.20944/preprints202106.0041.v1

     Article

     Performance of low-cost sensors for air pollution measure-
     ments in urban environments. Accuracy evaluation applying
     the Air Quality Index (AQI)
     Georgios C. Spyropoulos 1,2,3, Panagiotis T. Nastos 1, * and Konstantinos P. Moustris 3

                                       1 Laboratory of Climatology and Atmospheric Environment, Department of Geology and Geoenvironment,
                                         National and Kapodistrian University of Athens, Panepistimiopolis, GR-15784 Athens, Greece; nas-
                                         tos@geol.uoa.gr
                                       2 Laboratory of Soft Energy Applications & Environmental Protection, Mechanical Engineering Department,

                                         University of West Attica, 250 Thivon and P. Ralli Str., GR-12244, Athens, Greece; geospyrop@uniwa.gr
                                       3 Laboratory of Soft Energy Applications & Environmental Protection, Mechanical Engineering Department,

                                         University of West Attica, 250 Thivon and P. Ralli Str., GR-12244, Athens, Greece; kmoustris@uniwa.gr
                                       * Correspondence: nastos@geol.uoa.gr

                                       Abstract: Most people living in Europe's cities are still exposed to levels of air pollution deemed
                                       harmful by the World Health Organization. In the modern world, air pollution is the foremost con-
                                       cern because of its impact in human health and economy. This strong connection appears gaining a
                                       lot of concern, driven by new installed low-cost electrochemical sensors monitoring systems. Highly
                                       accuracy, real-time monitoring, daily and yearly statistics, data access from experts or simple users,
                                       low-cost equipment and forecasting needs, enforce the market to develop new air quality monitor-
                                       ing systems using advanced technologies and protocols. In this study, a comparison via low-cost
                                       electrochemical sensors and of static, fixed site measurement monitoring station, is taking place in
                                       Athens, Greece, along with the data quality and Air Quality Index (AQI) including data accuracy
                                       and quality of data concerning adverse health effects due to air pollution. The findings presented in
                                       this work, relate to different flexible and affordable alternatives adopted during the evaluation and
                                       calibration of low-cost gas sensors for the monitoring. The significance of the positive results is par-
                                       ticularly useful, especially considering the founding for interference, environmental conditions af-
                                       fections and air quality information including indexes and health recommendations for a specific
                                       location.

                                       Keywords: air quality; air pollution measurements; electrochemical sensors; low-cost sensors; AQI
                                       (Air Quality Index); Athens

                                       1. Introduction
                                             It is a fact that we live through a critical juncture in terms of the environment. We
                                       will face challenges related to human sustainability and the formulation or acceptance of
                                       each policy that will be pursued, will be the one that will determine the success of systemic
                                       solutions. Now more than ever, the social, economic and environmental dimensions that
                                       are developing due to the spread of COVID-19 are identifying serious gaps in citizens'
                                       livelihoods. Citizens' expectations are nothing more than being able to live in a healthy
                                       environment, where they can be protected, informed and provided immediately and flex-
                                       ibly an adequate "treatment". This might be a specific medication or the implementation
                                       of appropriate precautionary or preventive measures, but in any case, society will expect
                                       viable solutions. In the forthcoming years, every society is called to act with appropriate
                                       answers to the global challenges of climate and environment. The plethora of scientific
                                       and non-scientific publications, which we are willing to follow and the global reports of
                                       related organizations demonstrate the seriousness and impact of our route so far. Sustain-
                                       able solutions must now be provided and there must be substantial information on climate

               © 2021 by the author(s). Distributed under a Creative Commons CC BY license.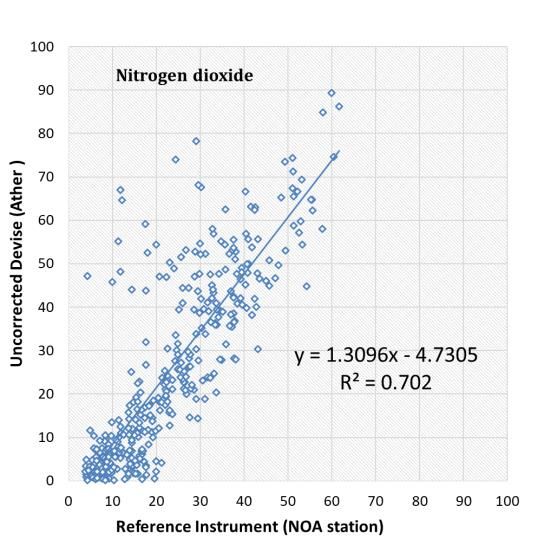
Preprints (www.preprints.org) | NOT PEER-REVIEWED | Posted: 1 June 2021               doi:10.20944/preprints202106.0041.v1

                                 change, biodiversity loss, depletion of natural resources and the environmental risks we
                                 are called upon to address.
                                       According to multiple scientific studies, a link between air pollution and human
                                 health impacts such as asthma, respiratory disease, chronic bronchitis, heart disease, lung
                                 cancer and generally reduced life expectancy and premature mortality has been con-
                                 firmed [1,2]. Many researchers are also examining the association of meteorology and par-
                                 ticulate matter with potential health risks[3]. The World Health Organization [4] has esti-
                                 mated that in developing countries, the increase in urban air pollution has led to more
                                 than 2 million deaths per year, as well as to various respiratory illnesses [5,6]. Moreover,
                                 technological progress and urbanization in developing and developed countries results
                                 to an increase of air pollution [7–9] and due to local soil dust re-suspension from trans-
                                 portation higher dust contribution in observed [10]The appropriate decision-making of
                                 strategies and actions, in due course, depends on the recording and analysis of ambient
                                 air quality parameters, which create the need for the development of a real-time monitor-
                                 ing network of such parameters. The use of multi-parameter monitoring systems for the
                                 quality of the atmospheric environment enables a detailed analysis of the major air pollu-
                                 tants, biometeorological parameters and noise pollution. These integrated monitoring sys-
                                 tems are the most important tools, in the so-called "smart cities", for air quality monitoring
                                 in urban areas [11], but also for the monitoring of other environmental parameters that
                                 determine to a significant extent the quality of life of the city's inhabitants. According to
                                 the Directive 2008/50/EC on ambient air quality and cleaner air for Europe, which clearly
                                 designate the need of fixed monitoring stations for significant pollutants, the development
                                 of a network consists of low-cost electrochemical sensors along with the necessary preci-
                                 sion and accuracy of air pollution and meteorological measurements is a solution. There-
                                 fore, the use of electrochemical sensors compared to fixed site measurement monitoring
                                 stations, is of great interest among other researchers thus adopting similar methodology
                                 for this work [12–18], while [19], giving more details for the use of electrochemical sensors
                                 to monitor urban air quality, sensor design and laboratory and field performance. Envi-
                                 ronmental and air quality data obtained by such systems are subject to be less reliable than
                                 individual instruments and therefore viral information about the sensitivity, selectivity
                                 and stability of sensors is gathered and discussed. Simultaneously, most of web applica-
                                 tions and low-cost sensors provide monitor measurements reporting the AQI, the ques-
                                 tion comes up: Is this safe for our health? Is this information correct?

                                 2. Field Data and Methodology
                                      Recent research on field of air pollution measurements using low-cost sensors is now
                                 plentiful worldwide, and in any case, researchers are producing positive results. More
                                 specifically, in Gateshead UK [20], CO and NO2 sensors were monitored and validated
                                 successfully, during the development of a protocol where the data had to go through a
                                 dual network transmission to reach the destination address.
                                      In New Zealand a team of scientists [21], conducted a study in Auckland where high
                                 pollution is produced because of the of the high circulation of diesel cars. Study took place
                                 on a busy 2 km road, 4 km away from the center. Researchers used 8 low-cost sensors at
                                 distances of 100 to 1000 meters near bus stops. Although the measured daily concentration
                                 of NO2 did not exceed 20 μg/m3 the conclusions they drew highlight the very large devi-
                                 ations for every 100 meters.
                                      [22] during 2016 mapped the NO2 pollution of the atmosphere of Oslo in Norway,
                                 with measurements taken from electrochemical sensors. While the chosen equipment did
                                 not conclude in acceptable data accuracy at first, they combined the measurements with
                                 data value deriving from forecasting programs and succeed to an accuracy rate of 89%.
                                      Similar methodology appears from researchers in Seoul, South Korea [23], they used
                                 low-cost sensors in cells to measure PM2.5. They took a rather small sample of measure-
                                 ments, a total of 169 hours of data and exported it through a free geo-data editable map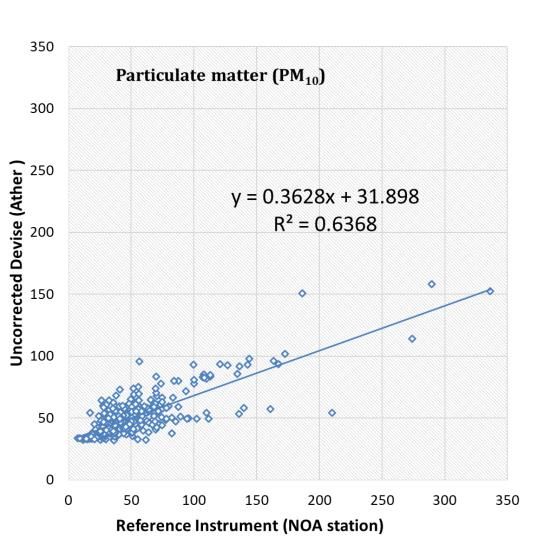
Preprints (www.preprints.org) | NOT PEER-REVIEWED | Posted: 1 June 2021                  doi:10.20944/preprints202106.0041.v1

                                 (OpenStreetMap). Using algorithms and through machine learning models they opti-
                                 mized the percentages of accuracy and chose the best ones.
                                      In Athens area by using low- cost PM sensors for over 5 months, strongly correlations
                                 appeared comparing with reference-grade instrumentation [18]. The result of using this
                                 equipment is positive and as the authors conclude low-cost sensors can provide iseful
                                 data to the research community.
                                      Also, acceptable method used by [24], where they used low-cost sensors connected
                                 to an Arduino in order to measure PM2.5 indoors and through measurement calibration
                                 software succeed to high accuracy.
                                      On the other hand, in Sao Paulo, Brazil [25] researchers collect measurements of CO,
                                 CO2, NO2 and O3 as well as temperature, humidity, altitude and velocity. The measure-
                                 ments recorded in 5 different routes with cars equipped with electrochemical sensors and
                                 they used geo-data map techniques to capture these measurements. Although the idea
                                 was well established, they encountered several problems with the accuracy of the pollu-
                                 tant measurements. It should be noted that using any type of device for air pollution meas-
                                 urements in a car while travelling, has so many limitations and specific features, which is
                                 extremely difficult to outcome to a safe result concerning accuracy.
                                      After evaluating different systems of low-cost sensor devices for urban air quality
                                 monitoring in the market, the authors in collaboration with Progekta Europe P.C., an Ath-
                                 ens (GR)-based company, concluded in the device called “Aether” (Figure 1).

                                 Figure 1. Ather low-cost sensor device for urban air quality monitoring.

                                       The Aether was exclusively designed from the company and authors to be resistant
                                 to external conditions, compact and lightweight and thus convenient for users to carry or
                                 install in specific urban spots. The Aether supports sensing of a variety gas concentrations
                                 using Alphasense Ltd. (UK) electrochemical sensors considered one of the best choices
                                 [26], for CO, H2S, NO, NO2, O3, SO2, photoionisation detection (PID) for VOCs, non-dis-
                                 persive infra-red (NDIR) for CO2. In addition, it incorporates the Alphasense optical par-
                                 ticle counter (OPC) for PM1, PM2.5 and PM10 particulate matters. Air temperature, relative
                                 humidity and atmospheric pressure are also measured.
                                       This study took place in central Athens, in the area of the National Observatory of
                                 Athens (NOA) at Thissio (37° 58′ Ν, 23° 43′ E), between April 12 th to 28th 2018. The specific
                                 point is located next to a park (Philopappou Hill) and the distance from mild traffic roads
                                 is more than 100m. The access to the spot where field data were collected is limited only
                                 to specific personnel, while this point was chosen because lies next to the historic center
                                 of Athens and at the same time a certified urban background air pollution monitoring
                                 station is already installed there. It belongs to the NOA and its certified analyses comply
                                 with the prescribed calibration intervals. More specifically, Horriba AP-360 series and the
                                 Thermo 49i automatic analyzers were operated for monitoring of NO x (NO+NO2) and O3
                                 respectively on 1 min resolution, averaged on hourly basis. A beta-radiation attenuation
                                 particulate matter measurement system (Eberline Instruments, type FH-62) was operated
                                 for the continuous detection of PM10 levels. For the fine fraction of particulates, PM2.5 filter
                                 samples integrated over 24 hours periods with a Derenda low volume sampler were used.
Preprints (www.preprints.org) | NOT PEER-REVIEWED | Posted: 1 June 2021 doi:10.20944/preprints202106.0041.v1
Finally, meteorological data (ambient temperature and relative humidity) at the sampling
site were recorder by NOA's automatic meteorological station at Thissio (1-min resolu-
tion). The Ather devise was chosen to measure NO2, O3, PM10, air temperature and relative
humidity on 2-second intervals.
The methodology followed after the installation of the Ather device at Thissio area
consisted of three stages: data collection, processing and evaluation of the results. The first
step initially involved setting the time, date and synchronization between the Ather de-
vice and NOA monitoring station, along with ensuring data communication from data
loggers. Each analyzer and instrument were set to take measurements and record in the
minimum interval (1-2sec) having the ability -in the next stage- to define the interval. In
the second stage, differences in the mode of operation of the fixed station and the electro-
chemical sensors were taken into account. If data evaluated in short intervals, e.g. seconds,
considerable variations would arise, due to the different response pattern of the analyzers
and the Ather device. Hence, it was decided that the interval of the measurements should
be in hourly steps.
3. Results
3.1. Data Accuracy Validation
Subsequently, the reliability of the Ather was examined, all the individual measure-
ments were checked and the validity of the data was evaluated by utilizing statistical met-
rics [27–29] in Table 1. For the evaluation process, the correlation coefficient (R 2) for each
data set was calculated, where array-1 was the worksheet range that holds data of NOA
station set and array-2 was the worksheet range that holds the Ather device data. The
Mean Absolute Error (MAE) was calculated in order to indicate the average magnitude of
the errors, without considering their direction (overestimation or underestimation) and
last, the Root Mean Square Error (RMSE) was calculated for the two data sets in order to
aggregate them into a single measure of predictive power [30]. Final steps concerned the
evaluation of the results in relation to their correlation and statistical analysis.
Table 1. Evaluation statistical indices between NOA station and Aether device measurements.
NO2 O3 PM10 PM2.5 T RH
R2 0.702 0.510 0.637 0.507 0.959 0.936
8.6 (ppb) 18.4 (ppb)
MAE 15.5 (μgr/m3) 13.1 (μgr/m3) 0.6 (oC) 2.4 (%)
16.0 (μgr/m ) 3 36.0 (μgr/m3)
RMSE 12.6 (ppb) 23.7 (ppb)
25.4 (μgr/m3) 17.61 (μgr/m3) 0.8 (oC) 3.23 (%)
24.0 (μgr/m3) 47.0 (μgr/m3)
According to the specific work and methodology described above, one can see the
results of the comparison between NOA station and the Aether device (Table 1). Typical
time series of average hourly ratios derived from 1-2 sec sampling times are presented.
The scatterplot (Figure 2a) and the time series (Figure 2b) reflect the comparison of NO2
measurements (ppb) with a data completeness of 96.2%. As can be seen, the concentra-
tions are ranging from 0 up to 62ppb (117.0μg/m3) according to NOA station and from 0
up to 89ppb (167.0μg/m3) according to the Aether device. The coefficient of determination
is equal to R2=0.702, explaining the 70.2% of the variance of the data, indicating a very
good agreement between NOA station and Aether device measurements. Furthermore,
low values of MAE and RMSE provide a strong correlation for NO2 measurements be-
tween NOA monitoring stations and Aether device. Finally, it seems that Aether device
overestimates the air pollution (MAE>0) in all cases and for all pollutants, in comparison
with NOA monitoring station measurements.
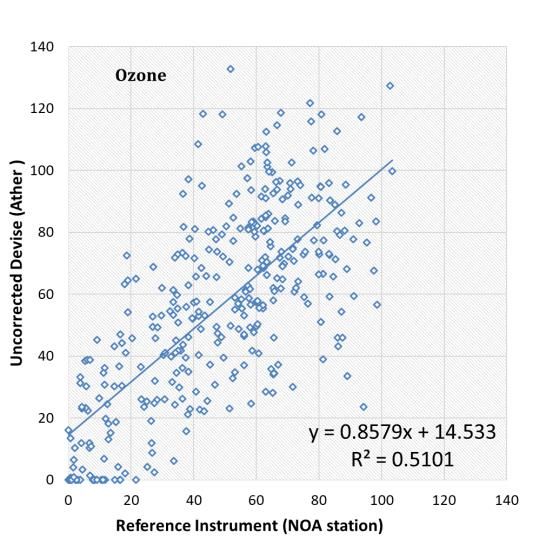
In Figure 3, the scatterplot and time series of ozone (O 3) is provided with data com-
pleteness of 90.1%. The measurements are ranging from 0 up to 62ppb (122.0μg/m 3) ac-
cording to NOA station and from 0 up to 89ppb (175.0μg/m 3) according to the Aether
device. The coefficient of determination is equal to R2= 0.510, along with relatively high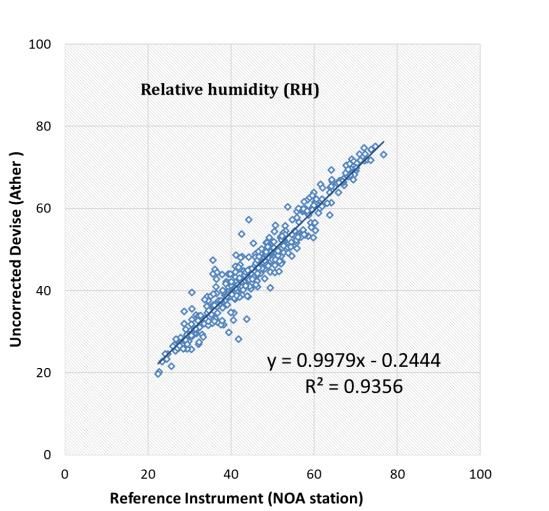
Preprints (www.preprints.org) | NOT PEER-REVIEWED | Posted: 1 June 2021                       doi:10.20944/preprints202106.0041.v1

                                      values of MAE and RMSE shows that there is a limited tolerable correlation between the
                                      measurements of NOA station and Aether device. According to the above, accurate data
                                      of local air quality, concerning O3, over long timescales should not be expected.

                                        (a)                                                    (b)
          Figure 2. Scatterplot (a) and time series (b) of nitrogen dioxide (NO 2) records.

                                        (a)                                                    (b)
          Figure 3. Scatterplot (a) and time series (b) of ozone (O3) records.

                                            The next data sets concern particulate matters PM10 and PM2.5. Figure 4 and Figure 5
                                      provide rather moderate correlation results. In this case, data completeness was 95.2% and
                                      81.3% respectively, with values of the coefficient of determination equal to R2=0.637 and
                                      R2=0.507 respectively. During the specific period, at least two major Saharan dust events
                                      over Athens were occurred (Figure 4b) and in such cases dust can be a significant compo-
                                      nent of PM [31,32]. In these cases, it is clear that the Aether device could not adapt to these
                                      major fluctuations appearing, along with relatively high values of MAE and RMSE re-
                                      vealed. It should be noted, however, that these sensors are also highly affected by humid-
                                      ity phenomena, therefore with the fluctuations that existed low reliability was expected
                                      [33].
                                            Finally, the comparison of air temperature and relative humidity measurements
                                      (Figure 6) was conducted with data completeness of 100%. The Aether device showed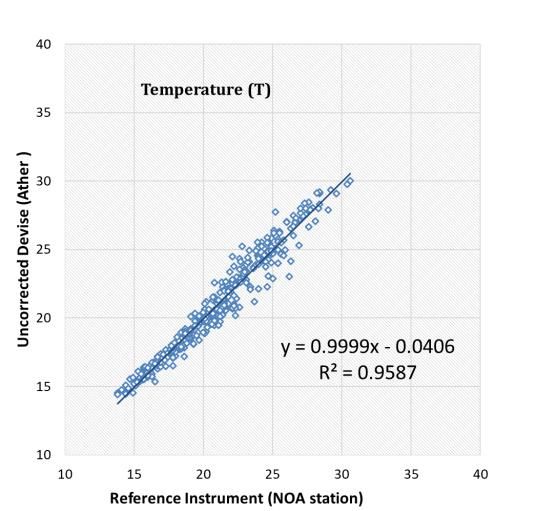
Preprints (www.preprints.org) | NOT PEER-REVIEWED | Posted: 1 June 2021                    doi:10.20944/preprints202106.0041.v1

                                       high correlations with the NOA station with R2=0.959 and R2=0.936 respectively for tem-
                                       perature and humidity, along with low values of MAE and RMSE (Table 1).

                                         (a)                                                (b)
          Figure 4. Scatterplot (a) and time series (b) of PM10 records.

                                         (a)                                                (b)
          Figure 5. Scatterplot (a) and time series (b) of PM2.5 records.

                                            Solutions for improving the reliability of the measurements and their accuracy are
                                       specific. You may either correct values directly internally using software calculations on
                                       any device with low-cost sensors, or use calibration algorithms using multi-linear regres-
                                       sion models, artificial neural network models, etc. to account influences of other factors
                                       such as temperature, humidity, solar radiation or for example ozone values when calibrat-
                                       ing NO2 sensors, after obtaining the values. In both cases, correlation coefficients between
                                       low-cost devices and reference instruments are improved.
                                            Nevertheless, the need for a better quality and accuracy of sensors measurements
                                       concerning their spatial and temporal performance still remains questionable and the im-
                                       portant challenge is to manage providing valuable information for human health. More-
                                       over, it is a fact that the multitude of international collaborations and agencies such as
                                       companies, universities and organizations that are involved and constantly contribute to
                                       the development of quality improvement of low-cost sensors, such as the VAQUUMS
                                       project, CEN Technical Committee, EveryAware project, AirSensEUR project, Joint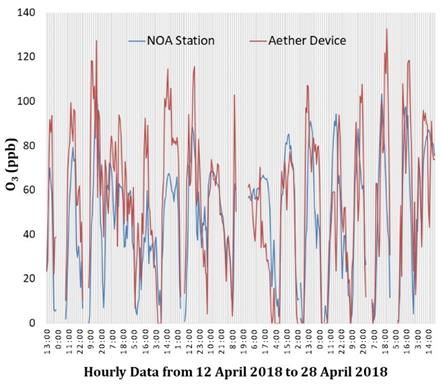
Preprints (www.preprints.org) | NOT PEER-REVIEWED | Posted: 1 June 2021                     doi:10.20944/preprints202106.0041.v1

                                    Research Center and others, improve constantly the reliability and the quality of meas-
                                    urements by low-cost sensors, so that users can have a correct reliable measurements.
                                    Therefore, it is emphasized through this paper that the duration of exposure along with
                                    the value of concentration of any pollutant, are of major important for human health,
                                    which means that except of the value itself of every pollutant, air quality indexes are also
                                    important to highlight the effect of human health.

                                         (a)                                                 (b)
          Figure 6. Scatterplot between NOA station and Aether device for air temperature (a) and relative humidity (b) measure-
          ments.

                                    3.2. Evaluation of Air Quality Index
                                         In this study, two surveys were conducted for low-cost sensors devices. The first was
                                    for the evaluation of air pollution data accuracy and the second for providing valuable
                                    data concerning adverse health effects due to air pollution, through the evaluation of the
                                    well-known AQI. In both cases, the evaluation based on low-cost sensors devices meas-
                                    urements in comparison with NOA air pollution monitoring station. AQI is reporting
                                    daily air quality. AQI shows the association between air quality and public health effects.
                                    The U.S.A. Environmental Protection Agency (USEPA) is an independent executive
                                    agency of the United States federal government and calculates the AQI for five major air
                                    pollutants regulated by the Clean Air Act: ground-level ozone, particle pollution (also
                                    known as particulate matter), carbon monoxide, sulfur dioxide, and nitrogen dioxide. For
                                    each of these pollutants, USEPA has established national air quality standards to protect
                                    public health. Ground-level ozone and particle pollution are the two pollutants that pose
                                    the greatest threat to human health in this country [34]. There are a substantial number of
                                    different indexes to measure air quality for individual pollutants and even countries that
                                    share the same legislation or sometimes areas/cities within the same country have differ-
                                    ent indices, but in this study, authors focus on most commonly used index AQI.
                                         More specifically, firstly is examined the AQI value obtained from the NOA station
                                    in comparison with the Aether device and secondly, whether the AQI value is correctly
                                    determined or not by using statistical indices. The main reason that has led researchers to
                                    this determination is purely practical. Most of the people are not able to know a given
                                    value or an indication which will be given in units such as ppb or μgr/m3 and even if they
                                    are familiar with the units, they will not remember for every pollutant its threshold value
                                    in order to understand if the quality of air is good or bad. Therefore, an established cate-
                                    gorization of AQI value with intervals of concern (Good (0-50), Moderate (51-100), Un-
                                    healthy for Sensitive Groups (101-150), Unhealthy (151-200), Very Unhealthy (201-300),
                                    Dangerous (301-500)) and appropriate chromatic scale is definitely more than useful. In
                                    order to investigate the ability of the Aether device to determine the accurate value of AQI
                                    for every interval of concern, appropriate statistical indices such us the true predicted rate
                                    (TPR), the false negative rate (FNR) and the false positive rate (FPR) were used. In this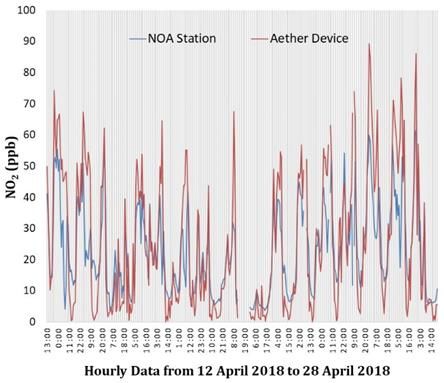
Preprints (www.preprints.org) | NOT PEER-REVIEWED | Posted: 1 June 2021                        doi:10.20944/preprints202106.0041.v1

                                    study, the most important finding is not the exact match or the best possible correlation
                                    between the Aether device and the actual concentration value from NOA station, but
                                    whether the Aether device was able to correctly predict the right interval of AQI, accord-
                                    ing to its air pollution measurements.
                                          Table 2 presents the validation statistical indices for different AQI intervals. In Table
                                    2, the number of hours, where for both Aether device and NOA station, for each pollutant
                                    AQI value is lying within the same interval (right AQI interval prediction), are denoted
                                    as X. The number of hours where AQI calculated via Aether device is lying within the
                                    previous AQI interval, based on NOA measurements are denoted as Y, the number of
                                    hours where AQI calculated via Aether device is laying within the next AQI interval,
                                    based on NOA measurements are denoted as Z, and N is the number of hours where AQI
                                    is lying within a specific interval, based on NOA measurements.

                   Table 2. Statistical indices for the evaluation of the Ather device accuracy for specific AQI intervals.

       Pollutant       AQI Interval                   X         Y        Z         N          TPR%            FNR%            FPR%
                       AQI (0-50)                    329        0        37       366           89.9             0.0          10.1
       NO2
                       AQI (51-100)                   10        1         0        11           90.9             9.1           0.0
                       AQI (0-50)                    174        0        57       231           75.3             0.0          24.7
       O3              AQI (51-100)                   38        31       39       108           35.2            28.7          36.1
                       AQI (101-150)                  18        16        8        42           42.9            38.1          19.0
                       AQI (0-50)                    241        0        10       251           96.0             0.0           4.0
       PM10
                       AQI (51-100)                  106        12        0       118           89.8            10.2           0.0
                       AQI (0-50)                     2         0         0         2          100.0             0.0           0.0
                       AQI (51-100)                   6         0         0         6          100.0             0.0           0.0
       PM2.5
                       AQI (101-150)                  4         0         0         4          100.0             0.0           0.0
                       AQI (151-200)                  0         1         0         1           0.0            100.0           0.0

                                          True predicted rate (TPR) represents the percentage (%) of correct cases over total
                                    cases with values from 0.0% to 100.0% and a perfect score equal to 100.0%, i.e. when AQI
                                    calculated via Aether device is lying within the same AQI interval, based on NOA meas-
                                    urements. False negative rate (FNR) represents the percentage (%) of negative false pre-
                                    dictions, i.e. where AQI calculated via Aether device is lying within the previous AQI
                                    interval, based on NOA measurements, with values from 0.0% to 100.0% and a perfect
                                    score equal to 0.0%. Finally, false positive rate (FPR) represents the percentage (%) of pos-
                                    itive false predictions, i.e. where AQI calculated via Aether device is lying within the next
                                    AQI interval, based on NOA measurements, with values from 0.0% to 100.0% and a per-
                                    fect score equal to 0.0%.
                                          According to Table 2, it seems that the Aether device shows a very good overall ac-
                                    curacy in predicting AQI index by using mean hourly concentrations. Specifically, the Ae-
                                    ther device with the electrochemical sensors predicts correctly from 35.2 % (O3 – Moderate
                                    level) up to 100 % (PM2.5 – Good, Moderate level) of observed exceedances. For every hu-
                                    man it is more than important to know, in hourly step, if the AQI index will be correct and
                                    much more if the concentration level is above the Good or Moderate level. This is due to
                                    the fact that the human body when exposed to high concentrations of air pollution more
                                    than 8h during the day is at high unhealthy risk [30]. More specifically, in Figures 7 to 10
                                    is presented in detail for every pollutant, the daily value of AQI index derived from aver-
                                    age hourly values along with statistical indices for the evaluation of the Aether device
                                    accuracy.
                                          Luckily for the environment and human health during the period of measurements
                                    NO2 emissions were in relatively low levels and ranges below 70ppb (132μg/m3). There-
                                    fore, according to AQI calculations only the first 2 categories were explored (Good and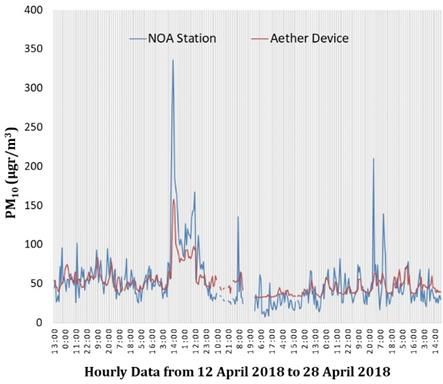
Preprints (www.preprints.org) | NOT PEER-REVIEWED | Posted: 1 June 2021                doi:10.20944/preprints202106.0041.v1

                                 Moderate) and the results are very promising (Figure 7). It is of major interest to under-
                                 stand that even in cases of different categories in AQI calculations considering NO 2, with
                                 FPR 10.1% and 0.0% for Good level and Moderate level respectively, the outcome is not
                                 prohibitive. The same conclusions derive as well for FNR (0.0% and 9.1% for Good level
                                 and Moderate AQI level respectively).

                                 Figure 7. AQI daily values for NO2 according to NOA monitoring station and Aether device meas-
                                 urements. The green dot line represents the threshold value AQI=50.

                                      Figure 8 depicts the daily AQI concerning O3 (8 hours moving average concentration)
                                 during the examined period. We see that during the examined period, three different AQI
                                 levels (health impact) appeared.
                                      It is well known that in Athens and generally in Greece, O3 is one of the key role
                                 pollutants due to high solar irradiation and the huge number of sunny hours during the
                                 year. As it can be seeing the comparison between the mean daily AQI value derived via
                                 Aether device and the respectively NOA monitoring station measurements, may easily
                                 characterized positive.
                                      Concerning PM10, the comparison between daily AQI values derived via Aether de-
                                 vice and the corresponding values derived via NOA monitoring station are almost excel-
                                 lent (Figure 9). For sixteen (16) consecutive days the daily AQI value is lying (for both
                                 Aether device and NOA monitoring station) within the same health impact interval
                                 (100.0% success).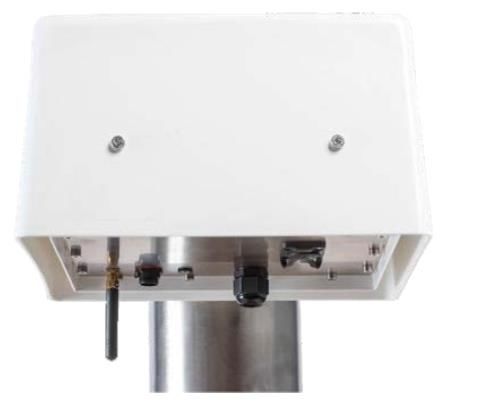
Preprints (www.preprints.org) | NOT PEER-REVIEWED | Posted: 1 June 2021                doi:10.20944/preprints202106.0041.v1

                                 Figure 8. AQI daily values for O3 (8hrs moving average concentration) according to NOA monitor-
                                 ing station and Aether device measurements. The dots colored lines represent the AQI threshold
                                 values between different AQI intervals (health impacts).

                                 Figure 9. AQI daily values for PM10 according to NOA monitoring station and Aether device
                                 measurements. The green dot line represents the threshold value AQI=50.

                                      Exactly the same conclusions were derived for PM2.5. The comparison between daily
                                 AQI values derived via Aether device and the corresponding values derived via NOA
                                 monitoring station is almost perfect (Figure 10).
                                      For twelve (12) of the thirteen (13) consecutive days, the AQI daily value is lying (for
                                 both Aether device and NOA monitoring station) within the same health impact interval
                                 (92.3% success). More specifically, only one (1) day the AQI value according to NOA was
                                 marginally larger than 150 (Unhealthy) and at the same time according to Aether device
                                 was more than 50 and less than 100 (Unhealthy for Sensitive Groups).

                                 4. Discussion and Conclusions
                                       Through the specific work, a low-cost sensor device for urban air quality monitoring
                                 which was designed by a private Athens based company and the Authors, is examined in
                                 detail. The devise supports sensing of a variety gas concentrations using Alphasense Ltd.
                                 (UK) electrochemical sensors and optical particle counter (OPC) for PM 1, PM2.5 and PM10
                                 particulate matters. Two surveys were conducted for the low-cost sensing device. The first
                                 one explored the evaluation of the measured concentrations and the second the worth of
                                 providing valuable information concerning human health impact due to air pollution, in
                                 other words the evaluation of the info through the application of the well-known air qual-
                                 ity index AQI.
Preprints (www.preprints.org) | NOT PEER-REVIEWED | Posted: 1 June 2021 doi:10.20944/preprints202106.0041.v1
Figure 10. AQI daily values for PM2.5 according to NOA monitoring station and Aether device
measurements. The dots colored lines represent the AQI threshold values between different AQI
intervals (health impacts).
The evaluation of the performance of a device with electrochemical sensors, installed
in an urban environment, took part in central Athens, Greece, in the area of the National
Observatory of Athens (Thissio). As the results may vary depending on the field condi-
tions and different applications, it was concluded that the main challenges of using such
devices with electrochemical sensors lying up to what extent the data quality as well as
the respectively information through these data, will be used. Although there are differ-
ences in absolute values between the Aether device measurements and the corresponding
NOA monitoring station (reference measurements), as well as relatively high values of
MAE and RMSE, with poor performance, a positive correspondence exists in the use of
the Ather device. Concerning the comparison of Ather device measurements to the NOA
fixed site monitoring station corresponding measurements the coefficient of determina-
tion is ranging between 0.507 (O3) and 0.702 (NO2) which indicates a good enough meas-
uring accuracy at a statistical significant level of pPreprints (www.preprints.org) | NOT PEER-REVIEWED | Posted: 1 June 2021 doi:10.20944/preprints202106.0041.v1
The air pollutants concentration measurements which took place using these devices
showed successful predictions of air quality level and the corresponding public health
impact. This kind of information is very important for the people (residents and visitors
of the city) in order to schedule their daily outdoor activity, as well as for the state in order
to take the appropriate measures to avoid short-term and long-term hazardous public
health impacts.
Author Contributions: Conceptualization and methodology: G.C.S., P.T.N. and K.P.M.; Software,
validation and formal analysis: G.C.S., P.T.N. and K.P.M.; Investigation, resources, data curation,
writing—original draft preparation, G.C.S.; Writing—review and editing, visualization, supervi-
sion, project administration: G.C.S., P.T.N. and K.P.M.; All authors have read and agreed to the
published version of the manuscript.
Funding: This research received no external funding.
Institutional Review Board Statement: Not applicable.
Informed Consent Statement: Not applicable.
Data Availability Statement: In this section, please provide details regarding where data support-
ing reported results can be found, including links to publicly archived datasets analyzed or gener-
ated during the study. Please refer to suggested Data Availability Statements in section “MDPI Re-
search Data Policies” at https://www.mdpi.com/ethics. You might choose to exclude this statement
if the study did not report any data.
Acknowledgments: The Authors would like to thank the Atmospheric Chemistry Laboratory of the
National Observatory of Athens for the access on the monitoring station at Thissio (Athens) for the
equipment comparison purposes.
Conflicts of Interest: The authors declare no conflict of interest.
References
1. Nastos, P.T.; Matzarakis, A. Weather Impacts on Respiratory Infections in Athens, Greece. Int J Biometeorol 2006, 50, 358–369,
doi:10.1007/s00484-006-0031-1.
2. Pope, C.A.; Dockery, D.W.; Schwartz, J. Review of Epidemiological Evidence of Health Effects of Particulate Air Pollution.
Inhalation Toxicology 1995, 7, 1–18, doi:10.3109/08958379509014267.
3. Pateraki, S.; Fameli, K.-M.; Assimakopoulos, V.; Bougiatioti, A.; Maggos, T.; Mihalopoulos, N. Levels, Sources and Health Risk
of PM2.5 and PM1-Bound PAHs across the Greater Athens Area: The Role of the Type of Environment and the Meteorology.
Atmosphere 2019, 10, 622, doi:10.3390/atmos10100622.
4. WHO Available online: https://www.who.int/westernpacific/health-topics/air-pollution (accessed on 26 April 2021).
5. Cities Alliance The Benefits of Urban Environmental Planning; I.C.L.E.I.: Washington D.C., USA, 2007; p. 162;.
6. Guerreiro, C.; González Ortiz, A.; Leeuw, F. de; Viana, M.; Horálek, J.; European Environment Agency Air Quality in Europe -
2016 Report; 2016; ISBN 978-92-9213-847-9.
7. Fu, H.; Chen, J. Formation, Features and Controlling Strategies of Severe Haze-Fog Pollutions in China. Science of The Total
Environment 2017, 578, 121–138, doi:10.1016/j.scitotenv.2016.10.201.
8. Tian, J.; Li, W. Pheromone-Based Genetic Algorithm Adaptive Selection Algorithm in Cloud Storage. International Journal of
Grid and Distributed Computing 2016, 9, 269–278, doi:10.14257/ijgdc.2016.9.6.25.
9. Wang, Y.; Yao, L.; Wang, L.; Liu, Z.; Ji, D.; Tang, G.; Zhang, J.; Sun, Y.; Hu, B.; Xin, J. Mechanism for the Formation of the
January 2013 Heavy Haze Pollution Episode over Central and Eastern China. Sci. China Earth Sci. 2014, 57, 14–25,
doi:10.1007/s11430-013-4773-4.
10. Tsiflikiotou, M.A.; Kostenidou, E.; Papanastasiou, D.K.; Patoulias, D.; Zarmpas, P.; Paraskevopoulou, D.; Diapouli, E.;
Kaltsonoudis, C.; Florou, K.; Bougiatioti, A.; et al. Summertime Particulate Matter and Its Composition in Greece. Atmospheric
Environment 2019, 213, 597–607, doi:10.1016/j.atmosenv.2019.06.013.Preprints (www.preprints.org) | NOT PEER-REVIEWED | Posted: 1 June 2021 doi:10.20944/preprints202106.0041.v1
11. Marinov, M.B.; Topalov, I.; Gieva, E.; Nikolov, G. Air Quality Monitoring in Urban Environments.; IEEE, May 2016; pp. 443–
448.
12. de Nazelle, A.; Seto, E.; Donaire-Gonzalez, D.; Mendez, M.; Matamala, J.; Nieuwenhuijsen, M.J.; Jerrett, M. Improving
Estimates of Air Pollution Exposure through Ubiquitous Sensing Technologies. Environmental Pollution 2013, 176, 92–99,
doi:10.1016/j.envpol.2012.12.032.
13. Aguiar, E.F.K.; Roig, H.L.; Mancini, L.H.; Carvalho, E.N.C.B. de Low-Cost Sensors Calibration for Monitoring Air Quality in
the Federal District—Brazil. JEP 2015, 06, 173–189, doi:10.4236/jep.2015.62019.
14. Borrego, C.; Costa, A.M.; Ginja, J.; Amorim, M.; Coutinho, M.; Karatzas, K.; Sioumis, Th.; Katsifarakis, N.; Konstantinidis, K.;
De Vito, S.; et al. Assessment of Air Quality Microsensors versus Reference Methods: The EuNetAir Joint Exercise. Atmospheric
Environment 2016, 147, 246–263, doi:10.1016/j.atmosenv.2016.09.050.
15. Cross, E.S.; Williams, L.R.; Lewis, D.K.; Magoon, G.R.; Onasch, T.B.; Kaminsky, M.L.; Worsnop, D.R.; Jayne, J.T. Use of
Electrochemical Sensors for Measurement of Air Pollution: Correcting Interference Response and Validating Measurements.
Atmospheric Measurement Techniques 2017, 10, 3575–3588, doi:10.5194/amt-10-3575-2017.
16. Jerrett, M.; Donaire-Gonzalez, D.; Popoola, O.; Jones, R.; Cohen, R.C.; Almanza, E.; de Nazelle, A.; Mead, I.; Carrasco-Turigas,
G.; Cole-Hunter, T.; et al. Validating Novel Air Pollution Sensors to Improve Exposure Estimates for Epidemiological Analyses
and Citizen Science. Environmental Research 2017, 158, 286–294, doi:10.1016/j.envres.2017.04.023.
17. Nguyen, N.H.; Nguyen, H.X.; Le, T.T.B.; Vu, C.D. Evaluating Low-Cost Commercially Available Sensors for Air Quality
Monitoring and Application of Sensor Calibration Methods for Improving Accuracy. Open Journal of Air Pollution 2021, 10, 1–
17, doi:10.4236/ojap.2021.101001.
18. Stavroulas, I.; Grivas, G.; Michalopoulos, P.; Liakakou, E.; Bougiatioti, A.; Kalkavouras, P.; Fameli, K.M.; Hatzianastassiou, N.;
Mihalopoulos, N.; Gerasopoulos, E. Field Evaluation of Low-Cost PM Sensors (Purple Air PA-II) Under Variable Urban Air
Quality Conditions, in Greece. Atmosphere 2020, 11, 926, doi:10.3390/atmos11090926.
19. Mead, M.I.; Popoola, O.A.M.; Stewart, G.B.; Landshoff, P.; Calleja, M.; Hayes, M.; Baldovi, J.J.; McLeod, M.W.; Hodgson, T.F.;
Dicks, J.; et al. The Use of Electrochemical Sensors for Monitoring Urban Air Quality in Low-Cost, High-Density Networks.
Atmospheric Environment 2013, 70, 186–203, doi:10.1016/j.atmosenv.2012.11.060.
20. Blythe, P.; Neasham, J.; Sharif, B.; Watson, P.; Bell, M.C.; Edwards, S.; Suresh, V.; Wagner, J.; Bryan, H. An Environmental
Sensor System for Pervasively Monitoring Road Networks. In Proceedings of the IET Road Transport Information and Control
- RTIC 2008 and ITS United Kingdom Members’ Conference; May 2008; pp. 1–10.
21. Weissert, L.F.; Alberti, K.; Miskell, G.; Pattinson, W.; Salmond, J.A.; Henshaw, G.; Williams, D.E. Low-Cost Sensors and
Microscale Land Use Regression: Data Fusion to Resolve Air Quality Variations with High Spatial and Temporal Resolution.
Atmospheric Environment 2019, 213, 285–295, doi:10.1016/j.atmosenv.2019.06.019.
22. Schneider, P.; Castell, N.; Vogt, M.; Dauge, F.; Lahoz, W.; Bartonova, A. Mapping Urban Air Quality in near Real-Time Using
Observations from Low-Cost Sensors and Model Information. Environment International 2017, 106,
doi:10.1016/j.envint.2017.05.005.
23. Lim, C.C.; Kim, H.; Vilcassim, M.J.R.; Thurston, G.D.; Gordon, T.; Chen, L.-C.; Lee, K.; Heimbinder, M.; Kim, S.-Y. Mapping
Urban Air Quality Using Mobile Sampling with Low-Cost Sensors and Machine Learning in Seoul, South Korea. Environment
International 2019, 131, 105022, doi:10.1016/j.envint.2019.105022.
24. Tasic, V.; Jovašević-Stojanović, M.; Topalovic, D.; Davidovic, M. Measurement of PM 2.5 Concentrations in Indoor Air Using Low-
Cost Sensors and Arduino Platforms; 2016;
25. de Oliveira, R.H.; Carneiro, C.; Almeida, F.; Meirelles, B.; Nunes, E.; Santos, A. Multivariate Air Pollution Classification in
Urban Areas Using Mobile Sensors and Self-Organizing Maps. International Journal of Environmental Science and Technology 2018,
16, doi:10.1007/s13762-018-2060-9.
26. Spinelle, L.; Gerboles, M.; Villani, M.G.; Aleixandre, M.; Bonavitacola, F. Calibration of a Cluster of Low-Cost Sensors for the
Measurement of Air Pollution in Ambient Air.; IEEE, November 2014; pp. 21–24.Preprints (www.preprints.org) | NOT PEER-REVIEWED | Posted: 1 June 2021 doi:10.20944/preprints202106.0041.v1
27. Boslaugh, S.; Watters, P.A. Statistics in a Nutshell; O’Reilly: Farnham, 2008; ISBN 978-0-596-51049-7.
28. Nastos, P.T.; Vassilakis, E.; Nastos, M.-P.P.; Charalampopoulos, I.; Matzarakis, A. Assessment of Continuous Sky View Factor
Based on Ultra-High Resolution Natural Colour Images Acquired by Remotely Piloted Airborne Systems for Applications in
an Urban Area of Athens. International Journal of Remote Sensing 2017, 38, 5814–5829, doi:10.1080/01431161.2017.1346845.
29. Wang, W.; Lu, Y. Analysis of the Mean Absolute Error (MAE) and the Root Mean Square Error (RMSE) in Assessing Rounding
Model. IOP Conf. Ser.: Mater. Sci. Eng. 2018, 324, 012049, doi:10.1088/1757-899X/324/1/012049.
30. Moustris, K.P.; Ziomas, I.C.; Paliatsos, A.G. 3-Day-Ahead Forecasting of Regional Pollution Index for the Pollutants NO2, CO,
SO2, and O3 Using Artificial Neural Networks in Athens, Greece. Water Air Soil Pollut 2010, 209, 29–43, doi:10.1007/s11270-
009-0179-5.
31. Argyropoulos, G.; Samara, C.; Diapouli, E.; Eleftheriadis, K.; Papaoikonomou, K.; Kungolos, A. Source Apportionment of
PM10 and PM2.5 in Major Urban Greek Agglomerations Using a Hybrid Source-Receptor Modeling Process. Science of The
Total Environment 2017, 601–602, 906–917, doi:10.1016/j.scitotenv.2017.05.088.
32. Paraskevopoulou, D.; Liakakou, E.; Gerasopoulos, E.; Mihalopoulos, N. Sources of Atmospheric Aerosol from Long-Term
Measurements (5years) of Chemical Composition in Athens, Greece. Science of The Total Environment 2015, 527–528, 165–178,
doi:10.1016/j.scitotenv.2015.04.022.
33. Jayaratne, R.; Liu, X.; Thai, P.; Dunbabin, M.; Morawska, L. The Influence of Humidity on the Performance of a Low-Cost Air
Particle Mass Sensor and the Effect of Atmospheric Fog. Atmos. Meas. Tech. 2018, 11, 4883–4890, doi:10.5194/amt-11-4883-2018.
34. AirNow.Gov Available online: https://www.airnow.gov/ (accessed on 11 February 2021).You can also read