What Drives Crypto? - Enterprai
←
→
Page content transcription
If your browser does not render page correctly, please read the page content below
What Drives Crypto?
                                                 Richard Mardiat
                                            Head of Research, Enterprai
                                                   March 15th, 2022

1      Introduction
The Russian invasion of Ukraine has underscored the increasing importance of cryptocurrencies. After war
broke out, the government of Ukraine took the unusual step of soliciting donations in Bitcoin, and within
a week received more than 42 million dollars worth of cryptocurrency donations, along with a large number
of NFTs based on digital artwork, some worth hundreds of thousands of dollars1. During that same week,
however, the BTC/USD spot rate shot up by around 17% before dropping again. These events provide a
window into the drivers of crypto spot rates, along with their relation to the broader crypto-related ecosystem.
    At Enterprai, we have developed a machine learning-based product called ”Feature Importance” that
identifies the drivers of a given asset’s price, across asset classes, including crypto. Using this as a tool and
focusing on the BTC/USD spot rate, we ask the questions: what generally drives crypto spot rates, and to what
extent do features and prices from traditional asset classes play an important role? We find that features and
asset prices from the broader crypto- and NFT-related ecosystem are the primary drivers, but that a number
of commodities and certain parts of the USD yield curve–namely 2s5s and 2s10s–are consistently influential.

2      Possible Drivers
When asking what drives the spot price of a traditional FX pair, there are a number of market and macroeco-
nomic variables to consider that are well known to be influential. For example, current and expected interest
rate differentials between the countries in question, economic growth, central bank activities, alternative
FX spot prices, FX options due to delta-hedging activity, and trade flows all affect FX spot rates through
overlapping and divergent pathways.
    The question of drivers for cryptocurrencies, however, poses a number of challenges because they differ
in fundamental ways from traditional currencies. Unlike traditional fiat money, they are not attached to any
country or currency zone, and therefore not anchored to any particular national economy; their supply is
not regulated by central banks, but algorithms, nor is their value typically backed by another asset 2. While
cryptocurrencies act as stores of value and to varying extents can be used as a medium of exchange, their decen-
tralized and algorithmic nature makes the analysis of what drives their prices both novel and relatively difficult.
    The way we approach this question is to first define the universe of possible drivers, which is the input
set to our proprietary Feature Importance algorithm. This input set allows us to determine the extent to
which variables/features from traditional asset classes, as well as features from the broader crypto ecosystem,
drive the BTC/USD spot rate. Note that this list is not complete, and there are certainly other features
to consider, but it nevertheless yields sufficient data to investigate our question. Briefly, we consider possible
drivers from the following categories:

     • Benchmark Global Equities Indices
    1 https://www.washingtonpost.com/technology/2022/03/03/ukraine-cryptocurrency-donations/
   2 Here we abstract from the institution of stable coins, whose values can be backed by traditional currencies and commodities

such as gold.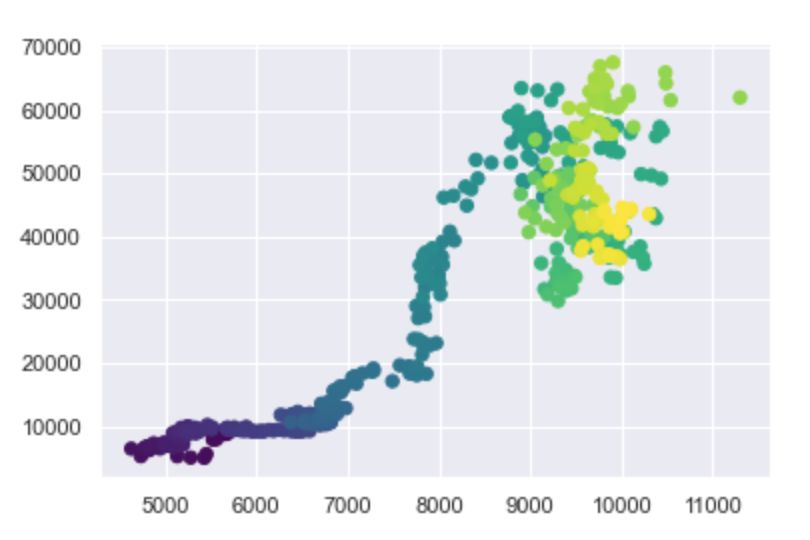
What Drives Crypto?                                                                                          14th March, 2022

     • Other FX pairs
     • Yields and Yield Spreads on the USD
     • Benchmark Commodity Prices (Energy & Metals)
     • Cyptocurrency Volumes and Other Crypto/USD Spot Rates

     • Basket of Crypto-linked and NFT-linked stock prices
     • Housing Market-Derived Data
     • Risk Environment e.g. VIX, Corporate Credit Spreads, US Treasury Operating Cash Balance

    Beside the more obvious inclusion of commodities, and risk indicators, at a high level there are several
main ideas behind these categories that warrant comment. The first is that crypto markets are not isolated
or independent, but are part of a general system of interlinked markets, whose price movements and activities
mutually influence each other. This why we include data from global equities indices, FX, rates, commodities,
and other crypto-related markets.
    A second idea stems from the fact that retail investors have been and remain–though this is changing–a
significant part of total cryptocurrency investment. In the last several decades there have been well doc-
umented changes to the US economy and the labor market3, which have impaired upward mobility and
increasingly skewed income and wealth distributions, all of which have contributed to changing attitudes
toward government and monetary regulation, as well as participation in traditional finance. At the same
time, however, the number of retail investors in the US is increasing4, and its composition is growing younger.
    We hypothesized that being priced out of the housing market, together with the wide-spread belief that
the traditional financial system is ’rigged against them’5 has altered risk preferences and potentiated the
shift in investment patterns away from property and safer, more traditional financial investments and toward
cryptocurrencies and related assets. To the extent that this story has truth in it, we attempted to capture
data related to it by including housing market-derived data, as well as stocks from the broader crypto-related
ecosystem, including firms related to crypto, crypto mining, blockchain technology, and NFT-linked firms,
with the notion being that perhaps the recent influx of retail investment is channeled disproportionately
into both cyptocurrencies as well as crypto-NFT-related equities.

3      Results
3.1        Feature Selection & Walk-Forward Forecasting
A critically important factor in the analysis of drivers of an asset’s price is the timeline considered. It is not
necessarily the case that the same features or variables drive an asset’s price over a long time horizon as com-
pared to a shorter one. Regimes change and co-integration breaks occur, and strong local relationships (in the
sense of time) can and do appear. In this piece, however, we focus on drivers over roughly the last three years,
and use the output of our Feature Importance algorithm to forecast the BTC/USD spot rate three days ahead.
    Specifically, we train a random forest on the output of our Feature Importance algorithm (the top drivers)
on the past three years’ data and then make out-of-sample forecasts of the BTC/USD spot rate three days
ahead6 for ten consecutive days at a time. We then iterate this process by sliding the training period forward
(by ten trading days), recomputing the top drivers, and forecasting in the same way–this is the ”walk forward”
method of testing time series predictions. In all, we have 120 (trading) days of out-of-sample forecasting
to assess, and we track the selected features for each of the twelve iterations during the walk-forward process
to determine the stability of the BTC/USD drivers.
    3 https://www.pewresearch.org/social-trends/2020/01/09/trends-in-income-and-wealth-inequality/
    4 https://deloitte.wsj.com/articles/the-rise-of-newly-empowered-individual-investors-01623870131
    5 https://www.bankrate.com/investing/stock-market-financial-security-march-2021/
    6 We   performed this exercise for both one, three, and five day ahead forecasts, and obtained similar results.

                                                                 2
What Drives Crypto? 14th March, 2022
3.2 Discussion & Interpretation
Figure 1 below shows the top 22 drivers of BTC/USD spot, whose importance has been weighted by the
random forest forecasting model. The way to interpret this is as follows: out of all features/drivers considered
(those of the Feature Importance input set), on average these are the 22 features that are most informative
over BTC/USD spot rates over the last three years. And these long-term drivers are most informative
in the sense that they are the best predictors of BTC/USD (3 days ahead). This logic is based on the
simple but strong requirement that ’if they drive, they should predict’. We find, moreover, that they do,
and Figure 2 below plots the out-of-sample forecasts versus the spot rates for the last 120 trading days,
where the random forest, trained only on the output of the Feature Importance algorithm, achieves over
60% directional accuracy over the timeline.
Importantly, Figure 1 shows that features from only four categories of possible drivers emerge out of the
eight outlined in Section 2 above. In order of frequency they are (1) spot prices from the basket of broader
crypto- and NFT-linked equities, (2) other crypto/USD spot rates and their volumes, (3) commodities, and
(4) parts of the USD yield curve. That more than half of the top drivers are features or asset prices from the
broader crypto-NFT universe, together with the fact that, with the exception of tin and iron ore, they are
ranked the most important suggests that crypto-NFT-linked features as a category are the primary drivers
of Bit/USD spot rates–at least over long time horizons.
3.2.1 Crypto-NFT Universe
The importance, indeed dominance, of features from the crypto-NFT-universe is a consistent finding across
time. This can be explained in part by the fact that the existence and supply of these currencies depends
on crypto mining activity (e.g. in the case of BTC) and blockchain technology, on which their accounting
and security depends. The influence of other crypto/USD spot rates and volumes can be explained by the
fact that they are proxies for total activity in crypto markets and likely reflect trade-offs stemming from
alternative cryptocurrency investment opportunities. Just as movement in one FX spot rate can induce
movement in others, the same is true for crypto spot rates.
The heavy NFT link is interesting but not surprising. Some cryptocurrencies (i.e. Ethereum) specifically
allow for the creation and exchange of NFTs. Even in the case of the recent Ukraine cryptocurrency
donations, a large fraction of the total value of donations were NFTs associated with digital works of art. In
fact, the crypto-NFT link is even tighter, in that new crypto projects, usually in the form of ”airdrops”, often
give out complimentary NFTs to those participating in order to attract new users. NFTs and NFT-related
firms are thus inextricably linked with cryptocurrencies, and the phenomenon of both can be seen as part
of an emergent socio-economic movement that prizes their digital, decentralized, and transparent nature.
And while we have not tested for this, it is plausible that some of these crypto spot rates are co-integrated
with some of the crypto-NFT-related equities prices.
3.2.2 Crypto-linked Commodities
Moving on to the yield curve features and commodities prices, it’s helpful to broaden the discussion to the
stability and consistency of drivers over time. It is one thing for a commodity price, a stock price, a part
of the yield curve, or something else to appear for a few iterations and then disappear. But the persistence
of a driver through time indicates a much stronger signal.
3What Drives Crypto? 14th March, 2022
Figure 1: Importance Weighting of Top 22 Drivers of BTC/USD Spot Rate Over Last Three Years
Figure 2: Three Day Ahead Out-of-Sample Forecasts (First Differences), BTC/USD Spot Rate
4What Drives Crypto? 14th March, 2022
Figure 3: Selected Feature/Driver Count Over Each Walk-Forward Iteration
In Figure 3 above, we can see the total number of iterations for which a feature was selected, conditional
on it having been selected at least once in the walk-forward process. This is a measure of the persistence
of the driver through time, the notion being that the more often a feature appears, the more consistent its
influence over the BTC/USD spot rate. We can see that tin and iron ore are selected each time, copper
most of the time, and natural gas one-third of the time. Why?
The appearance of these particular commodities are consistent findings over long time horizons, for which
there are several plausible interpretations. One is that metals and energy prices, particular copper and
tin, are raw inputs for the energy intensive computational power required for crypto mining, and broader
crypto-related infrastructure. Changes in the prices of these commodities can therefore influence the value of
crypto-related firms and trade-offs for investors. A second interpretation is due to the emergence of ”stable
coins”, a kind of cryptocurrency that can be asset- or commodity-backed. Such coins can facilitate the
investment in, and the ability to take possession of, specific commodities that are difficult to obtain in the
investor’s locale. While gold is often the commodity backing the coin, this, together with the ”raw inputs”
interpretation can create a strongly correlated, indeed causal network, between commodities on the one
hand, and cryptocurrencies on the other.
If these commodities prices really do drive BTC/USD spot rates, along with good predictive performance
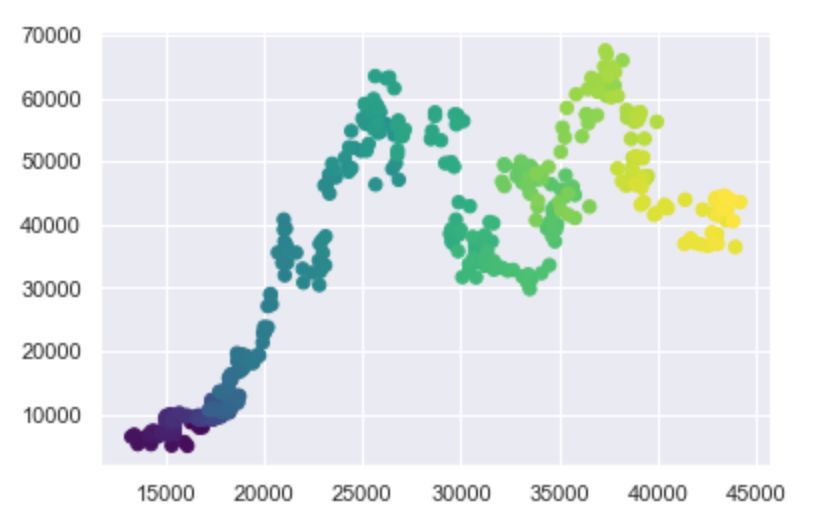
we should also see visual evidence of a clear relationship. Below in Figures 4 and 5, we see the BTC/USD
spot rate (y-axis) plotted as a function of tin and copper prices (on the x-axis), respectively. The colour
scheme indicates time, where the dark is further in the past and lighter closer to the present. This allows
us to trace how the relationship has unfolded in time. It is clear from the plots that the BTC/USD spot
rate had an increasing exponential relationship with these commodities prices until about one year ago or
roughly 250 trading days, when the relationship turned periodic.
5What Drives Crypto? 14th March, 2022
Figure 4: BTC/USD Spot vs Tin Spot: Last 500 Days
Figure 5: BTC/USD Spot vs Copper Spot: Last 500 Days
3.2.3 Rates Drivers of Crypto
Finally, the 2s5s and 2s10s (USD yield curve) appear more than half the time, showing that interest rate
signals are important features driving crypto spot rates. That it is 2s5s and 2s10s, and not 10s30s, for example,
suggests the cryptocurrency investment may possibly be used as hedge against, or at least is related to, shorter-
to-medium term inflation expectations. Alternatively, those parts of the yield curve may reflect trade-offs for
trading strategies involving the shorting of dollars and going long BTC–or the reverse–depending on the interest
6What Drives Crypto? 14th March, 2022
rates one can command for BTC, relative to US rates. Whatever the meaning of this signal, it is clear that
the first half of the yield curve is a reasonably persistent driver of BTC/USD, and together with commodity
prices is another well-known determinant of traditional FX pairs spot rates that carries over to crypto.
4 Conclusion
Using our proprietary Feature Importance algorithm, we have analyzed the drivers of the BTC/USD spot
rate and shown that its strongest drivers are features from the broader crypto-NFT universe, including other
crypto spot prices and volumes, together with crypto-NFT-related equities prices. On the other hand, we
have provided evidence that some of the traditional rates market features and commodities prices are highly
influential, particularly over longer time horizons.
To leave off with a thought-provoking question, we might ask how these drivers change over shorter time
horizons and different regimes? Our Feature Importance product allows the user to conduct this analysis
with rigor.
7You can also read