Weekly Equity Market Outlook - September 13 - 17 TBC Capital Brokerage

Page created by Diane Ellis
 
CONTINUE READING
Weekly Equity Market Outlook - September 13 - 17 TBC Capital Brokerage
Weekly Equity Market
Outlook
September 13 - 17
TBC Capital Brokerage

                        /
Weekly Equity Market Outlook - September 13 - 17 TBC Capital Brokerage
Executive Summary
                   Is Financial Crisis in China Imminent?                                             Commodities                                                           Investment Themes
USA & China Trade Distribution
                                                                                                 93.20                   ▲ 0.56%               • Hikes in Natural Gas, Coal and Aluminum are continuing to reach
                                                                                                  USD Index                   Weekly change
                                                                                                                                               record highs.
                                                                                                                                               • Evergrande lost 85% of its market capitalization from the
                                                                                                 71.97                  ▲ 2.16%                beginning of the year due to insolvency issues. This could cause
                                                                                                  Crude Oil                   Weekly change
                                                                                                                                               serious problems for real estate market.
                                                                                                                                               • Corporate tax hike appears to be one of the major risks for the
                                                                                                 47.03K                 ▲ 4.17%                equity valuations.
                                                                                                                                               • Many theorize that it will commence by cutting back bond buying
                                                                                                   Bitcoin                    Weekly change

                                                                                                                                               programs at the end of 2021 and hiking interest rates as early as at
                                                                                                 1.75K                  ▼ -2.40%               the end of 2022
                                                                                                    Gold                      Weekly change
2000                     2005        2010                         2015             2020

                      Rebounds in Industrials and Retail                                                              S&P 500 Performance YTD                                            Weekly Sector Performance
Retail Sales M-o-M                                                                                                                                                         22.89%     Sector                   ◯ Change
             Total
                                                                                                                                                                                                                   
                                             0.70%
        Nonstore                                                                   5.30%
                                                                                           20%                                                                                        Energy                   ▲       3.20%
         Furnitire                                                         3.70%                                                                              18.52%         19.69%
   General Merch.
 Food & Beverage
                                                                         3.50%                                                                                                        Consumer Discretionary   ▲       0.66%
                                                          1.80%
    Miscellaneous
Building Material
                                                      1.40%
                                                                                                                                                    15.31%                            Financials               ㅡ       0.00%
                                                 0.90%                                     15%
         Gasoline
Health & Personal
                                         0.20%
                                         0.20%                                                                                        13.14%                                          Real Estate              ㅡ       0.00%
         Clothing
      Restaurants
                                        0.10%
                                       0.00%
                                                                                                                                                     12.51%                           Health Care              ▼   -0.14%
  Sporting Goods       -2.70%
       Electronics -3.10%
                                                                                           10%                                                                                        Consumer Staples         ▼   -0.72%
            Autos -3.60%                                                                                                 7.72%
                                                                                                                                                                                      Information Technology ▼     -0.73%
                                                                                                              6.47%

• The two key reports that shaped last week’s economic sentiments                                                                                                                     Industrials              ▼   -1.60%
                                                                                           5%
                                                                                                                              5.08%
were the above-average retail sales and Industrial Production.                                                                                                                        Communication Services ▼     -2.24%
• The man reason for an increase in retail sales is back to school                                                    2.14%                                                           Utilities                ▼   -2.99%
spending as more and more schools and colleges are opening up.                             0% 0.69%           0.35%
                                                                                                      Feb 20… Mar 2…           Apr 20… May 2…   Jun 20… Jul 2021   Aug 2… Sep 20…     Materials                ▼   -3.19%
                                                                                                                                                                                                                           /
Weekly Equity Market Outlook - September 13 - 17 TBC Capital Brokerage
Macro Insights
                                                                                    Rebounds in Industrials and Retail
Retail Sales M-o-M
                                                                                 • The two main reports that shaped last week’s economic sentiments were the above-average retail sales and Industrial
            Total                             0.70%
                                                                                 Production.
        Nonstore                                                         5.30%
        Furnitire                                                3.70%           • According to U.S. department of Commerce, retail sales increased by 0.7% M-o-M instead of a decline in the same
  General Merch.                                                3.50%            amount, and the retail sales excluding autos came at 1.8%.
Food & Beverage                                         1.80%
   Miscellaneous                                      1.40%                      • Such an increase is contradictory with the general sentiment in the country, where many are concerned about the spread
Building Material                              0.90%                             of the delta variant and its contribution towards slowing down the economy.
        Gasoline                       0.20%
                                                                                 • The man reason for an increase in retail sales is back to school spending as more and more schools and colleges are
Health & Personal                      0.20%
        Clothing
                                                                                 opening up to in-person education; among retail – clothing store sales posted the largest increase of 38.8% Y-o-Y.
                                      0.10%
      Restaurants                     0.00%                                      • Similarly, the report on industrial production indicated that it grew by 0.4% in August. The value was significantly
  Sporting Goods     -2.70%                                                      negatively affected by hurricane Ida, however, it still surpassed the estimates and sits above the pre-pandemic levels.
      Electronics -3.10%
           Autos -3.60%

                                                                           The Economy Shows Signs of Cooling Down
                                                                                                                                       CPI and Core CPI M-o-M
• On the other hand, the initial jobless claims rose to 322,000 which, though lower than the numbers that were reported for             1.00%
most other months since the start of the pandemic, was above the economists’ expectations.
• CPI also posted an unexpected result as the Core CPI increased by lower-than-expected 0.1% M-o-M instead for the
forecasted 0.3%.                                                                                                                        0.50%

• These reports are always closely observed, but the latest ones hold particular importance as they will be taken into
consideration by the Fed at the meeting scheduled on September 21-22.
                                                                                                                                        0.00%
• Some economists consider that due to a disappointing nonfarm payroll number, a slight increase in initial public claims,
and insignificant CPI increase – the FOMC might consider that the delta variant is already cooling down the economy
significantly and a further tapering might not be necessary yet. Such a position is further complemented by the recent
                                                                                                                                       -0.50%
downgrades of expected economic activity by banks such as Goldman Sachs.
• Therefore, Fed will have to be especially careful not to cause a panic in the markets and over-cool the economy through
                                                                                                                                                   Jan 2020   Apr 2020   Jul 2020   Oct 2020   Jan 2021   Apr 2021   Jul 2021
contractionary policies.                                                                                                                  CPI   Core CPI
                                                                                                                                                                                                                                /
Commodities and FX
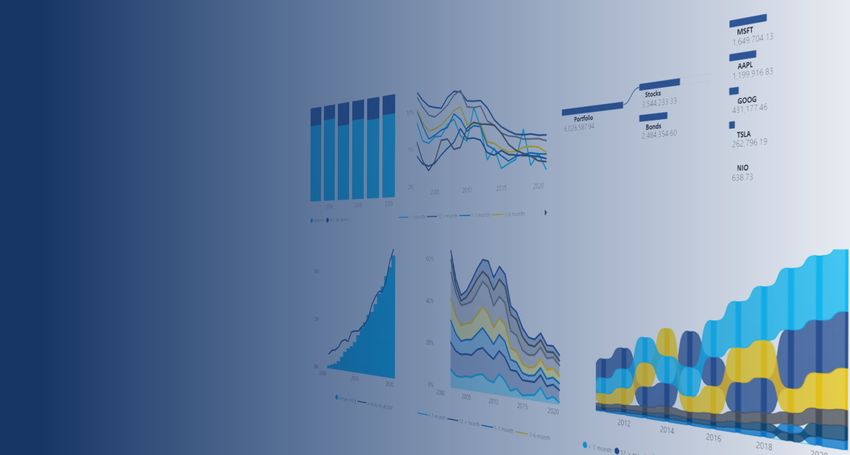
                                                   USD Index                                                                                                       Bitcoin (BTC)
                                                               • The U.S. Dollar Index had a successful                                                                            • The cryptocurrency giant hovered
       ▲ 0.56%                               93.20             week as it passed the hurdle of 93 and                ▲ 4.17%                             47.03K                    around the $47,000 level before dropping
       USD Index Weekly change                Last Price                                                              Bitcoing Weekly change
                                                               increased from 92.58 to 93.34                                                                   Last Price
                                                                                                                                                                                   to just above $45,000 on Sunday.
                                                                                                             52K
93.5                                                           • Some reasons for the increase are the                                                                             • The famous meme stock announced that
                                                               fact that yields increased and investors                                                                            it will accept payments through Bitcoin,
                                                               are waiting for Fed to announce tapering      50K                                                                   Ethereum, Litecoin in attempts to make
93.0
                                                               at their next meeting. The 52 week high                                                                             cryptocurrency more flexible and
                                                               for the index was observed almost a year                                                                            applicable for day-to-day use. The price
                                                               ago at 94.74.                                 48K
                                                                                                                                                                                   keeps posting modest increases each time
                                                               • Under such high uncertainty and                                                                                   companies announce news like that.
92.5
                                                               hawkish FOMC sentiments, the dollar           46K
                                                                                                                                                                                   • Protests in El Salvador are continuing as
                                                               index might increase further as equities                                                                            complaints have been made about
                                                               markets are tumbling.                                                                                               government’s purchases of the
92.0
         Aug 22            Aug 29   Sep 05          Sep 12
                                                                                                             44K
                                                                                                                       Aug 22            Aug 29      Sep 05          Sep 12
                                                                                                                                                                                   cryptocurrency and its implementation.

                                               Crude Oil WTI                                                                                                                Gold
                                                               • Oil was affected by several contrasting                                                                           • Like many other precious metal prices,
       ▲ 2.16%                               71.97             events last week, which caused it to                  ▼ -2.40%                                 1.75K                the price of gold is heavily reliant on
       Crude Oil Weekly change                Last Price                                                               Gold Weekly change                      Last Price
                                                               fluctuate between $70.45 per barrel and                                                                             expectations of future economic policies,
                                                                                                             1,840
72
                                                               $72.61.                                                                                                             and since Fed’s meeting is scheduled on
                                                               • A higher-than-expected decrease in                                                                                September 21-22 (with many investors
70                                                             inventories indicated that the demand         1,820
                                                                                                                                                                                   expecting an announcement of tapering)
                                                               for Oil has increased and was bullish for                                                                           it has negatively affected the commodity.
68                                                             the commodity. OPEC also announced            1,800                                                                 • By the end of last week gold fell to
                                                               that the demand is expected to exceed                                                                               $1751.4 per ounce – hitting a month low.
66                                                             pre-pandemic levels next year.                1,780                                                                 • The precious metal will fall further if Fed
                                                               • On the other hand, the prices were                                                                                announces tapering as it will cause hikes
64
                                                               negatively affected by a firmer dollar that                                                                         in the U.S. Dollar index and make the
                                                                                                             1,760
                                                               put a downward pressure on the                                                                                      precious metal more expensive to
62
        Aug 22            Aug 29    Sep 05          Sep 12     commodity and partially offset the hike.                  Aug 22             Aug 29   Sep 05           Sep 12       foreigners.
                                                                                                                                                                                                                                   /
Chart of The Week
                                           Is Financial Crisis in China Imminent? Will it Spread Around The World?
Trade With USA and China 2000                                    Trade With USA and China 2020                                                                     USA & China Trade Distribution

                                                   ©
                                                   © 2021
                                                     2021 TomTom,
                                                          TomTom, ©
                                                                  © 2021
                                                                    2021 Microsoft
                                                                         Microsoft Corporation
                                                                                   Corporation                       ©
                                                                                                                     © 2021
                                                                                                                       2021 TomTom,
                                                                                                                            TomTom, ©
                                                                                                                                    © 2021
                                                                                                                                      2021 Microsoft
                                                                                                                                           Microsoft Corporation
                                                                                                                                                     Corporation
                                                                                                                                                                   2000     2005     2010     2015   2020

It has been a tough week for Chinese Securities Market. Evergrande, Chinese real estate company, with almost 300 million in debt is failing. Company is out of cash and
is expected to default on its Bank loans on Monday and its bonds on Thursday. Share price of Evergrande decreased more than 85% from its all-time high, causing
major Asian Indexes to fall, such as Heng Seng Index is down 6% over the week. Failure of the Evergrande might spread over other Chinese companies probably causing
the financial crisis in China. Chinese securities analysts are expecting that banks will be affected as well. China is the second largest economy in the world and more
than 75% of world does trade with China. Possible financial crisis might have contagion effect to other markets because of its size and importance in world economy.
Critically enough, major US Equity index, S&P 500, which was in bullish trend and was trading above 50 day Exponential moving average more than 6 month, on Friday
broke down its trend and now is trading below 50 day moving average. Possible corporate tax rate hike and interest rate hike by the end of the year, combined with
probable financial crisis in China, might cause decrease in global equity prices.
                                                                                                                                                                                                        /
Investment Themes
               Co-dependence Among Commodities Fosters Instability                                                                                            China Evergrande as a Systematic Risk for Economy
Natural Gas, Coal and Aluminum Performance                       • Commodities have had a turbulent several months as gold and         Evergrande Group Price                                    • China Evergrande Group was the biggest real estate developer
                                                                 other precious metals have suffered repeatedly due to fears of                                                                  and property service provider in china. The company lost 85% of
250%
                                                                 interest rate hikes and tapering, while others such as coal –                                                                   its market capitalization from the beginning of the year.
                                                                 increased exponentially in recent months.                             15                                                        Evergrande has been struggling to raise funds to pay its many
                                                                 • The case of falling precious metal prices is logical as such                                                                  lenders, suppliers and investors. Company is due to pay $84m
200%                                                             commodities typically under-perform in a rising interest rates                                                                  and $48m on 23 and 29 September respectively. Both bonds
                                                                 environment; however, it is important to analyze the hikes in                                                                   would default within 30 days of the scheduled payment dates if
                                                                 Coal, Aluminum, and Gas.                                              10
                                                                                                                                                                                                 company fails to pay.
150%                                                             • For example, the increasingly high temperatures this summer,                                                                  • Evergrande grew to be one of China's biggest companies by
                                                                 increased electricity consumption, which increased demand for                                                                   borrowing more than $300bn. The company accounts for almost
                                                                 coal and hydro-power, supply of which was limited due to HSE                                                                    16% of China's outsdanding corporate junk bonds. Investors
100%
                                                                 regulations and droughts, (respectively). The strain on electricity                                                             became worried about debt crisis in china and Hong Kong’s
                                                                                                                                        5
                                                                 supply also limited aluminum production and smelting.                                                                           broader stock market lower as contagion fears spread.
                                                                 • As the global emphasis on clean and renewable energy                                                                          • "The financial fallout would be far reaching. Evergrande
50%
                                                                 sources is increasing, it is important to make sure that they are                                                               reportedly owes money to around 171 domestic banks and 121
       2017      2018         2019       2020      2021          not codependent and a supply shortage for one will not weigh                    Feb Mar Apr May Jun Jul Aug Sep                 other financial firms," the Economist Intelligence Unit's (EIU)
   Aluminium   coal     Natural Gas
                                                                 considerably on others.                                                        2021 2021 2021 2021 2021 2021 2021 2021          Mattie Bekink told the BBC.

                          Corporate Tax Rate Hike: Way to Fund A Deficit                                                                                                             Investors Awaiting FOMC
US Effective Tax Rate By Periods                                 • Corporate tax hike appears to be one of the major risks for the     Fed Total Assets and Funds Rate                           • Investors worldwide have been speculating the start date of
40%                                                              equity valuations. This week House Democrats outlined tax                                                                       tapering, many theorizing that it will commence by cutting back
                                                                 increases they aim to use to offset up to $3.5 trillion in spending   8M                                                    5   bond buying programs at the end of 2021 and hiking interest
38%                                                              on the social safety net and climate policy. The tax plans could                                                                rates as early as at the end of 2022.
                                                                 change as Democrats try to craft and pass a final bill next week.                                                           4
                                                                                                                                                                                                 • Fed was waiting for the economy to demonstrate substantial
36%                                                              • Among the many components of the Biden tax plan are an              6M                                                        progress, and though many indicators have recovered
                                                                 increase in the domestic corporate tax rate to 28% from 21% and                                                                 significantly since pandemic-lows, there are still contradictory
34%                                                              the top individual income tax rate to 39.6% from 37%. The White                                                             3   reports that indicate that the economy is slowing down due to the
                                                                 House also wants to raise the capital gains tax rate on those         4M                                                        surge in delta cases.
32%                                                              making more than $1 million a year from its current 20% to                                                                  2
                                                                                                                                                                                                 • Therefore, investors are awaiting Fed’s meeting scheduled on
                                                                 39.6%.                                                                                                                          September 21-22 when many expect that the central bank will
30%                                                              • “Such tax increases would make the United States                    2M
                                                                                                                                                                                                 announce its tapering plans. According to Goldman Sachs, there is
                                                                 uncompetitive as a place to do business and make U.S.                                                                       1   a 70% chance for tapering to commence in Q4, 2021.
28%                                                              companies uncompetitive globally,” said Joshua Bolten, chief                                                                    • Investors will pay attention to not only tapering, but also (more
                                                                 executive of the Business Roundtable, which represents about                                                                    importantly) indicators of interest rate hikes. Ahead of the
                                                                                                                                       0M                                                    0
                                                                 200 large U.S. companies, when the measures were first                  2005              2010            2015       2020       meeting, equities markets and commodities tumbled as
26%
        2000          2005        2010      2015          2020   announced on March 31.                                                 Fed Total Assets   Fed Funds Rate, Percent               uncertainty increased significantly and volatility soared.
                                                                                                                                                                                                                                                                   /
Sector Snapshot
                                                                                                 13.34                    -0.73%            35.80                27.20                   STOCKS TO WATCH                TICKER   MARKET CAP CLOSE            CHANGE P/E              EV/EBITDA
                    Information Technology                                                       Market Cap (Trillions)   Weekly Change     P/E                  EV/EBITDA
                                                                                                                                                                                                                                 

                                                                                                                                                                                         Apple Inc                      AAPL             2,414bn   146.06     -2.33%      26.01           19.69
Sector Comparison to S&P 500 Performance                                                         • Apple (AAPL) had its first fall event on Tuesday, iPhone 13 lineup and the Watch      Microsoft Corp                 MSFT             2,253bn   299.87      0.97%      29.72           20.33
25%
                                                                                                 Series 7 were published. The device specs matched previous reports and leaks,           Taiwan Semiconductor-Sp Adr TSM                  611bn    117.75     -4.75%      15.82           12.36
                                                                                                 though this lack of surprise combined with the off-year cycle could be driving the      Alibaba Group Holding-Sp       BABA              435bn    160.05     -3.24%      14.25            9.77
20%                                                                                              share pressure. Skyworks Solutions (SWKS) whose tech helps power the iPhone's           Adr
                                                                                                                                                                                         Sea Ltd-Adr                    SE                187bn    339.81      5.18%                     244.70
                                                                                                 wireless communications, Modem supplier Qualcomm (QCOM), display glass
                                                                                                                                                                                         Qualcomm Inc                   QCOM              151bn    133.60     -6.84%      14.50           10.63
15%                                                                                              supplier Corning (GLW), Memory provider Micron (MU) and a contract
                                                                                                                                                                                         Jd.Com Inc-Adr                 JD                121bn     77.69     -3.09%      37.84           25.35
                                                                                                 manufacturer for the Watch Jabil (JBL) all suppliers share prices are under pressure.
                                                                                                                                                                                         Micron Technology Inc          MU                 84bn     74.30     -0.07%          6.47         3.88
                                                                                                 • Microsoft (MSFT) board approves new share buyback of up to $60B in shares;
10%                                                                                                                                                                                      Didi Global Inc                DIDI               40bn      8.30     -4.27%
                                                                                                 raises quarterly dividend 11% to 62 cent per share. Sea (SE) upgraded to Buy from       Corning Inc                    GLW                33bn     38.39     -1.44%      15.96            8.94
                                                                                                 Hold at Stifel and raise Target price to $400 from $325, saying with attractive         Perrigo Co Plc                 PRGO                6bn     43.94     -2.27%      15.42           12.60
5%                                                                                               gaming margins, Sea is well positioned to invest in its burgeoning eCommerce and
                                                                                                                                                                                         ETFs TO WATCH                   TICKER TOTAL ASSETS CLOSE            CHANGE      YTD          Expense
                                                                                                 financial services segments.                                                                                                    

0%                                                                                               • U.S. listed China names fall again Alibaba (BABA), JD.com (JD), DiDi Global (DIDI)    Invesco QQQ Trust               QQQ               193bn     373.83      -0.73%       20.86%     0.20%
                                                                                                 with more goverment regulation impact as China will accelerate the drafting and         Vanguard IT ETF                 VGT                51bn     418.87      -0.45%       20.40%     0.10%

                                                                                                 implementation of laws to prevent online crimes, rules for online information           Technology Select SPDR          XLK                45bn     155.48      -0.73%       21.56%     0.12%
-5%
         Feb 2021   Mar 2021   Apr 2021   May 2021   Jun 2021   Jul 2021   Aug 2021   Sep 2021                                                                                           Fidelity IT                     FTEC                6bn     123.48      -0.65%       20.07%     0.08%
                                                                                                 management and the protection of minors on the internet, Xinhua reported.
 Information Technology        S&P 500                                                                                                                                                   SPDR Semiconductor              XSD                 1bn     205.61      0.79%        21.10%     0.35%

                                                                                                 6.46                     -0.14%            25.40                20.10                   STOCKS TO WATCH                TICKER       MARKET CAP CLOSE        CHANGE     P/E          EV/EBITDA
                                  Health Care                                                    Market Cap (Trillions)   Weekly Change     P/E                  EV/EBITDA
                                                                                                                                                                                         Pfizer Inc                     PFE
                                                                                                                                                                                                                                     

                                                                                                                                                                                                                                           246bn     43.89     -1.55%     12.09          10.34
Sector Comparison to S&P 500 Performance                                                         • The FDA advisory panel endorsed emergency approval for the Pfizer (PFE)               Thermo Fisher Scientific Inc   TMO                235bn    596.80      6.74%     29.59          23.25
25%                                                                                                                                                                                      Eli Lilly & Co                 LLY                220bn    230.10     -3.30%     26.71          24.12
                                                                                                 /BioNTech (BNTX) Covid-19 vaccine booster shots for those aged 65 and over or at
                                                                                                                                                                                         Moderna Inc                    MRNA               174bn    430.05      2.46%     16.33          11.70
                                                                                                 high risk for severe disease
20%                                                                                                                                                                                      Biontech Se-Adr                BNTX                87bn    359.18      9.79%         7.87        5.81
                                                                                                 • BeiGene Ltd (BGNE) surged amid FDA approval of BRUKINSA (Zanubrutinib) in
                                                                                                                                                                                         Regeneron Pharmaceuticals      REGN                70bn    651.88      1.93%     14.28           9.65
                                                                                                 relapsed or refractory marginal zone lymphoma
                                                                                                                                                                                         Beigene Ltd-Adr                BGNE                38bn    403.14     10.68%
15%                                                                                              • The FDA authorized Eli Lilly‘s (LLY) Covid-19 antibody cocktail for use as a          Curevac Nv                     CVAC                10bn     55.11    -16.56%         6.95        3.11
                                                                                                 prophylaxis in people who have been exposed to the virus, giving a boost to the         Abcellera Biologics Inc        ABCL                 6bn     20.36     14.83%
10%                                                                                              beleaguered shares of AbCellera Biologics (ABCL), one of Lilly’s partners on the        Protagonist Therapeutics Inc   PTGX                 1bn     17.53    -61.38%
                                                                                                 development of Balmanivimab, one of the two antibodies in the cocktail                  Innate Pharma Sa-Spons Adr     IPHA                 1bn      8.10     43.36%
5%                                                                                               • Regeneron Pharmaceuticals (REGN) rises after being awarded a $2.94B
                                                                                                                                                                                         ETFs TO WATCH                  TICKER TOTAL ASSETS        CLOSE      CHANGE     YTD           Expense
                                                                                                 modification to a contract for 1.4M REGEN-COV antibody therapeutic doses by                                                     

                                                                                                                                                                                         Health Care Select SPDR        XLV                 33bn    133.00      -0.14%        17.75%     0.12%
0%
                                                                                                 Department of Defense (DOD)
                                                                                                                                                                                         Vanguard Healthcare            VHT                 17bn    258.79      -0.07%        16.27%     0.10%
                                                                                                 • Thermo Fisher Scientific (TMO) rallied to a new high after presenting optimistic
                                                                                                                                                                                         iShares Biotechnology          IBB                 11bn    173.61      0.22%         15.36%     0.47%
                                                                                                 forecast for fiscal 2022 as demand booms amid the pandemic
-5%                                                                                                                                                                                      ARK Genomic Revolution         ARKG                 8bn     83.93      0.23%         -9.89%     0.75%
         Feb 2021   Mar 2021   Apr 2021   May 2021   Jun 2021   Jul 2021   Aug 2021   Sep 2021
                                                                                                 • Protagonist Therapeutics (PTGX) plunged more than 60% after FDA put a clinical
                                                                                                                                                                                         SPDR S&P Biotech               XBI                  7bn    132.88      0.88%         -5.73%     0.35%
 Health Care   S&P 500                                                                           hold on Rusfertide studies
                                                                                                                                                                                                                                                                                                 /
Sector Snapshot
                     Consumer Discretionary                                                       6.34
                                                                                                  Market Cap (Trillions)
                                                                                                                           0.66%
                                                                                                                           Weekly Change
                                                                                                                                             42.00
                                                                                                                                             P/E
                                                                                                                                                                  24.60
                                                                                                                                                                  EV/EBITDA
                                                                                                                                                                                          STOCKS TO WATCH                TICKER MARKET CAP CLOSE
                                                                                                                                                                                                                                    
                                                                                                                                                                                                                                                              CHANGE         P/E       EV/EBITDA

                                                                                                                                                                                          Amazon.Com Inc                 AMZN            1,754bn 3,462.52           0.15%      42.10          19.85
Sector Comparison to S&P 500 Performance
                                                                                                  • Wedbush Securities stays positive on Tesla (TSLA) despite the near-term chip          Tesla Inc                      TSLA             761bn     759.49          2.22%     105.68          54.77
                                                                                                                                                                                          Mcdonald'S Corp                MCD              181bn     242.49          0.53%      24.59          18.08
20%                                                                                               shortage issues impacting the supply chain. Analyst Dan Ives thinks Tesla can get
                                                                                                                                                                                          Philip Morris International    PM               159bn     101.86         -0.71%      15.23          11.82
                                                                                                  close to 900 K deliveries this year with a strong second half and track toward 1.3 M
                                                                                                                                                                                          Altria Group Inc               MO                90bn      48.61         -2.94%      10.06           9.23
                                                                                                  in 2022.
10%                                                                                               • JPMorgan Chase (JPM) goes live with credit card payments processing for               ETFs TO WATCH                  TICKER TOTAL ASSETS CLOSE
                                                                                                                                                                                                                                    
                                                                                                                                                                                                                                                              CHANGE          YTD           Expense

                                                                                                  Alibaba.com, the B2B unit of Alibaba Group (BABA). Working with Alipay, the             Consumer Disc. Select SPDR     XLY                20bn     184.11          0.66%     15.49%         0.12%

0%
                                                                                                  fintech platform operated by Ant Group, J.P. Morgan Merchant Services, now              Vanguard Consumer Disc.        VCR                 7bn     320.44          0.67%     17.96%         0.10%
                                                                                                  powers payments made by U.S. credit cards on Alibaba.com.                               First Trust Consumer Disc.     FXD                 2bn      61.31          1.05%     22.72%         0.63%
          Feb 2021   Mar 2021   Apr 2021   May 2021   Jun 2021   Jul 2021   Aug 2021   Sep 2021   • Beyond Meat (BYND) will be supplying McDonald's (MCD) in 245 restaurants in           Fidelity Consumer Disc.        FDIS                2bn      82.73          0.62%     17.10%         0.08%
 Consumer Discretionary         S&P 500                                                           Netherlands. Also Sweden, Denmark and Austria in future with pea-protein meat.          SDPR S&P Retail                XRT                 1bn      94.38          1.65%     48.54%         0.35%

                                                                                                  5.71                     -2.24%            27.80                20.40
                     Communication Services                                                       Market Cap (Trillions)   Weekly Change     P/E                  EV/EBITDA
                                                                                                                                                                                          STOCKS TO WATCH               TICKER MARKET CAP
                                                                                                                                                                                                                                
                                                                                                                                                                                                                                                  CLOSE      CHANGE P/E               EV/EBITDA

                                                                                                                                                                                          Alphabet Inc-Cl C             GOOG            1,882bn 2,829.27      -1.40%         22.55             15.27
Sector Comparison to S&P 500 Performance
                                                                                                  • Dish Network (DISH) selected IBM’s artificial intelligence-powered automation         Walt Disney Co/The            DIS              333bn     183.47     -0.82%         37.12             22.00
                                                                                                  and network orchestration software and services for its cloud-native 5G network.        Netflix Inc                   NFLX             261bn     589.35         0.01%      45.33             32.58
20%                                                                                                                                                                                       Dish Network Corp-A           DISH              22bn      42.48     -4.02%         13.93              9.77
                                                                                                  • Live Nation Entertainment (LYV) agreed to proceed with its previously announced
                                                                                                                                                                                          Live Nation Entertainment In LYV                19bn      86.83     -2.56%        108.81             19.69
                                                                                                  acquisition of a 51% controlling interest in OCESA Entretenimiento, a leading
                                                                                                  promoter in Latin America and owner of Ticketmaster Mexico from CIE, a                  ETFs TO WATCH                  TICKER TOTAL ASSETS CLOSE            CHANGE         YTD            Expense
10%                                                                                                                                                                                                                             
                                                                                                  prominent player in the live entertainment industry in Latin America.                   Com.Services Select SPDR       XLC                16bn      83.14         -1.33%         25.06%     0.12%
                                                                                                  • The Walt Disney Company (DIS) Shang-Chi and the Legend of the Ten Rings               Vanguard Com.Services          VOX                 5bn     146.59         -1.01%         23.85%     0.10%

0%
                                                                                                  grossed $35.8M in its second-weekend follow-up, bringing its cumulative domestic        First Trust Indxx ETF          NXTG                1bn      79.03         -0.19%         14.16%     0.70%
          Feb 2021   Mar 2021   Apr 2021   May 2021   Jun 2021   Jul 2021   Aug 2021   Sep 2021
                                                                                                  box office to $145.6M.                                                                  Fidelity Com.Services          FCOM                1bn      55.41         -1.34%         23.54%     0.08%
 Communication Services         S&P 500                                                                                                                                                   Ishares Global Com.Services    IXP                 0bn      87.44         -1.75%         18.77%     0.46%

                                                                                                  5.73                     0.00%             17.10                6.20
                                     Financials                                                   Market Cap (Trillions)   Weekly Change     P/E                  EV/EBITDA
                                                                                                                                                                                          STOCKS TO WATCH                TICKER MARKET CAP CLOSE
                                                                                                                                                                                                                                    
                                                                                                                                                                                                                                                                  CHANGE P/E           EV/EBITDA

                                                                                                                                                                                          Jpmorgan Chase & Co            JPM              471bn       157.68        -1.36%     13.37
Sector Comparison to S&P 500 Performance
40%
                                                                                                  • JPMorgan Chase (JPM) hires two executives from Charles Schwab's TD                    Paypal Holdings Inc            PYPL             325bn       276.34        -1.48%     46.81           34.30
                                                                                                  Ameriatrade and Goldman Sachs to boost its online investing business that lagged        Wells Fargo & Co               WFC              191bn           46.47      1.55%     12.96

                                                                                                  due to rise of online brokerage firms like Robinhood markets (HOOD).                    Goldman Sachs Group Inc        GS               138bn       391.46        -4.35%     10.53           12.95
                                                                                                                                                                                          Greensky Inc-Class A           GSKY               2bn           11.62     31.30%     19.37           10.94
20%                                                                                               • GreenSky (GSKY) shares shoot up 50% after online lender agrees to be acquired
                                                                                                                                                                                          ETFs TO WATCH                 TICKER TOTAL ASSETS CLOSE             CHANGE         YTD        Expense
                                                                                                  by Goldman Sachs (GS) for $2.24B. The exchange ratio will be 0.03 shares of GS                                                
                                                                                                  per GSKY share, its approximately $12 per share.                                        Financial Select SPDR         XLF                40bn      37.58          0.00%      29.23%         0.12%
0%                                                                                                • Wells Fargo (WFC) selects Microsoft (MSFT) Azure and Google (GOOG) as part of         Vanguard Financials           VFH                11bn      92.84          0.15%      29.29%         0.10%
                                                                                                  its digital infrastructure strategy that combines a multi-cloud approach with third-    iShares Global Financials     IXG                 3bn      78.51         -0.41%      21.70%         0.46%
          Feb 2021   Mar 2021   Apr 2021   May 2021   Jun 2021   Jul 2021   Aug 2021   Sep 2021
                                                                                                  party data centers to improve "technological speed, agility, and scalability" for its   SPDR S&P Bank                 KBE                 3bn      50.52          0.20%      22.00%         0.35%
 Financials   S&P 500                                                                             customers and employees.                                                                SPDR S&P Insurance            KIE                 0bn      38.16         -0.96%      16.70%         0.35%
                                                                                                                                                                                                                                                                                                      /
Sector Snapshot
                                        Industrials                                                   7.56
                                                                                                      Market Cap (Trillions)
                                                                                                                               -1.60%
                                                                                                                               Weekly Change
                                                                                                                                                 26.10
                                                                                                                                                 P/E
                                                                                                                                                                       15.80
                                                                                                                                                                       EV/EBITDA
                                                                                                                                                                                             STOCKS TO WATCH               TICKER MARKET CAP CLOSE
                                                                                                                                                                                                                                   
                                                                                                                                                                                                                                                               CHANGE      P/E          EV/EBITDA

                                                                                                                                                                                             Quanta Services Inc           PWR               16bn    118.42       2.83%      21.40           12.67
Sector Comparison to S&P 500 Performance
                                                                                                      • MasTec Inc. (MTZ) and Quanta Services Inc. (PWR) soared after Goldman Sachs          Rocket Lab Usa Inc            RKLB               7bn     15.41       0.06%
                                                                                                                                                                                             Mastec Inc                    MTZ                7bn     89.61      -1.14%      15.09            8.58
20%                                                                                                   initiated both with buys, favoring their exposure to long-term secular growth
                                                                                                                                                                                             Avis Budget Group Inc         CAR                6bn     95.32       5.56%      12.80           23.53
                                                                                                      trends within modernization of America’s aging utility infrastructure, transition to
                                                                                                                                                                                             Lion Electric Co/The          LEV                2bn     13.09      12.36%                     138.11
                                                                                                      renewable power generation, and evolution of 5G infrastructure
10%                                                                                                   • Avis Budget Group (CAR) soared after Bank of America upped its rating to Buy,        ETFs TO WATCH                 TICKER TOTAL ASSETS CLOSE
                                                                                                                                                                                                                                   
                                                                                                                                                                                                                                                               CHANGE       YTD           Expense

                                                                                                      saying it expects many of the macro factors driving "over-earning" by the car rental   The Industrial Select SPDR    XLI                17bn    100.33      -1.60%     16.11%         0.12%

0%
                                                                                                      company in 2021 will likely persist well into 2022                                     Vanguard Industrials          VIS                 5bn    191.91      -1.36%     15.51%         0.10%
                                                                                                      • Rocket Lab USA (RKLB) declined after Barron’s warned about high valuation and        U.S. Global Jets              JETS                3bn     22.75       2.39%         5.37%      0.60%
              Feb 2021   Mar 2021   Apr 2021   May 2021   Jun 2021   Jul 2021   Aug 2021   Sep 2021   issued a sell recommendation. The stock reached its all-time high, gaining more        ishares Transportation        IYT                 1bn    245.91      -0.83%     13.83%         0.42%
 Idustrials      S&P 500                                                                              than 100% in the previous week.                                                        Fidelity Industrials          FIDU                1bn     52.86      -1.82%     15.24%         0.08%

                                                                                                      2.86                     -0.72%            23.70                 16.50
                                Consumer Staples                                                      Market Cap (Trillions)   Weekly Change     P/E                   EV/EBITDA
                                                                                                                                                                                             STOCKS TO WATCH              TICKER       MARKET CAP CLOSE
                                                                                                                                                                                                                                       
                                                                                                                                                                                                                                                              CHANGE P/E            EV/EBITDA

                                                                                                                                                                                             Procter & Gamble Co/The      PG                351bn    144.34     -0.92%     22.73             16.33
Sector Comparison to S&P 500 Performance
                                                                                                      • PepsiCo (PEP) and Beyond Meat's (BYND) joint venture titled The PLANeT               Pepsico Inc                  PEP               213bn    154.13     -1.05%     23.01             16.01

20%                                                                                                   Partnership is aiming to release its products made from plant-based proteins in        Colgate-Palmolive Co         CL                 64bn     76.23     -1.49%     22.15             15.00

                                                                                                      early 2022.                                                                            General Mills Inc            GIS                36bn     58.92      0.49%     15.20             12.83
                                                                                                                                                                                             Beyond Meat Inc              BYND                7bn    112.95      0.01%                      310.11
10%                                                                                                   • Colgate-Palmolive (CL) declares $0.45/share quarterly dividend, in line with
                                                                                                      previous. Dividend yield totaling 2.34%.                                               ETFs TO WATCH                TICKER TOTAL ASSETS CLOSE            CHANGE      YTD            Expense
                                                                                                                                                                                                                                   

 0%
                                                                                                      • Credit Suisse (CS) lowers General Mills (GIS) to a Neutral rating after having it    Consumer Staples SPDR        XLP                 13bn     71.36      -0.72%          6.95%     0.12%
                                                                                                      slotted at Outperform due to high margin risk, high inflation environment and          Vanguard Consumer Stap.      VDC                 6bn     185.21      -0.56%          7.57%     0.10%

-10%
                                                                                                      global supply chain problems.                                                          Fidelity Consumer Stap.      FSTA                1bn      42.99      -1.22%          6.83%     0.08%
              Feb 2021   Mar 2021   Apr 2021   May 2021   Jun 2021   Jul 2021   Aug 2021   Sep 2021                                                                                          Ishares Consumer Stap.       KXI                 1bn      61.55      -0.92%          5.99%     0.46%
 Consumer Staples           S&P 500                                                                                                                                                          First Trust Consumer Stap.   FXG                 0bn      57.03       0.16%         10.86%     0.63%

                                                                                                      1.66                     0.00%             10.90                 24.20
                                        Real Estate                                                   Market Cap (Trillions)   Weekly Change     P/E                   EV/EBITDA
                                                                                                                                                                                             STOCKS TO WATCH               TICKER MARKET CAP CLOSE
                                                                                                                                                                                                                                   
                                                                                                                                                                                                                                                                CHANGE P/E              EV/EBITDA

                                                                                                                                                                                             American Tower Corp           AMT              134bn      293.75     -0.29%     53.40           28.01
Sector Comparison to S&P 500 Performance                                                              • Homebuilders D R Horton (DHI), MDC Holdings (MDC) , Meritage Homes (MTH)             Dr Horton Inc                 DHI               33bn       90.80      2.02%         6.99         5.60
40%
                                                                                                      still look like relative bargains according to Barron’s saying when it comes to        Zillow Group Inc - A          ZG                24bn       96.14      1.57%     73.90           33.78
                                                                                                      builders book value may no longer be the only metric to look at.                       Meritage Homes Corp           MTH                4bn      105.60      1.05%         4.83         3.89

20%
                                                                                                      • Wells Fargo said its Proprietary August Real Estate Agents’ Survey indicated a       Mdc Holdings Inc              MDC                4bn       51.55      2.16%         5.37         4.60
                                                                                                      moderation in housing momentum and believe Q3 numbers will need to be                  ETFs TO WATCH                TICKER TOTAL ASSETS CLOSE            CHANGE      YTD           Expense
                                                                                                                                                                                                                                   
                                                                                                      trimmed.                                                                               Vanguard Real Estate         VNQ                44bn    106.40       0.00%      29.49%         0.12%
0%                                                                                                    • Zillow (ZG) Target price cut from $184 to $145 at BTIG but maintain Buy noting it    iShares U.S. Real Estate     IYR                 8bn    106.79      -0.24%      29.07%         0.42%
                                                                                                      has been among the worst performers in coverage universe YTD.                          Schwab US REIT               SCHH                6bn     47.76      -0.04%      30.10%         0.07%
              Feb 2021   Mar 2021   Apr 2021   May 2021   Jun 2021   Jul 2021   Aug 2021   Sep 2021                                                                                          Real Estate Select SPDR      XLRE                4bn     46.85       0.00%      32.42%         0.12%
 Real Estate       S&P 500                                                                                                                                                                   iShares REIT ETF             REZ                 1bn     88.13      -1.50%      34.88%         0.48%
                                                                                                                                                                                                                                                                                                    /
Sector Snapshot
                                            Energy                                                  1.43
                                                                                                    Market Cap (Trillions)
                                                                                                                             3.20%
                                                                                                                             Weekly Change
                                                                                                                                             14.70
                                                                                                                                             P/E
                                                                                                                                                                  7.60
                                                                                                                                                                  EV/EBITDA
                                                                                                                                                                                          STOCKS TO WATCH                 TICKER MARKET CAP CLOSE
                                                                                                                                                                                                                                   
                                                                                                                                                                                                                                                          CHANGE        P/E          EV/EBITDA

                                                                                                                                                                                          Conocophillips                  COP            79bn    58.92         2.31%      11.83            4.74
Sector Comparison to S&P 500 Performance
                                                                                                    • Diamondback Energy (FANG) announced 2 million USD share buyback program.            Canadian Natural Resources      CNQ            40bn    33.34        -3.89%          8.37         4.70
                                                                                                                                                                                          Occidental Petroleum Corp       OXY            25bn    26.94         1.09%      22.56            5.56
                                                                                                    Along with the boost from high oil prices, announcement caused share price to
40%                                                                                                                                                                                       Cheniere Energy Inc             LNG            22bn    86.93        -4.29%      12.56           10.18
                                                                                                    increase by 6% for the week
                                                                                                                                                                                          Diamondback Energy Inc          FANG           15bn    82.62         6.20%          6.06         4.73
                                                                                                    • According to JP Morgan, American Integrated oil companies are undervalued and
                                                                                                    they will start distributing cash to shareholders in 2022. Bank is overweight on      ETFs TO WATCH                   TICKER TOTAL ASSETS CLOSE
                                                                                                                                                                                                                                   
                                                                                                                                                                                                                                                          CHANGE         YTD           Expense
20%
                                                                                                    CNQ, CVE, RDS and XOM                                                                 Energy Select SPDR              XLE             23bn    49.32         3.20%     29.93%         0.12%
                                                                                                    • Wells Fargo upgraded Cheniere Energy (LNG) from buy to overweight and               Vanguard Energy                 VDE              5bn    69.64         3.31%     33.59%         0.10%
                                                                                                    increased price target from 95$ to 112$                                               SPDR Oil & Gas Exploration      XOP              3bn    87.95         5.12%     48.99%         0.35%
0%
           Feb 2021   Mar 2021   Apr 2021    May 2021   Jun 2021   Jul 2021   Aug 2021   Sep 2021                                                                                         iShares U.S. Energy             IYE              2bn    26.81         3.19%     32.13%         0.42%
 Energy      S&P 500                                                                                                                                                                      iShares Global Energy           IXC              1bn    25.07         2.66%     22.95%         0.46%

                                                                                                    1.14                     -3.19%          19.70                12.20
                                       Materials                                                    Market Cap (Trillions)   Weekly Change   P/E                  EV/EBITDA
                                                                                                                                                                                          STOCKS TO WATCH                 TICKER   MARKET CAP CLOSE
                                                                                                                                                                                                                                   
                                                                                                                                                                                                                                                         CHANGE P/E              EV/EBITDA

                                                                                                                                                                                          Alcoa Corp                      AA              9bn    48.83       -0.79%       9.62             4.28
Sector Comparison to S&P 500 Performance
                                                                                                    • Shares of Tronox holdings (TROX), chemical product producer, surged after the       Cameco Corp                     CCJ             9bn    22.46       -8.18%    253.25             31.85

20%
                                                                                                    announcement that private equity firm Apollo plans to buy TROX ay 27 USD per          United States Steel Corp        X               6bn    23.36       -7.96%       3.31             2.94

                                                                                                    share. Share price increased by 20%                                                   Tronox Holdings Plc- A          TROX            4bn    24.52        7.50%       9.89             6.37
                                                                                                                                                                                          Denison Mines Corp              DNN             1bn     1.61       -1.23%
                                                                                                    • Shares of Uranium Producers (CCJ, DNN) had weak week, after MS announced
10%
                                                                                                    that their surge is not sustainable into next year                                    ETFs TO WATCH                   TICKER TOTAL ASSETS CLOSE       CHANGE        YTD            Expense
                                                                                                                                                                                                                                   
                                                                                                    • Price target of Alcoa Corporation (AA) was raised to 58 USD and upgraded from       VanEck Vectors Gold Miners      GDX             13bn    30.58        -2.92%     -20.59%        0.52%
0%                                                                                                  hold to buy by Argus securities.                                                      Materials Select Sector         XLB             8bn     81.33        -3.19%         13.43%     0.12%
                                                                                                                                                                                          Vanguard Materials              VAW             4bn    177.49        -3.15%         13.93%     0.10%
           Feb 2021   Mar 2021   Apr 2021    May 2021   Jun 2021   Jul 2021   Aug 2021   Sep 2021                                                                                         SPDR S&P Metals & Mining        XME             2bn     42.34        -5.28%         25.82%     0.35%
 Materials    S&P 500                                                                                                                                                                     Global X Silver Miners          SIL             1bn     37.46        -4.24%     -23.86%        0.65%

                                                                                                    1.13                     -2.99%          20.70                13.10
                                            Utilities                                               Market Cap (Trillions)   Weekly Change   P/E                  EV/EBITDA
                                                                                                                                                                                          STOCKS TO WATCH                 TICKER MARKET CAP CLOSE
                                                                                                                                                                                                                                   
                                                                                                                                                                                                                                                             CHANGE P/E              EV/EBITDA

                                                                                                                                                                                          Exelon Corp                     EXC            49bn      49.86       -1.38%     15.31            9.47
Sector Comparison to S&P 500 Performance                                                            • Exelon Corporation (EXC) was upgraded from neutral to buy by Mizuho securities.     Ameren Corporation              AEE            21bn      83.60       -2.89%     20.72           11.56
                                                                                                    Price target was raised from 47.50$ to 53$. Mizuho mentions that energy bill of       Fuelcell Energy Inc             FCEL            2bn         6.55     16.55%
20%
                                                                                                    Illinois shall provide 140 million in subsidy                                         Jinkosolar Holding Co-Adr       JKS             2bn      48.08       -0.25%     11.81           12.04
                                                                                                    • JinkoSolar Holding Company (JKS) price target was cut from 58 to 51 by Roth         Ftc Solar Inc                   FTCI            1bn         9.30     -6.25%     24.28           19.00
10%                                                                                                 Capital. Price Cut was initiated after company reported bigger than expected loss     ETFs TO WATCH                   TICKER TOTAL ASSETS CLOSE          CHANGE YTD               Expense
                                                                                                                                                                                                                                   
                                                                                                    and reduced forward guidance in terms of revenue                                      Utilities Select Sector         XLU             13bn    66.40       -2.99%          8.64%      0.12%
                                                                                                    • Fuelcell Energy (FCEL) reported greater than expected EPS (-0.04 vs -0.05), which   Vanguard Utilities              VPU              5bn   144.62       -2.89%          7.97%      0.10%
0%
                                                                                                    was supported by higher gross margin. Stock price increased by 14.5% after the        Global X US Infrastructure Dev PAVE              4bn    25.97       -2.18%      24.20%         0.47%
           Feb 2021   Mar 2021   Apr 2021    May 2021   Jun 2021   Jul 2021   Aug 2021   Sep 2021   announcement.                                                                         iShares Global Infrastructure   IGF              3bn    45.90       -1.18%          5.78%      0.46%
 S&P 500      Utilities
                                                                                                                                                                                                                                                                                                 /
Week Ahead
                      Monday                                                                  Tuesday                                                              Wednesday                                                           Thursday                                                                    Friday
            Today   September 2021   Month   Week       Day    List               Today   September 2021   Month     Week    Day    List     Economic
                                                                                                                                                     Today September 2021Calendar
                                                                                                                                                                          Month Week Day                  List               Today   September 2021   Month     Week    Day      List                Today   September 2021    Month      Week   Day    List

September 20, 2021                                         Monday       September 21, 2021                                        Tuesday      September 22, 2021                                   Wednesday     September 23, 2021                                      Thursday         September 24, 2021                                            Friday

10:00am - 11:00am       Germany DE:PPI                                  5:30am - 6:30am          AU:RBA Meeting Minutes                        3:00pm - 4:00pm       US:MBA Mortgage Applications                 9:00am - 10:00am        SG:CPI                                           12:30am - 1:30am        US:Fed Balance Sheet

12:30pm - 1:30pm        Hong Kong HK:CPI                                8:30am - 9:30am          US:FOMC Meeting Begins                        6:00pm - 7:00pm       EZ:EC Consumer Confidence Flash              10:45am - 11:45am       FR:Business Climate Indicator                    2:45am - 3:45am         NZ:Merchandise Trade

6:00pm - 7:00pm         USA US:Housing Market Index                     10:00am - 11:00am        CH:Merchandise Trade                          6:00pm - 7:00pm       US:Existing Home Sales                       11:15am - 12:15pm       FR:PMI Composite Flash                           3:30am - 4:30am         JP:CPI

7:30pm - 8:30pm         USA US:3-Month Bill Auction                     10:00am - 11:00am        UK:Public Sector Finances                     6:30pm - 7:30pm       US:EIA Petroleum Status Report               11:30am - 12:30pm       CH:SNB Monetary Policy Assessment                4:30am - 5:30am         JP:PMI Composite Flash

7:30pm - 8:30pm         USA US:6-Month Bill Auction                     2:00pm - 3:00pm          UK:CBI Industrial Trends                      7:30pm - 8:30pm       US:2-Yr FRN Note Auction                     11:30am - 12:30pm       DE:PMI Composite Flash                           9:00am - 10:00am        SG:Industrial Production

                                                                        4:30pm - 5:30pm          US:Current Account                            10:00pm - 11:00pm     US:FOMC Announcement                         12:00pm - 1:00pm        EZ:PMI Composite Flash                           12:00pm - 1:00pm        DE:Ifo Survey

                                                                        4:30pm - 5:30pm          US:Housing Starts and Permits                                                                                    12:30pm - 1:30pm        UK:PMI Composite Flash                           12:00pm - 1:00pm        IT:Business and Consumer Confidence

                                                                        4:55pm - 5:55pm          US:Redbook                                                                                                       3:00pm - 4:00pm         UK:BoE Announcement & Minutes                    2:00pm - 3:00pm         UK:CBI Distributive Trades

                                                                        7:00pm - 8:00pm          US:4-Week Bill Announcement                                                                                      4:30pm - 5:30pm         CA:Retail Sales                                  6:00pm - 7:00pm         US:Jerome Powell Speaks

                                                                        7:00pm - 8:00pm          US:8-Week Bill Announcement                                                                                      4:30pm - 5:30pm         US:Chicago Fed National Activity Index           6:00pm - 7:00pm         US:New Home Sales

                                                                        9:00pm - 10:00pm         US:20-Yr Bond Auction                                                                                            4:30pm - 5:30pm         US:Jobless Claims                                9:00pm - 10:00pm        US:Baker Hughes Rig Count

                                                                                                                                                                                                                  5:45pm - 6:45pm         US:PMI Composite Flash

                                                                                                                                                                                                                  6:00pm - 7:00pm         US:Leading Indicators

                                                                                                                                                                                                                  6:30pm - 7:30pm         US:EIA Natural Gas Report

                                                                                                                                               Corporate Actions Calendar
Ticker Type                     Time                  Maket Cap         Ticker Type                     Time                 Maket Cap         Ticker Type                 Time                 Maket Cap        Ticker Type                       Time               Maket Cap           Ticker Type                       Time            Maket Cap
                                                                                                                                                                                                                                                                                                                                        

LEN    Earnings                 After-Hours                     31bn    ADBE Earnings                   After-Hours               317bn        SOVO IPO                    NASDAQ                        0bn     NKE     Earnings                  After-Hours               249bn        KDC     IPO                       NYSE                           1bn
CGNT Earnings                   Pre-Market                      2bn     FDX    Earnings                 After-Hours                69bn        GOTU Earnings               Pre-Market                    1bn     ACN     Earnings                  Pre-Market                217bn        CWAN IPO                          NYSE                           1bn
FRSH IPO                        NASDAQ                          1bn     AZO    Earnings                 Pre-Market                 35bn        TOST IPO                    NYSE                          1bn     COST Earnings                     After-Hours               205bn        HLTH    IPO                       NASDAQ                         0bn
THRN IPO                        NASDAQ                          0bn     SFIX   Earnings                 After-Hours                    4bn     SCS    Earnings             After-Hours                   2bn     DRI     Earnings                  Pre-Market                   20bn
                                                                        CBRL Earnings                   Pre-Market                     3bn     FUL    Earnings             After-Hours                   3bn     TCOM Earnings                     After-Hours                  18bn
                                                                        INNV Earnings                   After-Hours                    2bn     KBH    Earnings             After-Hours                   4bn     MTN     Earnings                  After-Hours                  12bn
                                                                        ESMT IPO                        NYSE                           0bn     BB     Earnings             After-Hours                   6bn     DAVA Earnings                     Pre-Market                      8bn
                                                                        STER   IPO                      NASDAQ                         0bn     JEF    Earnings             Not-Supplied                  9bn     BRLT    IPO                       NASDAQ                          0bn
                                                                                                                                               GIS    Earnings             Pre-Market                   36bn

                                                                                                                                                                                                                                                                                                                                                                  /
Legal Notice
· This publication (the “Publication”) has been prepared and distributed by TBC Capital LLC (“TBC Capital”) member of TBC Bank Group PLC (“Group”) for informational purposes only and independently of the respective companies mentioned
herein.

· TBC Capital is operating and performing its professional services on the territory of Georgia and is duly authorized to prepare and distribute this Publication on the territory of Georgia.
· Nothing in this Publication shall constitute an offer or invitation to treat to solicit buying or selling or subscribing any assets and/or securities and nothing herein shall form the basis of any contract or commitment whatsoever or shall be
considered as a recommendation to take any such actions.

· Since distribution of this Publication may be restricted by law in certain jurisdictions, persons into whose possession this Publication comes are required by TBC Capital to inform themselves about and to observe any and all restrictions
applicable to them.

· As this Publication is not directed to or intended for distribution, directly or indirectly, to or use by any person or entity in any jurisdiction where such distribution, publication, availability or use would be contrary to the applicable law or which
would require any registration or licensing within such jurisdiction, neither TBC Capital nor any member of the Group nor any of their respective director(s), partner(s), employee(s), affiliates, adviser(s) or agent(s) (“Representatives”) accept any
direct or indirect liability to any person in relation to the publication, distribution or possession of this Publication in or from any jurisdiction.

· This Publication is not intended to provide any investment, business, tax and/or legal advice, and credit or any other evaluation. Recipients of this Publication are strongly required to make their own independent investigation and detailed
appraisal of the matters discussed herein. Any investment decision should be made at the investor's sole discretion and consideration. Any and all information contained in this Publication is subject to change without notice, and neither TBC
Capital nor any member of the Group nor any of their Representatives are under any obligation to update or keep information contained in this Publication.

· Distribution of this Publication, at any time, does not imply that information herein is correct, accurate and/or complete as of any time after its preparation date or that there has been no change in business, financial condition, prospects,
credit worthiness, status or affairs of the respective companies or anyone else since that date. Accordingly, this Publication should not be considered as a complete description of the markets, industries and/or companies referred to herein and
no reliance should be placed on it. TBC Capital does not undertake to update this Publication or to correct any inaccuracies therein which may become apparent.

· The Publication may include forward-looking statements, but not limited to, statements as to future operating results. Any “forward-looking statements”, which include all statements other than statements of historical facts, involve known
and unknown risks, uncertainties and other important factors beyond TBC Capital’s control that could cause the actual results, performance or achievements to be materially different from future results, performance or achievements expressed
or implied by such forward-looking statements. Such forward-looking statements are based on numerous assumptions regarding present and future business strategies and the environment operating in the future. By their nature, forward-
looking statements involve risks and uncertainties because they relate to events and depend on circumstances that may or may not occur in the future. No assurances can be given that the forward-looking statements in this document will be
realized. TBC Capital does not intend to update such forward-looking statements.

· Opinions, forecasts, estimates and/or statements relating to expectations regarding future events or the possible future performance of investments represent TBC Capital’s own assessment and interpretation of information available to it
currently from third party sources. Information obtained from the third party sources believed to be reliable, but that there is no guarantee of the accuracy and/or completeness of such information.

· TBC Capital does and seeks to do and any member of the Group may or seek to do business with companies covered in this Publication. Thus, investors should be aware that TBC Capital may have a potential conflict of interest that could affect
the objectivity of the information contained in this Publication.

· This Publication may not be reproduced, redistributed or published, in whole or in part, in any form for any purpose, without the written permission of TBC Capital, and neither TBC Capital nor any member of the Group nor any of their
Representatives accept any liability whatsoever for the actions of third parties in this respect.

· TBC Capital makes no expressed or implied representation or warranty of usefulness in predicting the future performance or in estimating the current or future value of any security or asset, and expressly disclaims all warranties of
merchantability or fitness for a particular purpose or use with respect to any data included in this Publication.

· Without limiting any of the foregoing and to the extent permitted by law, TBC Capital or any member of the Group or any of their Representatives expressly disclaim all liability whatsoever (in negligence or otherwise) for any loss or damages
however arising, directly or indirectly, from any use of this Publication or its contents (including without limitation to the accuracy and/or completeness of information therein) or otherwise arising in connection with this Publication or for any
act or failure to act by any party on the basis of this Publication.

                                                                                                                                                                                                                                                              /
Sources
Source Name                     Web Address

Bloomberg, Bloomberg Terminal   https://www.bloomberg.com/
CNBC                            https://www.cnbc.com/world/?region=world
Fidelity                        https://www.fidelity.com/
Real Investment Advisors        https://realinvestmentadvice.com/
Reuters                         https://www.reuters.com/
Seeking Alpha                   https://seekingalpha.com/
Zero Hedge                      https://www.zerohedge.com/

                                                                           /
Brokerage Team
Mary Chachanidze, CFA
Tornike Mchedlishvili, CFA
Nina Sandler
Tatia Dzaptashvili
Rati Kalandarishvili
Sandro Tchanturidze

                             /
You can also read