Wabash CarbonSAFE - Project Title
←
→
Page content transcription
If your browser does not render page correctly, please read the page content below
Wabash CarbonSAFE
                              DE-FE0031626

                      Chris Korose
                    Steve Whittaker
University of Illinois – Illinois State Geological Survey

                             U.S. Department of Energy
                       National Energy Technology Laboratory
        2021 Carbon Management and Oil and Gas Research Project Review Meeting
                                    August 2021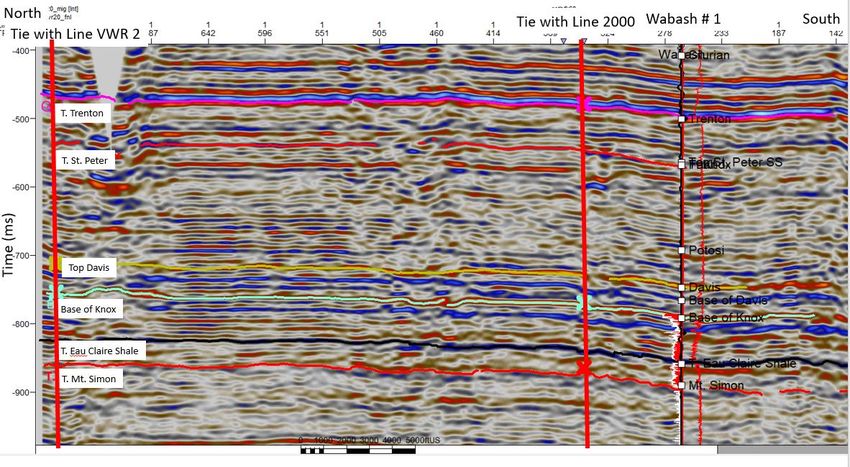
Presentation Outline
Technical Status, Project Background

Accomplishments to Date
    – Review
    – Recent work
       • Characterization
       • Modeling
       • Other Assessments and Reporting

Summary: Key Findings, Challenges
Next Steps

                                           2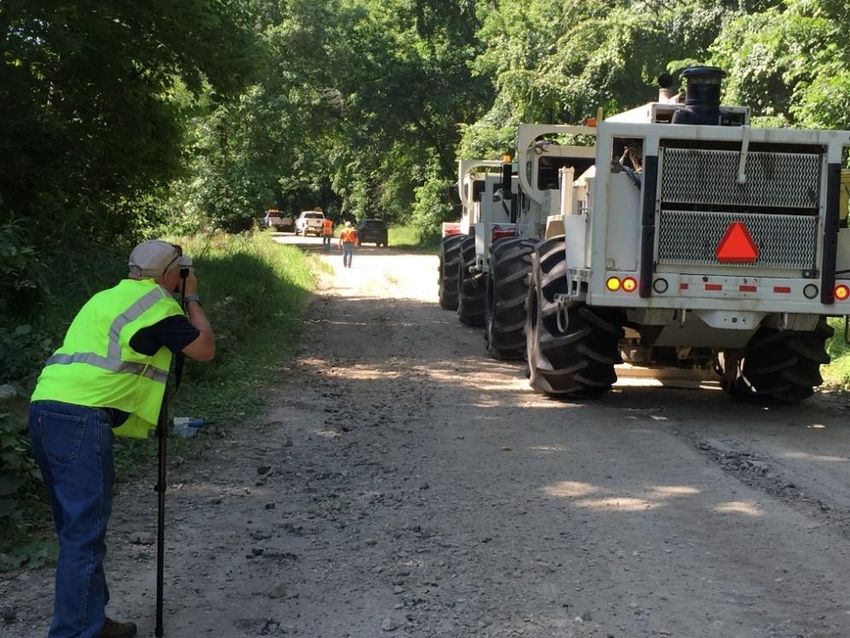
Technical Status
                                      Project Background

Phase II: Assess the feasibility of developing a commercial-scale
geological storage complex at Wabash Valley Resources (WVR)
gasification facility near Terre Haute IN, that could store up to 50
million tonnes of industrially-sourced CO2. (2/1/2019 – 3/31/2022)

   Task 1.0 – Project Management and Planning
   Task 2.0 – Risk Assessment and Monitoring
   Task 3.0 – National Risk Assessment Partnership (NRAP) Screening
   Task 4.0 – Stakeholder Engagement and Public Outreach
   Task 5.0 – Business and Economic Development Assessment
   Task 6.0 – Permitting and Compliance
   Task 7.0 – Subsurface Characterization
   Task 8.0 – Drilling and Well Testing
   Task 9.0 – Storage Complex Modeling
   Task 10.0 – Infrastructure Development
   Task 11.0 – Storage Complex Development Planning

                                                                       33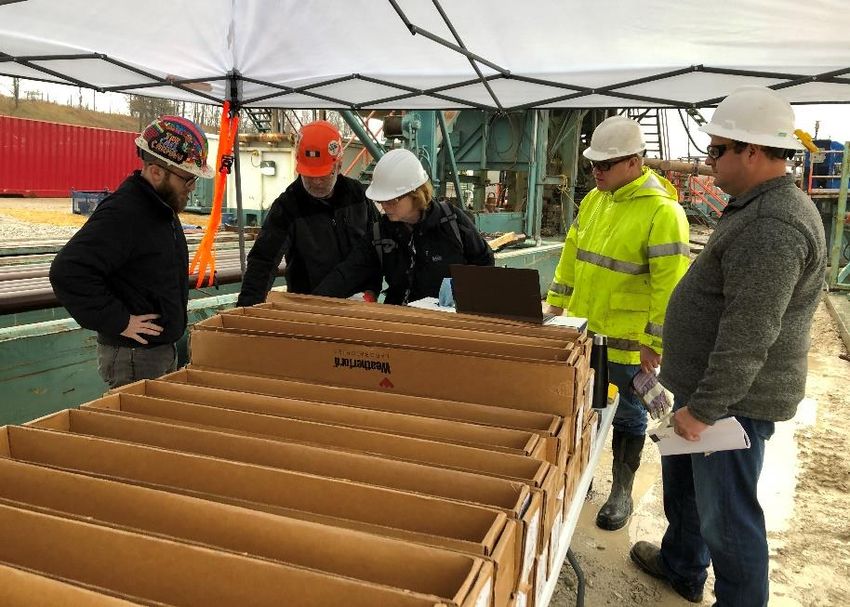
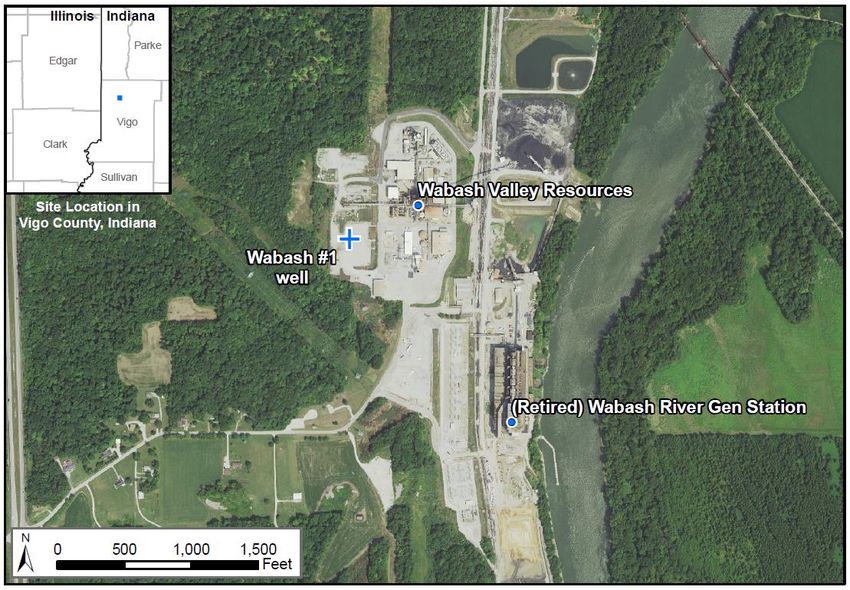
Project Background
                •   Site at Former WRGS: IGCC Unit 1A (DOE 1995-1999);
                    Commercial operations 1999-2016.
                •   Modification planned to produce net-zero carbon
Wabash Valley       intensity hydrogen production for power generation,
 Resources          transportation fuels, chemical markets
                •   1.65 million tons; 99% pure CO2
                •   Target 2024 commercial operations

                                                                    4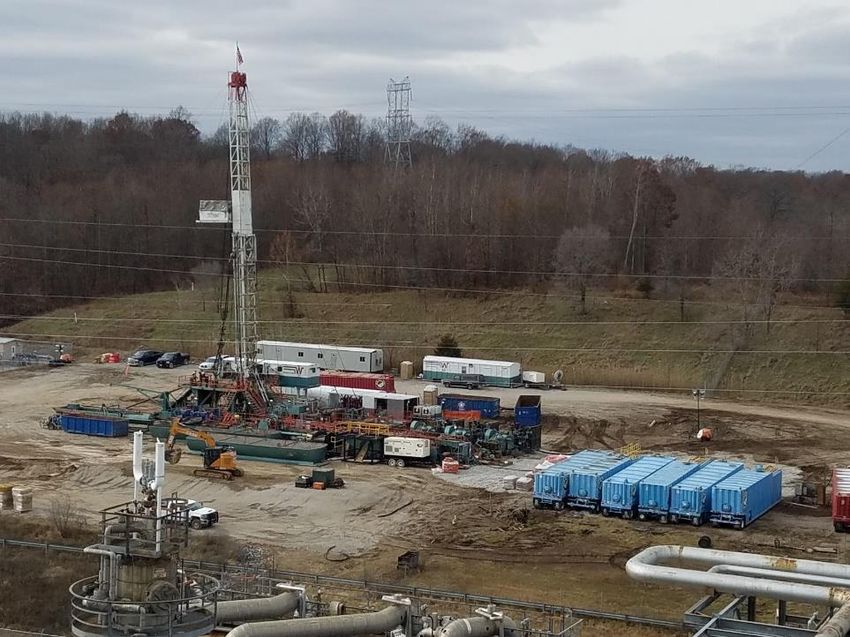
Project Background
Mt. Simon Sandstone – target reservoir
Potosi Dolomite – secondary reservoir

                                         Few deep wells in ILB through Mt. Simon

                                         •   Data collection necessary, characterization
                                         •   Fill data gaps, expand storage resource

                                                                                           5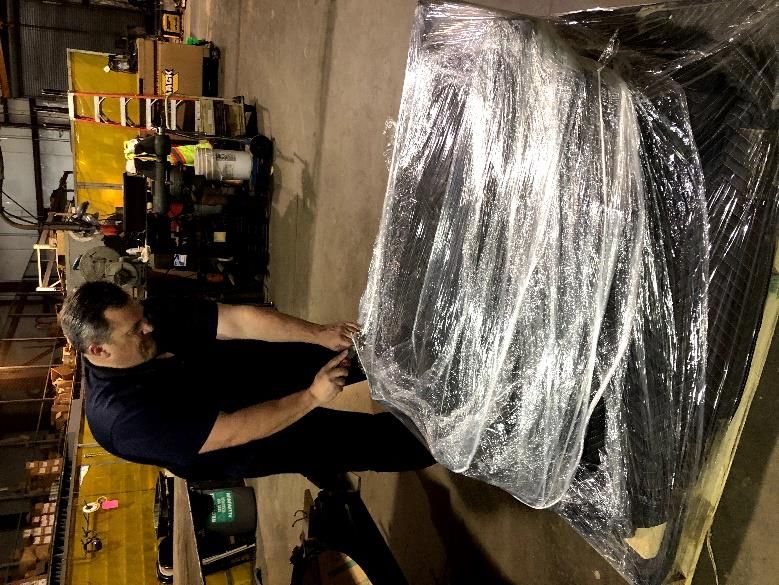
Accomplishments
                          Review
                                 to Date
•   2 x 10 miles 2D seismic acquisition summer 2019
•   Wabash #1 TD 8,739 ft 02/07/2020; Plugged 7/31/2020
•   Difficult drilling; did not reach crystalline basement
•   Cored 245 ft (target reservoir + 2 seals) + RSWC
•   Full suite of geophysical logs; limited in Potosi Dol.
•   Two DSTs + Mt.Simon modeling prior to cased-hole well testing…

                                       Photo: R. Chambers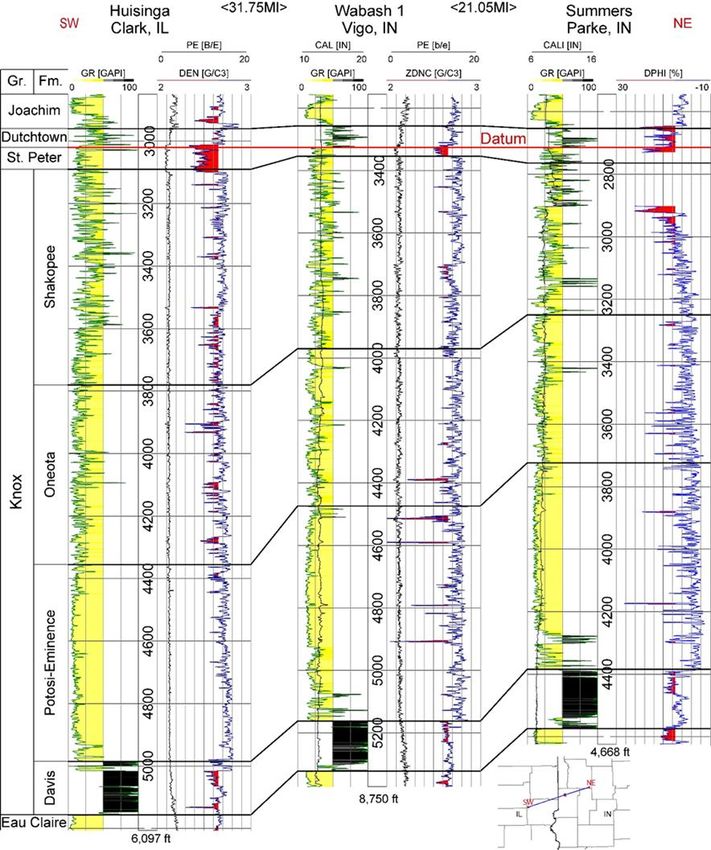
Accomplishments
Review
to Date
Eau
Pressure Fall-Off and Step Rate Testing: Claire
Core
• Potosi Dolomite (Knox Gp.)
Vuggy porosity in several zones Upper
Mt.Simon
Test interval 4,505-4,525 ft MD
DST
24,000 md-ft over 10ft; 2,400 md*
Middle
Mt.Simon
• Mt. Simon:
7,192-7,202 ft
53 md-ft over 10ft; 5.3 md Lower
Mt.Simon
7,976-7,996 ft
84 md-ft over 20 ft; 4.2 md DST
Core
• Sandstone below basalt:
8,661-8,671; 8,681-8,691*
66 md-ft over 20 ft; 3.3 md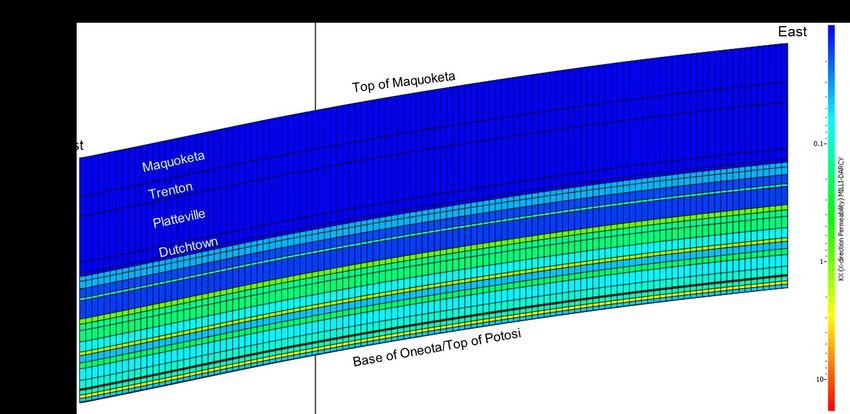
Potosi Dolomite          (Knox
                Previous/Regional Knowledge
                                            Group)

•   Thick bedded, fine to coarsely crystalline dolomite unit
•   Chert and partially/completely mineralized cavities
    common
•   Vugular, brecciated, fractured and/or cavernous intervals

                                                                Vuggy porosity with the cavities lined with drusy quartz in the
                                                                  Potosi Dolomite; ADM Verification Well #1, Macon Co. IL.

•   Regionally extensive, several zones with high porosity &
    permeability
•   Trace in logs: Knox-St.Peter Project, IBDP, CarbonSAFE
•   Lost circulation zone throughout Basin: IBDP (and Wabash)
•   No Potosi core in Wabash #1, limited logs (e.g. no FMI)

                                                                                                                      8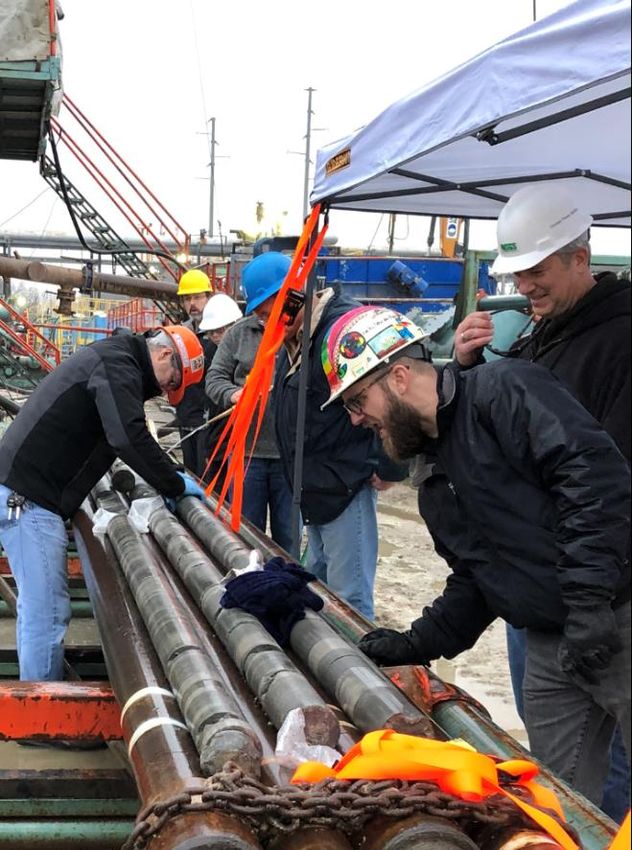
Potosi      Dolomite
                                                    Previous/Regional Knowledge

   Tuscola, IL chemical waste disposal wells (~50mi WNW):

   •    From an injectivity/ falloff test, the estimates of Potosi
        permeabilities were greater than 9,000 md
   •    Since 1970, injected 18 billion Gal of liquid into the
        Potosi through Cabot-Tuscola #2 well
   •    Equivalent to injecting more than 50 million metric
        tons of CO2
   •    Still injecting equivalent to 60,000 tonnes per month
        of CO2

Southwest-northeast correlation of the units in the Knox Group from east-central Illinois
    to west-central Indiana (Datum top of the St. Peter Sandstone). Note: The available       9
      Cabot #2 well log is incomplete for the Potosi Dolomite, but the approximate well
                           location in Tuscola, IL is shown in the index map as a red star.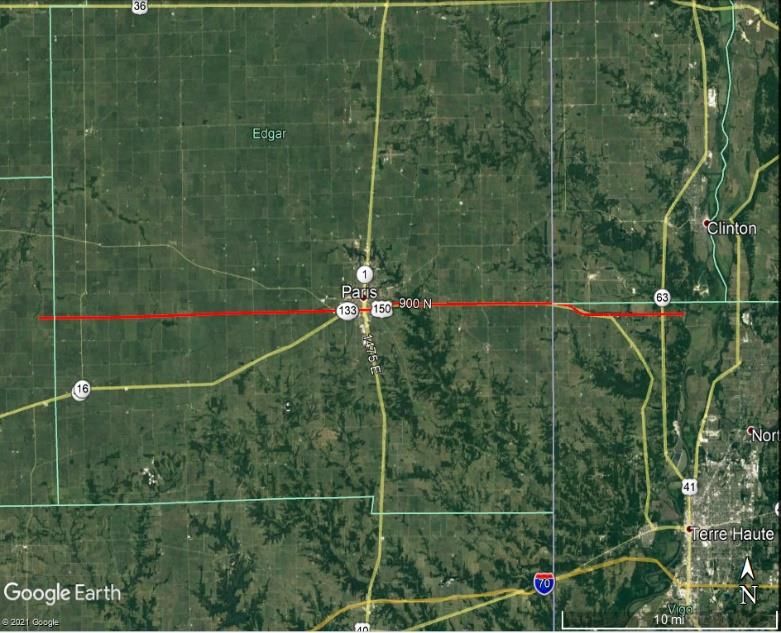
Potosi       Dolomite
                                   Wabash #1: Petrophysical Analysis

Potosi Dolomite in the Wabash #1 well:
• Six porous & permeable intervals in the Potosi
• Range from less than 5 ft to ~20 ft in thickness
• Neutron-density porosity in the 20-ft test
   interval is estimated to be over 30%

Potential Potosi reservoir zone:
• 784 ft thick at 4,378 ft MD
• Total of 149.5 ft is greater than 10% porosity.

                    Geophysical log of the Potosi Dolomite in,
              Wabash #1 Well, Vigo County, Indiana. The green
                   highlighted areas on the right-most porosity
              column are zones with greater than 10% porosity.
Maquoketa Group
Wabash #1: Core Studies
Maquoketa Group in the Wabash #1 well (regional seal):
• Dominantly interbedded shale + argillaceous layers in upper zone
• Increasing limestone and argillaceous limestone in middle to lower
• 314 ft thick at 2,386 ft MD in Wabash #1
• Core 2,435-2495 ft: fairly consistent, thinly-laminated calcareous shale lithology
Sealing capacity/integrity to CO2:
MICP data:
• Formation pressure: 1,080 psi; assume a CA range between 20o and 40o
• Data indicate the Maquoketa can hold a scCO 2 column height of 2,020 ft
Geological characterization and geomechanical testing:
• FMI log + core show little to no natural fractures within the Maquoketa Group interval
• Triaxial test results, Maquoketa:
• has high Young's modulus (suggesting very stiff rock and not easily deformable)
• has high cohesive and uniaxial compressive strength
(suggesting it will require very high injection pressures [above the fracture
gradient of the reservoir] to induce a failure in the formation)
Photo: R. Bauer
The test results indicate the Maquoketa is an effective Petrophysical
Static elastic properties
caprock to scCO2 migration and exhibits geomechanical properties
characteristics of a good seal. Seal ρ (g/cc) υ UCS (MPa) C0 (Mpa) 11φ (°)
Maquoketa 2.61-2.71 0.23-0.3 180 51.8 30Static Model Development
3-D structural framework
Potosi Static model: 22 x 22 mi, 241 layers
7 confining units above Potosi and below Maquoketa:
• Dense carbonates with interbedded shales
• 1,678 ft cumulative thickness between Potosi and Maquoketa
St.
Peter
Data from: Well test data, geophysical well logs,
and calculations (Lucia 1995; 2007) that link
rock fabrics to petrophysical properties.
Partial geophysical log, Wabash #1 Well, Vigo County, Indiana.Dynamic Modeling
Nexus Simulation model:
• 22 x 22 miles; based on geologic model
• Constant property within layers
(vertical heterogeneity)
• Potosi contains vuggy intervals with
high perm.
Model Size, Grid Cells:
• 1000’ x 1000’ / 333’ x 333’ local refinement Zscale: 20x
• 241 layers
Wabash East
• 217 within the Potosi (~3 ft thick)
• 23 in confining units; 1 below Interval: 4,389’ – 4,394’ MD
• Total blocks: 7.6 million; infinite acting aquifer 2 Layers
K = 2,000 mD
boundary
Parameter Value West
Initial Pressure 1,954 psia at 4,500' MD
Resevoir Temperature 108F at 4,500' MD
Max K = 2,400 mD
Salinity 34,250 ppm
Frac Gradient 0.71 psi/ft Interval: 4,509’ – 4,519’ MD
(within tested interval: 4,505’ – 4,525 MD)
Zscale: 35x 4 Layers; K = 2,400 mDDynamic Modeling
Wabash #1 Example
30 years
Wabash #1
3,796 ft
30-year injection period 3,733 ft
3,771 ft
3,834 ft
• Entire Potosi perforated 3,953 ft
• CO2 injection rate of 1.67 Mta
• 50 mil. tonnes CO2 injected 4,037 ft
• Injection constraint
Pmax = 0.9 * 0.71 psi/ft Potosi
Applied at top of perf interval
Layer 67 (Potosi, top of tested interval) S-N cross-section through well
Cells with Sg ≥ 1%
Zscale = 20x
50-year post-injection period
Max plume radius: 3.8 miles
80 years Wabash #1
3,796 ft
3,834 ft
Plume does not move in the 3,733 ft
3,771 ft
lateral direction, after injection 3,953 ft
stops
• Plume moves vertically and 4,037 ft
saturation changes with time
• Vertical migration into Oneota Potosi
Dolomite
• > 1,270 ft below base of
Maquoketa seal Layer 67 (Potosi, top of tested interval)
S-N cross-section through well
Cells with Sg ≥ 1%
Zscale = 20x
Plume Radius vs. TimeDynamic Modeling
Well pressures
Bottom-hole Pressure (psia)
2300
2250
2200
• 30-year injection period (1.67 Mta)
Bottom-hole Pressure (psia)
2150
• 50-year post-injection period 2100
2050
• Maximum BHP constraint: 2000
2,804 psia at 3,829 ft, ss 1950
1900
• BHP increases by 282 psi at 30 years 1850
• Well BHP (2,182 psia) is significantly below 1800
0 10 20 30 40 50 60 70 80
maximum BHP constraint Years
ΔP = P(t) – P(t=0), psi
Wabash #1
Injection never reaches Delta-P at 30 years injection
pressures high enough to
fracture reservoir
Pressure change reaches
Dutchtown Limestone
Zscale:Zscale
12x = 12x
Change in pressure (P - Pinitial) at 30 years along a South to North cross-section
through the center of the model, for the 30-year injection case.Geological Characterization
Seismic Interpretation
Three-dimensional view of the Precambrian
through the Eau Claire formation.
• Some faulting in the Precambrian
and lower Mt. Simon Sandstone
• Faults do not appear to be present in
upper Mt. Simon and Eau Claire Fm.
• No faulting observed through
Potosi-Maquoketa interval
Line 1000 (N-S) showing correlation of the Wabash #1
with the seismic reflection data.Geological Characterization
Sedimentology of Argenta / Mt. Simon Sandstone
Wabash #1 Mt. Simon core, CT scans,
thin sections, high-resolution FMI log
• Detailed descriptions
• Lithostratigraphic columns
• Depositional sequences & correlation
Tectono-stratigraphic correlation between Wabash #1, IBDP VW #1 and 2,
TR. McMillen #1 and FutureGen #1 boreholes.
17
Lithostratigraphic column, FMI log and interpretations.Geological Characterization
Sedimentology of Argenta / Mt. Simon Sandstone
• The basalt penetrated in the Wabash #1 well (8,515-8,535 ft) is
interpreted as a flood overlying lacustrine deposits
• Early Cambrian in age
• Sediments below basalt: DZ proximal source, more like lower Mt. Simon
• 8,690 ft: best reservoir properties from sandstone samples
• Potential reservoir rocks below well TD 8,739 ft (?)
Fullbore formation micro-imager log photos
showing the top contact of the basalt with the Mt.
Simon or Argenta sandstone at 8,515 ft and the
basal contact with sediments at 8,535 ft.
Rotary sidewall core plug from 8690 ft MD Thin Section. 8690 ft MDCurrent Status
Project Milestones
Task Milestone Planned Completion Verification Method
ID Completion
1.0/1.1 A Project Kickoff Meeting 04/01/19 03/21/19 Attend Meeting, Presentation File
1.0/1.2 B Revised Project Management Plan 03/29/19 03/27/19 File provided to DOE
1.0/1.4 C Finalized Communication Plan 06/02/19 03/27/19 File provided to DOE
2.0/2.1 D Risk Assessment Summary 2/28/22 Summary in quarterly reports
3.0/3.1 E NRAP Assessment Report 9/30/21 File provided to DOE
5.0/5.1 F Business Environment Study 9/30/21 File provided to DOE
6.0/6.2 G Obtain Stratigraphic Well Drilling Permit 10/31/19 11/12/19 Summary in quarterly reports
7.0/7.1 H Pre-Drilling Site Assessment 07/31/19 11/27/19 File provided to DOE
7.0/7.3 I Regional 2D Seismic Survey 10/31/19 08/21/19 Summary in quarterly reports
7.0/7.4 J Deliver Integrated Data for Modeling 12/31/21 Data provided
8.0/8.2 K Stratigraphic Test Well Completed 5/31/20 02/07/20 Summary in quarterly reports
9.0/9.4 L Report on Modeling 1/31/22 Summary in quarterly reports
10.0/10.1 M CO2 Source Assessment 11/30/21 File provided to DOE
11.0/11.1 N Detailed Characterization Plan 03/31/22 File provided to DOE
19Near/Completed work
NRAP Toolkit Assessment:
Modeling:
• STOMP reservoir simulation for Potosi Dolomite
Well Risk: NRAP-Open-IAM ROM:
• Consider hypothetical uncemented wells or damaged cemented wells
• Overall risk profile for well leakage is low. For cemented well (annulus):
- no significant brine leakage; negligible CO2 leakage to aquifers and atmosphere (0.035 Mt).
- impact plumes for pH and dissolved CO2 the radii do not exceed 0.3 mi from the leak source.
Subsurface Stress: SOSAT ROM:
• Tested new version–including better constraint of horizontal stress magnitude.
• Estimates a low risk of shear failure resulting from CO2 injection.
Business Environment Study: Wabash Valley Resources
• Utilizing 45Q allows for a realized economic value in pre-tax dollars
• State of Indiana support
IN Law 291 for pore space and pipeline access and acquisition
• Project funded by a combination of private equity investments and government loan guarantees
• Project appears to have commercial viability
20In Progress
In Progress work/reports:
• Well Drilling/Testing Report
• Geologic Data Catalog
• Geology: Potosi Dolomite, Mt. Simon SS
• Modeling Report
• UIC Permitting Plan
• Risk Analysis
• Source/Transport
Assess equipment/infrastructure needs, costs.
SimCCS: Simulate conceptual pipeline network:
– WVR (Potosi) – One Earth Energy (Mt. Simon)
– Add additional sources
Conceptual 83-mile pipeline between endmember
sources in Vigo County, IN and Ford County, IL
Synergy with CarbonSAFE - IL Storage Corridor (from ArcGIS)Project Summary
Key Findings
- Wabash #1 providing greater insight into regional distribution of the Mt. Simon Sandstone
- Potosi Dolomite appears to have excellent storage reservoir potential
- Containment:
• Maquoketa Group regional seal
• Multiple confining units between reservoir and seal
• No faulting or significant fracturing observed through Potosi-Maquoketa interval
- Modeling shows Potosi can accept required CO2 amount; no adverse pressure buildup
- Potosi-Maquoketa storage complex has economic potential
Challenges Remaining
- How to model Potosi, continuity of porous and permeable zones, monitoring
- Cambrian sandstone at Wabash #1 TD: potential reservoir below these; further research
22ProjectNextSummary
Steps
Wabash CarbonSAFE (through 3/31/2022):
- 30 mile 2D seismic (acquisition synergy with ISC)
• Further assess Potosi-Maquoketa storage complex
• Deep-seated geological structures
- Finalize analyses and complete reporting in progress
- Complete site characterization plan and final reporting
Final Data and Reports: EDX and MRCI Regional Initiative
End of CarbonSAFE: Phase II
WVR continuing as DOE Coal FIRST project (FE0031994):
Flexible fuel gasification-based carbon-negative power and carbon-free hydrogen co-production
• Completing Project FEED designs for carbon capture process and sequestration infrastructure
• Complete FEED designs for hydrogen power generation facilities and consider hydrogen offtake markets
• Integrate biomass feed stock and complete lifecycle analysis to potentially achieve a negative carbon
intensity of the hydrogen product
23Thank You! This project is funded by the U.S. Department of Energy through the National Energy Technology Laboratory 24 (NETL), under agreement DE-FE0031626.
Thank You!

             25
Appendix
– These slides will not be discussed during the presentation, but
are mandatory.
26Benefit to the Program
Benefits Statement, Wabash CarbonSAFE (02/01/2019)
This project will determine the feasibility of developing a commercial-scale CCS project capable
of storing over 50 million tonnes of anthropogenic CO2 in the U.S. Midwest. Wabash
CarbonSAFE will demonstrate the transfer of technology to apply CCS to ammonia production
thereby broadening the portfolio of industries that may benefit from integrating CCS into their
operations. The project will address the development gap in upscaling CCS to commercial-scale as
there are still are relatively few large carbon storage projects globally using deep saline reservoirs.
Our work will address improving storage capacity estimates to attain an industry standard of ±30%
or better for investment decisions. The data from this study will be used within the NRAP Toolkits
to move toward validating technologies to ensure storage permanence and to improve reservoir
storage efficiency. The project will determine the potential for transporting and utilizing CO 2 for
EOR in oil fields of the Illinois Basin. The knowledge gained will contribute to greater
development of regional CCS assets, best practice manuals about CCS technology, and issues that
will be of broad use to other sites and future commercialization efforts.
27Project Overview
Project Objectives and Program Goals
• Establish the feasibility of developing a commercial-scale geological
storage complex near Terre Haute IN, that could store up to 50
million tonnes of industrially-sourced CO2.
– Address gap in knowledge around developing large-scale geological storage
complexes
1) Validate technologies to ensure 99% storage
2) Validation of NRAP toolkits using field site data
3) Improve storage capacity estimations for industry investment decision
4) Contribute to best practice manuals to inform future commercialization efforts
• Address technical and non-technical questions around developing
commercial-scale storage complexes.
– Assess Public Outreach needs
– Analyze Regulatory Issues
– Characterize the Subsurface Storage Complex
– Construct Storage Complex Model
28
– Site Development PlanOrganization Chart
29Gantt Chart (Page 1 of 2)
30Gantt Chart (Page 2 of 2)
31You can also read