VOL V - WHITEPAPER | AUGUST 2020 - TRA Research
←
→
Page content transcription
If your browser does not render page correctly, please read the page content below
VOL V - WHITEPAPER | AUGUST 2020
BACKDROP
    The Coronavirus pandemic has taken the whole country by storm. For most of us,
    the Coronavirus impact has been arguably the most significant and most dramatic
    experience of our lives. It has disrupted lives and how. The impact on us as
    individuals, as society and as a workforce has been unprecedented to say the least.
    In a post-Covid world, people are living differently, working differently, thinking
    differently and even buying differently. Products and brands are being seen through
    a completely new lens.

    Diwali has traditionally been a period of
    consumption boom as consumers tend to
    increase spends, and brands scramble to catch
    their attention. This Diwali will be a deciding
    factor for many brands, as they prepare
    trepidatiously for the festive season. Many
    questions are awaiting the consumer mandate –
    Will the cautious consumer go out and shop this
    Diwali? Have consumer sentiments dampened or bolstered? Will malls see footfalls?
    Are high-ticket items like cars and property going to see a fillip?

    TRA Research, India’s leading consumer insights and brand analytics company,
    brings you TRA’s Diwali 2020 Buying Propensity Report, a whitepaper resulting
    from a consumer research conducted across 16 cities with 503 consumer-influencer
    respondents between 9th June and 15th July 2020. This whitepaper delves deeper to
    guage the changing buying mindsets and sentiments during the Indian Festive
    Season amid the Corona scare.

    BUYING PROPENSITY STEADIES TO ‘POSITIVE’ FOR DIWALI 2020

    TRA’s Buying Propensity IndexTM (BPI) is a measure of the ‘keenness to buy’ of
    India. Buying Propensity is a scientific tool that gets to the root of buying, an act
    that manifests on the
                                    Buying Sentiment for Diwali'20    Buying Propensity Index
    basis of two factors - an
    individual’s   need-based             POSITIVE SENTIMENTS                  65%

    buying and desire-based               NEUTRAL SENTIMENTS                   28%
    buying.                               NEGATIVE SENTIMENTS                   7%

    According to the survey, 65% consumers reflect a Positive Buying Sentiment
    Diwali 2020, while 28% feel it will remain the same as compared to June 2020. Only
    7% consumers feel the buying sentiment will worsen in Diwali than in the current
    period.
Brands may have some reason to cheer as the household expenditure recovery is
looking up. Spends fell by 12.3% from February to mid-June 2020. The upward
climb of the recovery till Diwali 2020 seems to regain at least half of that with a net
gain of 6.8%. June 2020 spends still down by 5.5% from February of the same year.
However, most consumers feel that the normal household spends will return only in
about 10 months, in May 2021.
This is good news of course, but the pre-Covid consumer spends were already lower
on account of a depressed and strained economy, and a comparison between the
consumer household spends between the two Diwalis of 2019 and 2020, show that
this year is likely to see 5.1% lesser spends than the previous one.
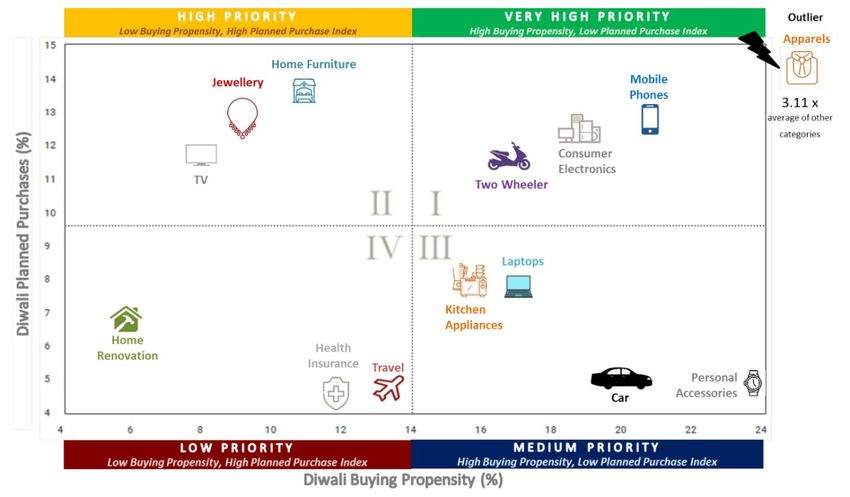
DIWALI BUYING PROPENSITY VERSUS PLANNED PURCHASES 2020
The festive season is not only celebratory, but also considered auspicious for many
Indians to make new purchases. Cars, houses, jewellery, clothes are traditionally on
the buying list. The graph above is a matrix of the consumers’ Buying Propensity or
‘keenness to buy’ on the x-axis and Planned Purchases on the y-axis for various
categories. The consumers’ mind and heart seem conflicted regarding the upcoming
Diwali purchases. This graph is a real representation of ‘what am I keen to buy’
versus ‘what I am really going to buy’ for Diwali 2020 shown in the four quadrants.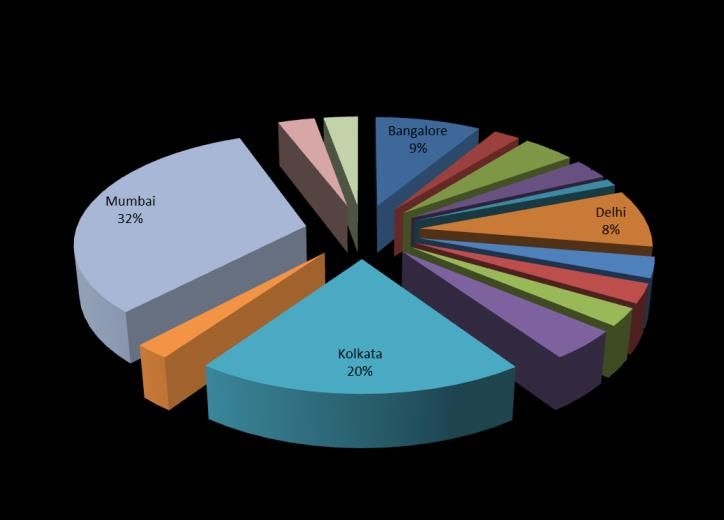
Quadrant I is a zone of ‘Very High Priority’ for spends. Categories that feature
here display high buying keenness and purchasing intent for Diwali 2020. The
Apparel category is a clear winner and outlier, flying out of the chart with
approximately 3.11 times higher Priority than the average of all other categories.

Mobile phones undoubtedly have become the most important accessory and features
high in this Quadrant. The third priority is to Consumer Electronics and consumers
want to buy or upgrade their washing machines, ACs and refrigerators, the
essentials which made life livable during this extended lockdown. Two Wheelers too
find a Very High Priority which seems will be a preferred transportation in the
future for its safety, increased mobility and costs.

The Quadrant II indicates ‘High Priority’ categories suggesting that these have a
high possibility of getting purchased even though the propensity is comparatively
lesser. The Coronavirus lockdown has given rise to the world’s largest Work-From
Home experiment, and consumers seem keen to indulge in Home Furniture as a
part of this new lifestyle change. On the other hand, Jewellery is getting the
spotlight as consumers are catching a fun in the price of gold and silver. With
wedding season coming up and margins on goad-loans going down, this consumer
appetite for this category is likely to be high this Diwali. TVs, which has become the
household’s favourite entertainment pod, evident through the surge in TV
viewership figures, is also on the High Priority buying lists of consumers.

The Quadrant III signifies a ‘Medium Priority’ as the buying keenness is high
however doesn’t fit in as planned purchases for Diwali. Personal accessories,
including watches and shoes, are seen to have high keenness among consumers.
Similarly, consumers seem to have a high inclination for cars, owing to a lack of
trust in public transport, but Diwali 2020 may not see cars rev too much, unless
consumers see value along with the utility. Triggered by the WFH imperative and
shift towards online education, Laptops also find their place to the list of high
buying keenness. The Kitchen, and by corollary, Kitchen Appliances are an
important priority for the family, and it has become even more accentuated due to
the continued absence of domestic help during the lockdown.

Lastly, the Quadrant IV is a ‘Low Priority’ zone indicating moderate keenness,
but low purchasing intent for this Diwali 2020. Restricted within the confines of
homes, consumers are keen to Travel, though it may not materialize much this year
due to strict restrictions. While the importance of Health Insurance has become
evident to all during these testing times, this category’s low planned purchase
quotient comes as a surprise, perhaps because of the well-known procrastination

syndrome of consumers when considering Health Insurance. Also, another one
which makes it to this list is Home Renovation, as people have become more
acquainted with flaws in their homes.
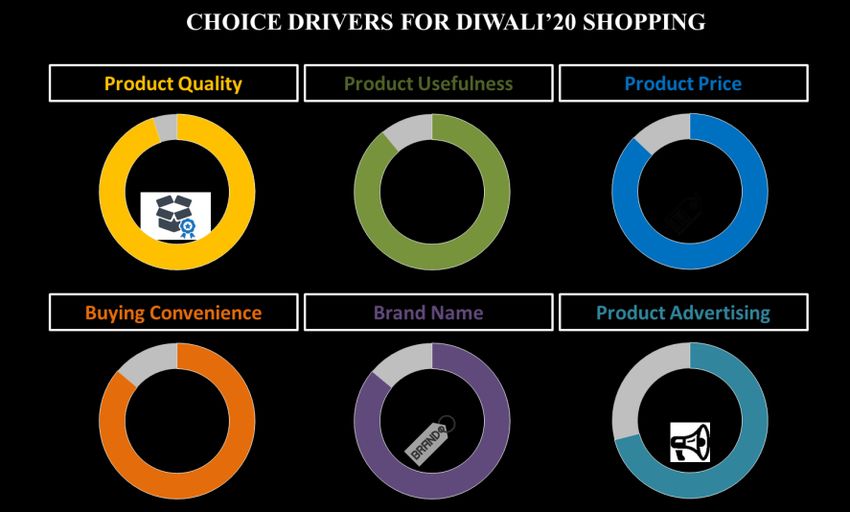
ADVERTISING IMPACT TO BE LESS THAN NORMAL, QUALITY ABOVE ALL
95% consumers rate Product Quality as the most important influence when making
purchases for Diwali 2020. This is followed by product usefulness (89%), Product
Price (88%), Buying Convenience (87%) and Brand Name (86%). With changing
consumer behaviour, advertising is also adjusted. Advertising at 71% remains the
lowest choice driver for Diwali shopping.
PROXIMITY GAINS, BIG FORMATS LOSE
The post Covid-19 world will sway
shopping behaviour of millions of
households as pandemic pushes
shoppers to buy more goods online and
ensure safety and hygiene practices in
their lives.
When asked how will be the shopping
affected after the situation subsides,
the index was calculated on basis of
five respondent answers –
‘Substantially Decrease’, ‘Somewhat
Decrease’, ‘Same as before’, ‘Somewhat
Increase’ and ‘Substantially Increase’
which gives a composite score showing
specific trends.
Going forward the pandemic is likely to
alter the shopping behavior completely.
Online shopping is set to see an
unprecedented boom in a post-Covid-19
world and scoring the highest at 260 in
the Preferred Outlet Index. Kiranas or
small standalone store get 172 points,
close-by Neighbourhood Stores are at
149, and Local Grocery stores at 145,
showing that the trust built by these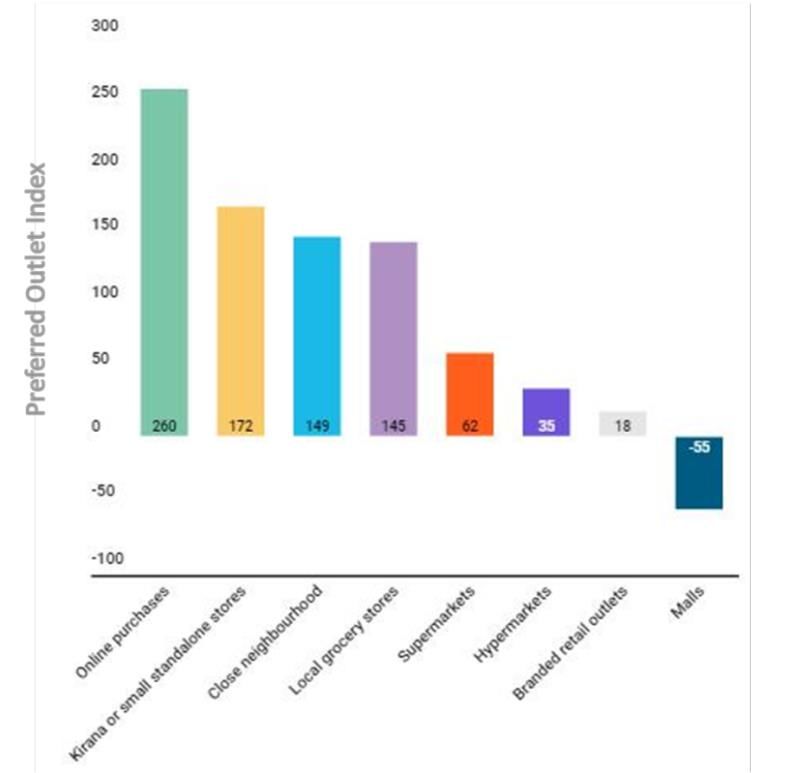
formats during the lockdown will come to their benefit in the years to come.

   Big formats stores like Supermarkets, Hypermarkets, and Branded outlets are still
   likely to see visitors and consumers, though the consumer visits are still likely to be
   low. Malls, however, will be the biggest Covid casualty as shoppers show
   tremendous reluctance even after relaxed norms and better safety, with a negative
   score of -55.

WHO WE SURVEYED?

   TRA did telephonic interviews with
   503 consumer-respondents from 16
   Indian cities with sampling divided as
   per the city population as shown in the
   graph

   47% respondents were SEC A1, 36%
   were SEC A2, 15% were SEC B1. All
   respondents were between 21years to
   50 years of age, and 71% of the
   respondents were males.
About TRA Research

TRA Research, a Comniscient Group company, is a consumer insights and brand
intelligence Company dedicated to understanding and analyzing stakeholder behavior
through two globally acclaimed proprietary matrices of Brand TrustTM and Brand DesireTM.
TRA Research conducts primary research with consumers and stakeholders to assist
brands with their business decisions based on Consumer Behavior insights.

TRA Research is consulting brands on transitioning during and after the Covid-19 crisis, to
help them be more aligned to consumer and client expectations.

TRA Research is the also the publisher of TRA’s Brand Trust ReportTM and of TRA’s Most
Desired BrandsTM.

For any further information or assistance, please feel free to contact:
N. Chandramouli, CEO, TRA Research
E: mouli@trustadvisory.info M: +91-9820189271

                                             ~~~

You can also read