Vehicle Driver Warning Systems Using Road Marking and Traffic Light Detection - OSF
←
→
Page content transcription
If your browser does not render page correctly, please read the page content below
American Journal of Engineering Research (AJER)                       2022
                       American Journal of Engineering Research (AJER)
                                     e-ISSN: 2320-0847 p-ISSN : 2320-0936
                                           Volume-11, Issue-01, pp-185-193
                                                             www.ajer.org
Research Paper                                                                                                      Open Access

Vehicle Driver Warning Systems Using Road Marking and Traffic
                        Light Detection
                     Akuwan Saleh1, Haryadi Amran D2,, Amanda Septia A2
     1,2
           (Department of Electrical Engineering, Politeknik Elektronika Negeri Surabaya, Surabaya,
                                                 Indonesia)

ABSTRACT :Everyone has experienced fatigue and sleepiness while driving. This makes him not know the
direction so that it violates traffic and can cause an accident. Violations that usually occur are breaking
through traffic lights and violating road markings. Therefore, a simulation software was made to help negligent
and sleepy drivers not to violate traffic and reduce accidents. The technology used is image processing with C#
programming and the EmguCV library using the Haar Cascade Classifier and Color Detection methods. Haar-
like features are rectangular features, which give a specific indication of an image. The captured image will be
processed in two stages, namely preprocessing to detect markings and Gaussian filter to detect traffic lights.
The results of the preprocessing will be processed in the Haar Cascade Classifier to get the ROI of the marker
and then look for the coordinates to find the distance between the marker and the driver. The limit used in
measuring distance is 25.57 cm (85 pixels). If the coordinate distance is less than 25.57 cm, the alarm will
sound and alert the driver to stay away from the marker and if the coordinate distance is more than 25.57 cm,
the alarm will be off. While the results of the gaussian filter will be converted into HSV frames to detect red and
green colors using the color pixel values of each color. The color of the light can be detected when the contour
size value is between 0 and 6.
KEYWORDS Road Marking, Image Processing, Haar Cascade Classifier, and Color Detection.
--------------------------------------------------------------------------------------------------------------------------------------
Date of Submission: 16-01-2022                                                                  Date of acceptance: 31-01-2022
--------------------------------------------------------------------------------------------------------------------------------------

                                               I. INTRODUCTION
           Drowsiness is something that is always experienced by many people. If a person lacks sleep, is tired of
working, and so on, it will definitely cause someone to be sleepy. Especially if someone is on the way.
Especially in urban environments that require constant concentration of the driver resulting in visual fatigue [1].
Of course this is very detrimental because it can endanger yourself and others. Currently, there are frequent
traffic violations that can lead to accidents. Most of the causes are due to negligent and sleepy drivers.
           In the 2019 Land Transportation Statistics Data, During the 2015-2019 period, the number of traffic
accidents has increased by an average of 4.87 percent per year. Improvement in the number of traffic accidents
is followed by an increase in the number of dead and slightly injured by 1.41 percent and 6.26 percent,
respectively. However, material losses increased by an average of 4.23 percent per year. Indonesian State Police
(Korlantas POLRI) recorded the number of accidents in 2019 as many as 116,411 accidents. The number has
incresed 6.59 percent compared to 2018 as many as 109,215 events [2].
           Things like this must of course be minimized so that the number of violations can be reduced. To
overcome these problems, in this research, the Detection of Road Marks and Traffic Lights Based on Image
Processing is made. The detection is visualized in the form of software. If the driver approaches the road
marking there will be a reminder alarm to notify the driver to stay away from the marking line, and if there is a
traffic light, an alarm will sound to notify the driver if the light shows red or green.
           With this detection can help drivers who are negligent or sleepy on the way so as to reduce traffic
violations and avoid accidents.

                                       II. MATERIAL AND METHOD
2.1 ROAD MARKINGS
Road marking is a sign located on the road surface or above the road surface which includes equipment or signs
that form longitudinal lines, transverse lines, oblique lines and other symbols that function to direct traffic flow

  www.ajer.org                                                                                                            Page 185

  www.ajer.org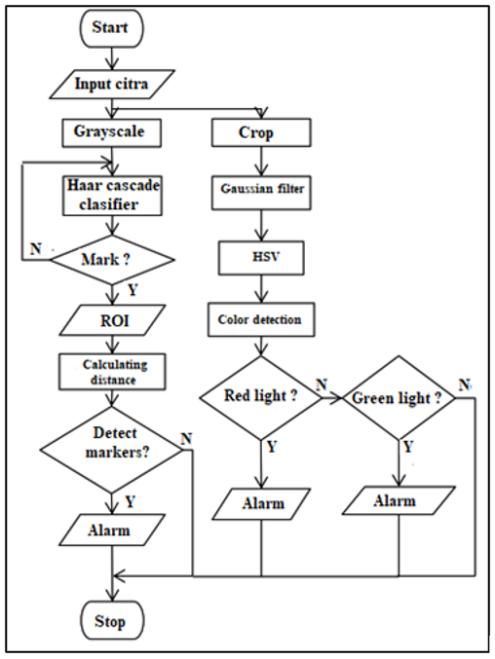
American Journal of Engineering Research (AJER) 2022
and limit traffic interest areas. Road markings are regulated in the Minister of Transportation Regulation
Number 34 of 2014 [3].Longitudinal markings are marks that are parallel to the axis of the road. longitudinal
markings connected by transverse lines used to delimit parking spaces in vehicle traffic lanes are not considered
as longitudinal road markings. Types of road marks as shown Table 1.
TABLE I. MARK TYPE
Mark Mark Name Meaning
Line separator
Dotted line marker Lane separator
That there will be full line longitudinal markings / full line
Approach mark marking approaches
It is forbidden to pass through the marker
Full line marking
Road lanes on the side of the solid line are prohibited
Dotted and intact
from crossing these markings
line markings
The lane on the side of the dotted line may cross that line
Marking two solid It is forbidden to pass through these markings and be
lines installed if the road has three or more lanes
2.2 TRAFFIC LIGHT
Traffic lights (according to Law no. 22/2009 on Traffic andRoad Transportation: traffic signaling device or
APILL) is a light that controls traffic flow installed at road junctions, zebra crossings, and other traffic flow
areas. These lights indicate when the vehicle must run and stop alternately from various directions. Traffic
regulation at crossroads is intended to regulate the movement of vehicles in each group of vehicle movements so
that they can move alternately so that they do not interfere with each other between existing flows [4].
Fig.1. Example of traffic lights
2.3 SYSTEM PLANNING
Software created using objects in the form of highways that have road markings and traffic lights. This object
was recorded using a camera mounted on a motorcycle. Fig.2 shows block diagrams and system flowcharts.
Fig. 2. Block diagrams and system flowcharts
www.ajer.org Page 186
www.ajer.org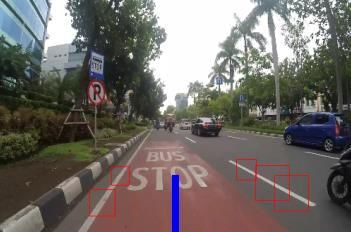
American Journal of Engineering Research (AJER) 2022
The videos obtained are processed by preprocessing and followed by the haar cascade classifier for get
the road marking object. Meanwhile, to detect traffic lights, video frames will be cropped and processed with a
gaussian filter and followed by color detection to detect the color of traffic lights. If the traffic light is red, the
alarm will activate and warn the driver to stop, if the light is green, the alarm will tell you to keep going, if the
driver approaches the marker, the alarm will warn you to stay away from the marker.For more details,
2.4 GAUSSIAN FILTER
Gaussian filter or gaussian blur filter is one of the basic and widely used image processing techniques.
Gaussian filter [5] is a basic preprocessor used to remove noise in each image, then the image is transferred to a
gray map. Gaussian filters are very good at removing normally distributed noise. In Figure 3, after converting
the image to grayscale, cropping is done and the next step is to determine the mask. Masks that are often used
for image improvement are Gaussian smoothing masks [6],[7]. The weights on the Gaussian smoothing mask
follow a normal distribution as stated in the equation below:
(1)
Where:
σ is the standard deviation value of the normal distribution used. The greater the value of σ, the more
neighboring points are included in the calculation.
x=m and y=n are the coordinates of the mask where the coordinates (0,0) are the positions of the midpoint
of the mask that have the greatest / highest value.
π is a constant with the value 3.14.
e is a natural number constant with the value 2.718281828
2.5 HAAR CASCADE CLASSIFIER
The haar cascade method uses the haar feature function which requires prior training to obtain a
decision tree called the cascade classifier, to determine the presence or absence of objects in the processed
image [8]. In general, Haar-Like Feature is used to detect objects in digital images [9]. The haar cascade
classifier method is used to detect road markings. Where this method will classify marker data existing ones to
find suitable features. The vehicle camera captures RGB three-channel color images, and most of the road
markings are white [10].The first thing to do is change the RGB frame to a grayscale frame. This frame each
pixel has a gradient color ranging from white to black (0-255). Then the results of this frame are processed using
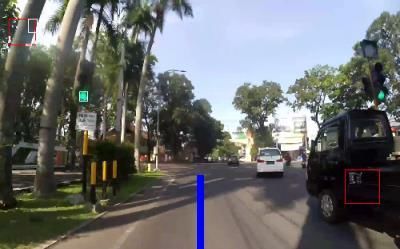
the haar cascade classifier method. Fig.3shows the flowchart and process of the haar cascade classifier for road
marking detection.
Fig.3. Flowchart and process of haar cascade classifier
This method will classify existing road marking data to find features that match the road markings and
this feature is used to detect road markings.In haar cascade classifier must first create an XML file first. First of
www.ajer.org Page 187
www.ajer.org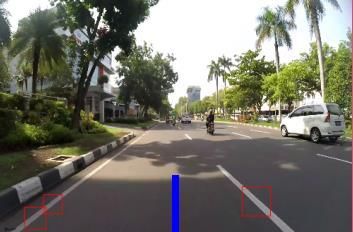
American Journal of Engineering Research (AJER)                                                            2022
all, make a positive and negative picture. Positive images are images of road markings, while negative images
are images other than road markings. Then make a positive data sample by cropping the images one by one.
Positive data samples are stored in vector files. The next process is doing training. This process is carried out to
obtain features that match the road markings. The more features that are used, the longer it takes to classify. The
pre-built cascade classifiers are combined or converted into an XML file. This file will be read or loaded on the
program so that it can detect traffic signs and lights. Region of interest (ROI) detector helps prune the image to
portions which are good candidates for being road markings [11].To determine the distance, the distance
between the coordinates of the ROI marker with red box line and the driver's coordinates (blue line) is used. The
formula used to determine the distance is as follows:
                                                                                (2)
                                                                             (3)
                                                                           (4)
         The distance of the resulting marker is from the coordinates of the marker and the driver who then
calibrated with 0.300808422 this value is the pixel/cm value.

2.6 COLOR DETECTION
         In detecting traffic lights, color detection is used. Where the colors to be detected are red and green.
The method takescropped RGB color images as the input. Images are then converted from the RGB color space
to the HSV color space [12]. Frames that have been cropped and filtered using a Gaussian filter are converted to
HSV and then red and green are searched for using the minimum and maximum values for each color.

                                         Fig.5. Color detection process

                  Where the value of red has a minimum value (166, 84, 141) and maximum (186, 255, 255)
while the green color has a minimum value (66,122, 129) and a maximum (86, 255, 255). To get the ROI of the
lamp, contour is used. If the contour size has a value between 0 to 6, then the ROI of the lamp will appear, if the
contour size value is other than 0 to 6 then the ROI does not appear.

                                         III. RESULT AND DISCUSSION
         System testing is carried out based on light intensity, namely in light, overcast, and dark conditions. In
testing road markings, three road locations were used.The first video takes the Dr.Ir.H.Soekarno road near
campus C UNAIR, the second video takes the southern Dr.Ir.H.Soekarno road, and the third video takes the
Kertajaya Indah road in the city of Surabaya, Indonesia.Traffic light testing was carried out from Jalan Ijen to
Jalan Kawi in the Malang City area, Indonesia. The time needed in bright conditions to get results in the form of
information about road markings and traffic lights that are detected is 1.6 seconds. Meanwhile, when it is
overcast and dark, the time it takes is 0.9 seconds.

3.1 ROAD M ARK DETECTION
Table 2. is the result of testing which shows that video 1, video 2, and video 3 can detect road markings in light,
overcast, and dark conditions. This is indicated by the appearance of a red ROI rectangle on the frame.

  www.ajer.org                                                                                            Page 188

  www.ajer.org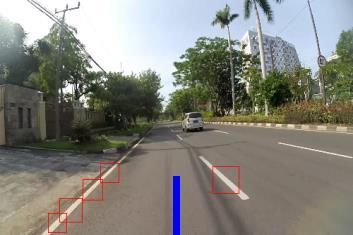
American Journal of Engineering Research (AJER)                                                             2022
                                  TABLE 2. ROAD MARK DETECTION RESULTS
        Condition      Video 1                      Video 2                      Video 3
        Light

        Overcast

        Dark

Tables 3 to 11 are test results data on road markings consisting of contour values, coordinate values, distances in
pixels, distances in centimeters, voice, and descriptions.

3.1.1 DETECTION OF ROAD MARKINGS IN LIGHT CONDITIONS
The test results on video 1, video 2, and video 3 in light conditions are shown in Tables 3 to 5.
                                       TABLE 3. TEST RESULT ON VIDEO 1
Seconds             Contour Value             Value (x,y)     Distance   Distance   Voi         Description
to                                            X     Y         (pixels)     (cm)      ce
10          X=268, Y=241, W=43, H=43          289 262         46.329     13.9349    On     Stay away from Marks
20          X=284, Y=260, W=48, H=48          308 284         47.1699    14.1891    On     Stay away from Marks
30          X=134, Y=238, W=43, H=43          155 259         116.811    35.1377    Off    Safe Distance
40          X=296, Y=154, W=27, H=27          309 167         141.354    42.5204    Off    Safe Distance
50          X=346, Y=207, W=51, H=51          371 232         127.318    38.2983    Off    Safe Distance
60          X=174, Y=230, W=67, H=67          207 263         68.5054    20.6070    On     Stay away from Marks
                                       TABLE 4. TEST RESULT ON VIDEO 2
Seconds             Contour Value             Value (x,y)     Distance   Distance   Voi         Description
to                                            X    Y          (pixels)     (cm)      ce
10          X=286, Y=258, W=43, H=43          307 279         48.3011    14.5293    On     Stay away from Marks
20          X=242, Y=279, W=30, H=30          257 294         9.8994     2.97782    On     Stay away from Marks
30          X=437, Y=122, W=40, H=40          457 142         250.059    75.2198    Off    Safe Distance
40          X=36, Y=288, W=26, H=26           49   301        215        64.6738    Off    Safe Distance
50          X=171, Y=246, W=58, H=58          200 275         69.0796    20.7797    On     Stay away from Marks
60          X=338, Y=243, W=46, H=46          361 266         103.121    21.0196    Off    Safe Distance
                                      TABLE 5. TEST RESULTS ON VIDEO 3
Seconds              Contour Value             Value (x,y) Distance      Distance Voi               Description
to                                                         (pixels)        (cm)   ce
                                               X     Y
10        X=107, Y=263, W=31, H=31             122 278 143.850            43.2712   Off    Safe Distance
20        X=299, Y=129, W=44, H=44             321 151 160.464            48.2689   Off    Safe Distance
30        X=254, Y=223, W=76, H=76             292 261 48.8262            14.6873   On     Stay away from Marks
40        X=394, Y=267, W=34, H=34             411 284 147.979            44.5135   Off    Safe Distance
50        X=288, Y=253, W=42, H=42             309 274 52.4785            15.7859   On     Stay away from Marks
60        X=336, Y=213, W=45, H=45             358 235 114.856            34.5496   Off    Safe Distance
W=Width, H=Height

  www.ajer.org                                                                                              Page 189

  www.ajer.org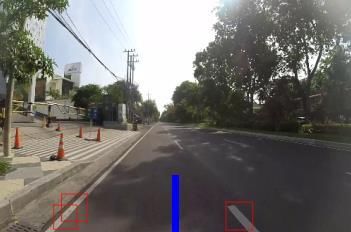
American Journal of Engineering Research (AJER)                                                           2022
         From the data generated, in Table 3 it can be seen that the driver approaches the road markings at the
10th, 20th, and 60th seconds so that the alarm is on.For Table 4 the driver approaches the road markings at the
10th, 20th, 50th seconds. While in Table 5, the driver approaches the road markings at the 30th and 50th
seconds.Based on the 10th second data in table 5, the ROI coordinate value can be calculated using equation 2:

Furthermore, the calculation of distance (pixels) and distance (cm) can be calculated by equations 3 and 4.
                                                                                      =143.850
                                                              = 43.2712

3.1.2 DETECTION OF ROAD MARKINGS IN OVERCAST CONDITIONS
The test results on Tables 6 to 8 are the results of tests on video 1, video 2, and video 3 which were carried out
in cloudy/overcast conditions.
                                      TABLE 6. TEST RESULTS ON VIDEO 1
Seconds             Contour Value             Value (x,y)   Distance   Distance    Voi          Description
to                                            X    Y        (pixels)     (cm)       ce
10           X=93, Y=276, W=35, H=35          110 293       154.207    46.3867     Off   Safe Distance
20           X=164, Y=205, W=25, H=25         176 217       121.655    36.5948     Off   Safe Distance
30           X=253, Y=205, W=32, H=32         269 221       80.1560    24.1115     On    Stay away from Marks
40           X=182, Y=243, W=38, H=38         201 262       74.0945    22.2882     On    Stay away from Marks
50           X=170, Y=236, W=31, H=31         185 251       93.4933    28.1235     Off   Safe Distance
60           X=341, Y=238, W=40, H=40         361 258       106.103    31.9166     Off   Safe Distance
                                      TABLE 7. TEST RESULTS ON VIDEO 2
Seconds            Contour Value              Value (x,y)   Distance   Distance    Voi          Description
to                                            X     Y       (pixels)     (cm)       ce
10          X=317, Y=220, W=37, H=37          335 238       94.9210    28.5530     Off    Safe Distance
20          X=221, Y=243, W=44, H=44          243 265       41.6773    12.5368     On     Stay away from Marks
30          X=266, Y=251, W=50, H=50          291 276       36.7967    11.0687     On     Stay away from Marks
40          X=280, Y=256, W=40, H=40          300 276       44.8292    13.4850     On     Stay away from Marks
50          X=261, Y=196, W=35, H=35          278 213       89.1066    26.8040     Off    Safe Distance
60          X=174, Y=260, W=50, H=50          199 285       66.9402    20.1361     On     Stay away from Marks
                                      TABLE 8. TEST RESULTS ON VIDEO 3
Seconds            Contour Value              Value (x,y) Distance Distance Voi                Description
to                                            X      Y      (pixels)    (cm)       ce
10          X=376, Y=262, W=41, H=41 396             282 133.360 40.1158 Off Safe Distance
20          X=237, Y=258, W=34, H=34 254             275 27.8567 8.37952 On Stay away from Marks
30          X=366, Y=258, W=32, H=32 382             274 121.049 36.4125 Off Safe Distance
40          X=168, Y=248, W=53, H=53 194             274 75.0266 24.5686 On Stay away from Marks
50          X=331, Y=249, W=39, H=39 350             268 92.1140 27.7086 Off Safe Distance
60          X=362, Y=282, W=31,H=31 377              297 113.070 34.1240 Off Safe Distance
 W=Width, H=Height
 Based on the 10th second data in table 8, the ROI coordinate value can be calculated using equation 2:

Furthermore, the calculation of distance (pixels) and distance (cm) can be calculated by equations 3 and 4.
                                                                 =
                  d

3.1.3 DETECTION OF ROAD MARKINGS IN DARK CONDITIONS
The test results on Tables 9 to 11 are the results of tests on video 1, video 2, and video 3 which were carried out
in dark conditions.

  www.ajer.org                                                                                           Page 190

  www.ajer.org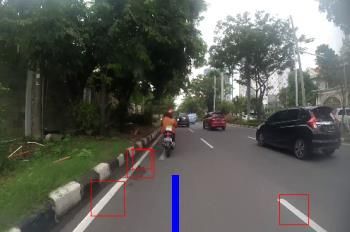
American Journal of Engineering Research (AJER)                                                            2022
                                       TABLE 9. TEST RESULTS ON VIDEO 1
Seconds              Contour Value              Value (x,y) Distance Distance         Voi          Description
to                                             X      Y     (pixels)   (cm)            ce
10            X=223, Y=251, W=54, H=54         250    278 26.9258 8.09950             On     Stay away from Marks
20            X=265, Y=280, W=33, H=33         381    296 117.106 35.2264             Off    Safe Distance
30            X=390, Y=290, W=27, H=27         403    303 139.012 41.8159             Off    Safe Distance
40            X=276, Y=261, W=44, H=44         298    283 38.4707 11.5723             On     Stay away from Marks
50            X=171, Y=217, W=25, H=25         183    229 108.374 32.7802             Off    Safe Distance
60            X=320, Y=224, W=30, H=30         335    239 94.2602 28.3542             Off    Safe Distance
                                       TABLE 10. TEST RESULTS ON VIDEO 2
Seconds              Contour Value              Value (x,y) Distance Distance         Voi          Description
to                                             X      Y     (pixels)   (cm)            ce
10             X=328, Y=251, W=37, H=37        346    269 88.0222 26.4778             Off    Safe Distance
20             X=335, Y=247, W=44, H=44        357    269 98.3514 29.5849             Off    Safe Distance
30             X=291, Y=224, W=46, H=46        314    247 73.5934 22.1375             On     Stay away from Marks
40             X=150, Y=216, W=32, H=32        166    232 119.854 36.0530             Off    Safe Distance
50             X=129, Y=264, W=33, H=33        145    280 120.838 36.3490             Off    Safe Distance
60             X=228, Y=230, W=65, H=65        260    262 39.2045 11.7930             On     Stay away from Marks
                                       TABLE 11. TEST RESULTS ON VIDEO 3
Seconds to           Contour Value              Value (x,y) Distance Distance         Voi          Description
                                               X      Y     (pixels)   (cm)            ce
10            X=242, Y=246, W=48, H=48         266    270 31.0644 9.34443             On    Stay away from Marks
20            X=271, Y=208, W=45, H=45         293    230 76.6941 23.0702             On    Stay away from Marks
30            X=151, Y=249, W=43, H=43         172    270 97.8243 29.4263             Off   Safe Distance
40            X=94, Y=250, W=48, H=48          118    274 148.475 44.6625             Off   Safe Distance
50            X=211, Y=229, W=47, H=47         234    252 57.4543 17.2827             On    Stay away from Marks
60            X=372, Y=229, W=52, H=52         398    255 141.675 42.6170             Off   Safe Distance
 W=Width, H=Height
          The x and y coordinate values or can be called the midpoint are obtained from the x, y, width, and
 height values of the detected ROI. Because the distance limit uses a value of 25.57 cm or 85 pixels, then a
 distance value that exceeds 25.57 cm is at a safe distance and the alarm is off while a distance value of less than
 25.57 cm is at an unsafe distance so that the alarm is on to warn the driver.

 3.2 TRAFFIC LIGHT DETECTION
 Detected traffic lights are indicated by the appearance of a white ROI rectangle on the frame. Traffic light test
 data will be entered into the table. Where the data is in the form of the number of lights detected, the actual
 number of lights, the color of the lights, the sound, and the status.
                                     TABLE 12. TESTING ON TRAFFIC LIGHTS
      Condition         Light                          Overcast                       Dark
      Detection
      Results

 Tables 13 to 15 will show traffic light test data in light, overcast, and dark conditions. The actual number of
 lights is the number of traffic lights installed on the left and right of the road.
                      TABLE 13. TRAFFIC LIGHT DETECTION RESULTS IN LIGHT CONDITIONS
             Test   Actual Number of          Number of           Lamp Color     Voice         Status
             to          Lights             Lights Detected
             1      2                       1                     Green          On         Way forward
             2      2                       1                     Green          On         Way forward
             3      2                       Not Detected          -              -          -

   www.ajer.org                                                                                            Page 191

   www.ajer.org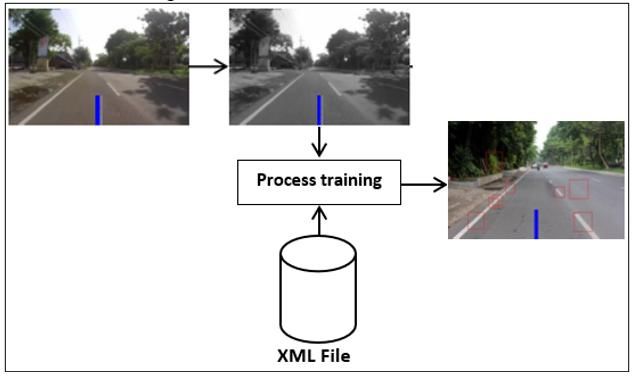
American Journal of Engineering Research (AJER)                                                                                   2022
          4       2                        2                    Green           On       Way forward
          5       2                        2                    Green           On       Way forward
From Table 13 it can be seen that the third test was not detected, because the distance between the traffic light
and the camera was too far and was covered by signs. Accuracy results in light or bright conditions reach 60%.
                     TABLE 14. TRAFFIC LIGHT DETECTION RESULTS IN OVERCAST CONDITIONS
          Test     Actual Number of            Number of        Lamp Color Voice                Status
          to             Lights             Lights Detected
           1      2                        2                    Red             On        Stop
           2      2                        2                    Red             On        Stop
           3      2                        1                    Green           On        Way forward
           4      2                        3                    Red             On        Stop
           5      2                        1                    Red             On        Stop
From Table 14 it can be seen that all traffic lights can be detected. However, there is still a 3rd test error. The
resulting accuracy in overcast conditions is 90%.
                        TABLE 15. TRAFFIC LIGHT DETECTION RESULTS IN DARK CONDITIONS
          Test        Actual Number of                Number of             Lamp Color           Voice            Status
          to               Lights                   Lights Detected
          1          2                             2                        Red                 On          Stop
          2          2                             -                        Yellow              Off         -
          3          2                             3                        Red                 On          Stop
          4          2                             2                        Green               On          Way forward
          5          2                             3                        Green               On          Way forward

From Table 15 it can be seen that at night conditions, traffic lights are a little difficult to detect because the light
emitted by the lights is too diffuse and too bright. In the second test, it was not detected because the light
emitted was yellow while the detected lights were red and green. From the results obtained, it can be seen that
the level of accuracy in dark conditions is 75%.

                                                 IV. CONCLUSION
          From the discussion above, it can be concluded that, the driver alarm will sound if the resulting
distance is less than 25.57 cm or 85 pixels. If the resulting distance exceeds 25.57 cm then the alarm does not
sound, stating that the distance between the marker and the driver is long distance.
          The highest traffic light detection accuracy during cloudy/overcast conditions is 90%. The cause
of errors when detecting traffic lights is that many objects other than traffic lights have the same color.
        The system has succeeded in issuing an output in the form of a warning alarm in accordance
with the conditions of the markings and traffic lights. When the red light is detected, the alarm will
warn the driver to stop temporarily, if the green light the alarm will tell the driver to continue.

                                                           REFERENCES
[1].   Aneesh, A. N., Shine, L., Pradeep, R., & Sajith, V. “Real-time Traffic Light Detection and Recognition based on Deep RetinaNet
       for Self Driving Cars,” 2019 2nd International Conference on Intelligent Computing, Instrumentation and Control Technologies
       (ICICICT), pp.1554-1557, (2019), DOI: 10.1109/ICICICT46008.2019.8993293
[2].   Badan Pusat Statistik Indonesia, “Statistik transportasi darat 2019 (Land transportation statistics 2019),” BPS-Statistics, Indonesia,
       No. 06140.2002, ISSN.2598-5612, pp. 28-32, (2019),
[3].   Regulation of the Minister of Transportation of the Republic of Indonesia Number PM 34 of 2014 concerning Road Markers,
       Chapter I, Article 1.
[4].   Law of the Republic of Indonesia Number 22 of 2009 concerning Traffic and Transportation of Road, Chapter 1, Article 1.
[5].   Niu, J., Liu, Y., Guizani, M., & Ouyang, Z. “Deep CNN-based Real-time Traffic Light Detector for Self-driving Vehicles”, IEEE
       Transactions on Mobile Computing, 1–1, pp.1-14, (2019), DOI:10.1109/tmc.2019.2892451.
[6].   I Dewa Gede R S, I Made W, “Gaussian filtering method to remove noise in images,” Jurnal Elektronik Ilmu Komputer Udayana,
       vol.10, no.1, pp. 53-56, (August 2021).
[7].   Hery Sunandar, “Perbaikan kualitas citra menggunakan metode gaussian filter,” MEANS (Media Informasi Analisa dan Sistem),
       vol.2, no.1, pp.19-22, (Juni 2017).
[8].   M. Hanif A, Haryadi Amran D, and Akuwan Saleh, “Face recognition system for prevention of car theft with haar cascade and local
       binary pattern histogram using raspberry pi,” EMITTER International Journal of Engineering Technology, vol. 8, no. 2, pp.
       407~425, (December 2020), DOI : 10.24003/emitter.v8i2.534.

   www.ajer.org                                                                                                                  Page 192

   www.ajer.org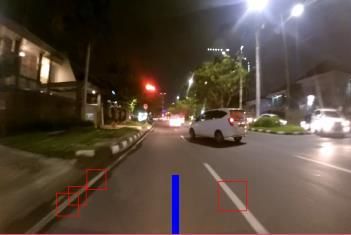
American Journal of Engineering Research (AJER)                                                                                2022
[9].     Haryadi Amran D, Akuwan Saleh, Indria Dwi M, “Implementasi deteksi gerak berbasis image processing untuk monitoring rumah,”
         Seminar Nasional Teknologi Elektro Terapan (SNTET), Malang, Indonesia, vol.03, ISSN: 2581-0049, pp. 55-60,(2019).
[10].    Ding, L., Zhang, H., Xiao, J., et al,“A comprehensive approach for road marking detection and recognition”,. Multimedia Tools and
         Applications, (2020), DOI:10.1007/s11042-019-08384-5
[11].    Tai Huu-Phuong Tran, Cuong Cao Pham, et al, “Real-time traffic light detection using color density,” in Proc. 2016 IEEE
         International Conference on Consumer Electronics-Asia (ICCE-Asia), Suwon, Korea, (2016), DOI:10.1109/ICCE-
         Asia.2016.7804791.
[12].    Tao Wu and Ananth R, “A practical system for road marking detection and recognition,” in Proc. 2012 Intelligent Vehicles
         Symposium, Alcalá de Henares, Spain, pp. 25-30, (June 3-7, 2012), DOI:10.1109/ivs.2012.6232144.

       Akuwan Saleh, et. al. "Vehicle Driver Warning Systems Using Road Marking And Traffic Light
       Detection.”American Journal of Engineering Research (AJER), vol. 11(01), 2022, pp. 185-193.

   www.ajer.org                                                                                                               Page 193

   www.ajer.org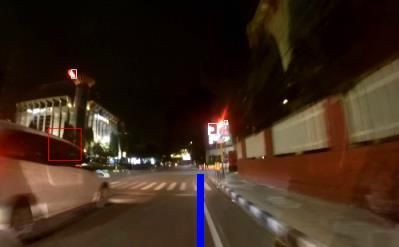
You can also read