Validation of the PALM model system 6.0 in a real urban environment: a case study in Dejvice, Prague, the Czech Republic - GMD
←
→
Page content transcription
If your browser does not render page correctly, please read the page content below
Geosci. Model Dev., 14, 4797–4842, 2021
https://doi.org/10.5194/gmd-14-4797-2021
© Author(s) 2021. This work is distributed under
the Creative Commons Attribution 4.0 License.

Validation of the PALM model system 6.0 in a real urban
environment: a case study in Dejvice, Prague,
the Czech Republic
Jaroslav Resler1 , Kryštof Eben1 , Jan Geletič1 , Pavel Krč1 , Martin Rosecký1 , Matthias Sühring2 , Michal Belda3 ,
Vladimír Fuka3 , Tomáš Halenka3 , Peter Huszár3 , Jan Karlický3 , Nina Benešová4 , Jana Ďoubalová3,4 ,
Kateřina Honzáková4 , Josef Keder4 , Šárka Nápravníková4 , and Ondřej Vlček4
1 Institute
         of Computer Science of the Czech Academy of Sciences, Prague, Czech Republic
2 Institute
         of Meteorology and Climatology, Leibniz University Hannover, Hanover, Germany
3 Department of Atmospheric Physics, Faculty of Mathematics and Physics, Charles University, Prague, Czech Republic
4 Czech Hydrometeorological Institute, Prague, Czech Republic

Correspondence: Jaroslav Resler (resler@cs.cas.cz)

Received: 31 May 2020 – Discussion started: 14 August 2020
Revised: 3 May 2021 – Accepted: 25 June 2021 – Published: 3 August 2021

Abstract. In recent years, the PALM 6.0 modelling system         modelled, resulting in higher near-surface concentrations. At
has been rapidly developing its capability to simulate phys-     most of the evaluation points, the simulated surface temper-
ical processes within urban environments. Some examples          ature reproduces the observed surface temperature reason-
in this regard are energy-balance solvers for building and       ably well for both absolute and daily amplitude values. How-
land surfaces, a radiative transfer model to account for mul-    ever, especially for the winter episodes and for modern build-
tiple reflections and shading, a plant-canopy model to con-      ings with multilayer walls, the heat transfer through walls
sider the effects of plants on flow (thermo)dynamics, and a      is not well captured in some cases, leading to discrepancies
chemistry transport model to enable simulation of air qual-      between the modelled and observed wall-surface tempera-
ity. This study provides a thorough evaluation of modelled       ture. Furthermore, the study corroborates model dependency
meteorological, air chemistry, and ground and wall-surface       on the accuracy of the input data. In particular, the tempera-
quantities against dedicated in situ measurements taken in an    tures of surfaces affected by nearby trees strongly depend on
urban environment in Dejvice, Prague, the Czech Republic.        the spatial distribution of the leaf area density, land surface
Measurements included monitoring of air quality and mete-        temperatures at grass surfaces strongly depend on the ini-
orology in street canyons, surface temperature scanning with     tial soil moisture, wall-surface temperatures depend on the
infrared cameras, and monitoring of wall heat fluxes. Large-     correct setting of wall material parameters, and concentra-
eddy simulations (LES) using the PALM model driven by            tions depend on detailed information on spatial distribution
boundary conditions obtained from a mesoscale model were         of emissions, all of which are often unavailable at sufficient
performed for multiple days within two summer and three          accuracy. The study also points out some current model limi-
winter episodes characterized by different atmospheric con-      tations, particularly the implications of representing topogra-
ditions.                                                         phy and complex heterogeneous facades on a discrete Carte-
   For the simulated episodes, the resulting temperature,        sian grid, and glass facades that are not fully represented in
wind speed, and chemical compound concentrations within          terms of radiative processes.
street canyons show a realistic representation of the observed      Our findings are able to validate the representation of
state, except that the LES did not adequately capture night-     physical processes in PALM while also pointing out specific
time cooling near the surface for certain meteorological con-    shortcomings. This will help to build a baseline for future de-
ditions. In some situations, insufficient turbulent mixing was

Published by Copernicus Publications on behalf of the European Geosciences Union.
4798                                                    J. Resler et al.: PALM model validation in a real urban environment

velopments of the model and improvements of simulations of         the atmosphere with the Earth’s surface or cloud micro-
physical processes in an urban environment.                        physics). This system core is complemented by a rich set of
                                                                   PALM-4U (PALM for urban applications) modules related
                                                                   to the modelling of physical phenomena relevant for urban
                                                                   climate, such as the interaction of solar radiation with ur-
1   Introduction                                                   ban surfaces and with urban vegetation, sensible and latent
                                                                   heat fluxes from the surfaces, storage of heat inside build-
A majority of the world’s population live in large cities (55 %    ings and in pavements, or dispersion and chemical reaction of
as of 2018), and this percentage is expected to grow (UN,          air pollutants (see Maronga et al., 2020). The first version of
2019). At the same time, global climate change, especially         the PALM urban components represented the urban surface
global temperature increases, will influence nearly every nat-     model (PALM-USM) which has been validated using data
ural ecosystem and human society, with potentially severe          from a short experimental campaign in the centre of Prague
impacts worldwide. Thus, the high level of attention cur-          (Resler et al., 2017). The new set of modules in PALM is
rently being paid to the impact of climate change on urban         more general and is divided according to the physical pro-
areas is amply justified and is supported by many impor-           cesses that they cover. The most relevant for urban climate
tant studies and reports of global standing (IPCC, 2014a, b).      are the land surface model (LSM), the building surface model
This intensifying urbanization has heightened the awareness        (BSM), the radiative transfer model (RTM), the plant-canopy
that control of the microclimate in the urban environment,         model (PCM), and the chemistry transport model (CHEM).
which can reduce heat stress and prompt other general envi-        The human biometeorology module (BIO) then allows the
ronmental improvements, is crucial for the well-being of city      evaluation of the impact of simulated climate conditions on
inhabitants (Mutani and Fiermonte, 2017). The problem of           the human population.
increased heat stress in urban areas as a consequence of what         Validation of the urban model requires a dataset of mea-
has become known as the urban heat island (UHI) is, there-         surements of the urban meteorological and air quality con-
fore, of direct concern to municipal authorities, who are well     ditions, the properties of the urban canopy elements, and
aware that the physical well-being of their inhabitants is vital   the energy exchange among parts of the urban canopy. Sev-
to the well-being of the whole city. Moreover, the UHI effect      eral campaigns of comprehensive observations and measure-
is often followed by secondary processes, such as air quality      ments of the urban atmospheric boundary layer, covering
issues. Researchers have responded to, or anticipated, such        more than one season, have been done in the past: the Basel
concern and the requirement for modelling of urban climate         UrBan Boundary Layer Experiment (BUBBLE) dataset con-
processes, and several small-grid-scale models and frame-          taining observations from Basel is specifically targeted for
works for numerical climate modelling have recently been           validation of urban radiation models, urban energy-balance
developed (Geletič et al., 2018).                                 models, and urban canopy parameterizations (Rotach et al.,
   The health and well-being of the urban population is in-        2005); MUSE (Montreal Urban Snow Experiment) is aimed
fluenced by the conditions of the urban environment. The lo-       at the thermoradiative exchanges and the effect of snow cover
cal microclimate, exposure to pollutants, and general human        in the urban atmospheric boundary layer (Lemonsu et al.,
comfort depends strongly on the local conditions driven by         2008); and the CAPITOUL (Canopy and Aerosol Particles
the urban environment. The turbulent flow, exchange of latent      Interaction in TOulouse Urban Layer) project (Masson et al.,
and sensible heat, and radiative transfer processes play an im-    2008) is aimed at the role of aerosol particles in the urban
portant role in the urban microclimate and need to be consid-      layer.
ered in modelling approaches. The implementation of impor-            Results of urban measurement campaigns have already
tant microclimate processes (e.g. turbulence, heat fluxes and      been used for the validation of several micrometeorological
radiation) in street-level-scale models is typically partially     models, models of radiative transfer, and microscale chemi-
or fully parameterized. The most exhaustive approach con-          cal transport models. Microscale model validation causes dif-
sists of a group of computational fluid dynamics (CFD) mod-        ficulties due to the high heterogeneity of the urban environ-
els. The explicit simulation of turbulent flow is computation-     ment and the modelled variables, uncertainty in the detailed
ally demanding; thus, various techniques have to be adapted        knowledge of urban canopy properties, and local irregular-
to make calculations feasible, usually based on limiting the       ities caused by domain discretization. Important examples
range of the length scales and timescales of the turbulent flow    of such validation studies have been published by Qu et al.
to be resolved.                                                    (2013), Maggiotto et al. (2014), and Toparlar et al. (2015).
   This study uses the PALM model system 6.0 (Maronga et           These validation studies most frequently analyse RANS-type
al., 2020), which is an atmospheric modelling system. The          micrometeorological models. Early examples of LES valida-
core of the system contains model dynamics based on the            tion studies that include thermal conditions within cities were
LES (large-eddy simulation) and RANS (Reynolds-averaged            presented by Nozu et al. (2008) and Liu et al. (2012). Due to
Navier–Stokes) techniques with additional modules for mod-         our previous experience with a limited validation of surface
elling of various atmospheric processes (e.g. interaction of       temperatures simulated by the PALM model (Resler et al.,

Geosci. Model Dev., 14, 4797–4842, 2021                                            https://doi.org/10.5194/gmd-14-4797-2021
J. Resler et al.: PALM model validation in a real urban environment                                                          4799

2017), the aim of this study was to design a comprehensive         2.1     Study area
experiment for model validation, including air velocity, air
pollution, and surface temperature analysis. The focus on the      The study area is located in the north-west centre of Prague,
collection of detailed temporally and spatially localized ob-      the capital city of the Czech Republic. The position and a
servations in various urban canopy and meteorological con-         map of this area are presented in Fig. S1 in the Supple-
ditions was dictated by the intention to use these observations    ment. This figure also marks the extent of the PALM mod-
to assess the performance of the newly developed or updated        elling domains; for more information about model domain
PALM modules: RTM, BSM, LSM, PCM, and CHEM. This                   set-up, see Sect. 3.1. The study area includes complex ter-
focus of the study also complied with its additional purpose,      rain that is mainly located in the western part of the outer
which was assessment of the utility of the PALM model per-         domain (further referred as the parent domain), with an alti-
formance for detailed urban studies (Geletič et al., 2021).       tude ranging from 175 to 346 m above sea level. The altitude
   These considerations influenced the selection of the study      variability in the inner domain (further referred as the child
area. The Dejvice quarter is an urbanized area typical of oth-     domain) is up to 30 m (see Fig. S2). The observations were
ers in Prague and similar central European cities with various     located inside the child domain (blue square in Fig. S2). This
types of urban environment. Further, the realization of the        is a densely built-up area with specific conditions created
street-level observation campaign was technically and orga-        by the roundabout (Vítězné náměstí) in combination with
nizationally easier in this area than in areas such as the his-    west–east-oriented (Evropská–Čs. armády) and north–south-
torical centre of Prague. Moreover, this area represents one       oriented (Jugoslávských partyzánů–Svatovítská) boulevards.
of the pilot areas for urban adaptations studies carried out in    The eastern and southern parts of the child domain repre-
cooperation with the Prague municipality and their organi-         sent a typical historical residential area in Dejvice, Prague,
zations (e.g. Prague Institute of Urban Planning and Devel-        with a combination of old and new buildings and a va-
opment). Their interest in the results of this study and their     riety of other urban components, such as gardens, parks,
plans for subsequent modelling studies of urban heat island        and parking places. The north-west quarter is home to the
and air quality adaptation and mitigation strategies for this      larger buildings of the Czech Technical University campus.
quarter also influenced our selection of this area.                The south-western and north-eastern parts of the domain are
   Section 2 gives a detailed overview of the observation          more sparsely built-up by family houses. Location-specific
campaign, followed by a description and an evaluation of the       features include green intra-blocks with gardens and trees,
numerical set-up in Sects. 3 and 4. In Sect. 5 results from the    usually with pervious ground surfaces; Prague historic cen-
numerical experiment and the observation campaign are pre-         tre usually has impervious intra-blocks. The building heights
sented and compared. Finally, Sect. 6 closes with a summary,       alongside the streets range from approximately 20 to 30 m,
outlines the current limitations of the model, and gives ideas     with the highest building in the domain being 60 m. Both
for future improvements.                                           boulevards are approximately 40 m wide and contain little
                                                                   green vegetation, except for Jugoslávských partyzánů Street
                                                                   which has some broadleaf trees that are about 20 m high. The
2   Observation campaign                                           majority of the trees are located in the intra-blocks and parks.
                                                                   The land cover map of the study area, based on the Urban At-
The observation campaign was designed with two main aims:
                                                                   las 2012 geodatabase, is shown in Fig. S3.
(1) to evaluate PALM’s capability, with its newly developed
or improved thermal capability from the radiative transfer
                                                                   2.2     Validation episodes and synoptic situation
model (RTM), land and building surface modules (LSM and
BSM respectively), and plant-canopy model (PCM), to re-
                                                                   2.2.1    Summer campaign
produce surface temperatures; (2) to evaluate its capability to
reproduce pollutant concentrations and meteorological quan-
                                                                   The summer observation campaign ran for 2 weeks from
tities in different types of street canyons, with special focus
                                                                   10 to 23 July 2018 (see Table S2 in the Supplement), from
on the impact of trees located in streets on both types of quan-
                                                                   which two shorter episodes were selected for model simu-
tities. The campaign was carried out in a warm part of the
                                                                   lations: 14–16 July (e1) and 19–23 July (e2). Synoptically,
year (10–23 July 2018 – further referred to as the summer
                                                                   for most of the summer campaign, the weather was influ-
campaign) and a cold part of the year (23 November–10 De-
                                                                   enced by a high-pressure ridge over central Europe between
cember 2018 – further referred to as the winter campaign).
                                                                   an Icelandic low and an eastern European low-pressure sys-
Measurement locations are shown in Fig. 1, and the measure-
                                                                   tem. Daily maximum temperature as measured at the Praha-
ments themselves are described in Sect. 2.3.1–2.3.5. More
                                                                   Karlov (WMO ID 11519) station was below 30 ◦ C for the
details on the campaign are available in ČHMÚ (2020).
                                                                   entire period, with the exception of 21 July when the max-
                                                                   imum temperature reached 31.2 ◦ C. The beginning of the
                                                                   period was partially cloudy, mostly with altostratus clouds
                                                                   which formed in the morning and early afternoon on 19 July.

https://doi.org/10.5194/gmd-14-4797-2021                                                Geosci. Model Dev., 14, 4797–4842, 2021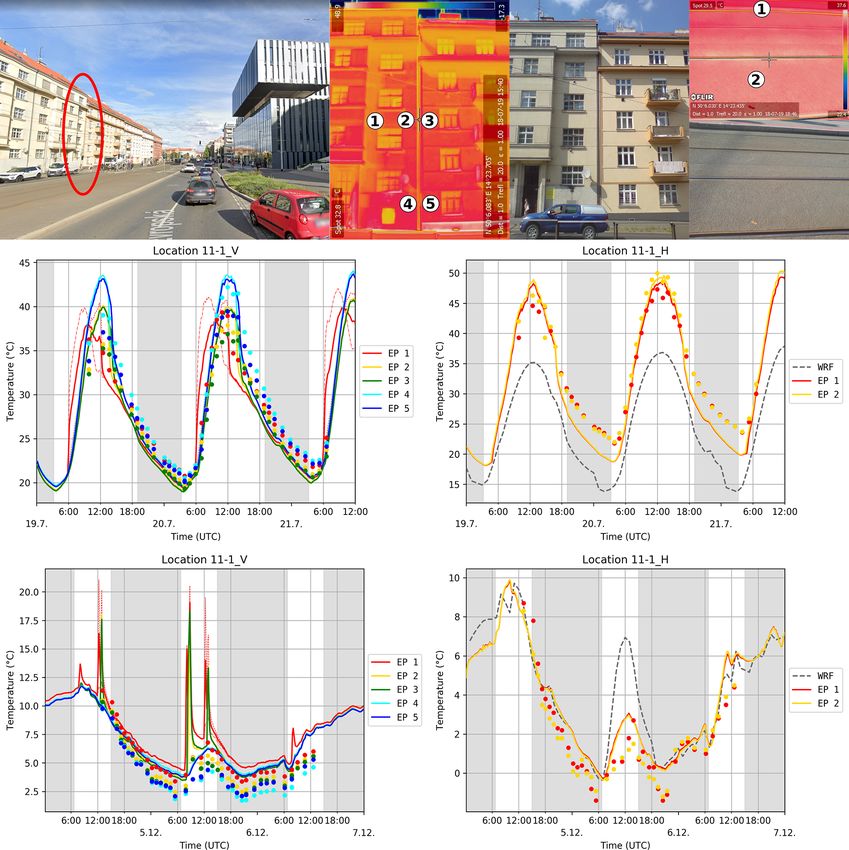
4800                                                 J. Resler et al.: PALM model validation in a real urban environment

Figure 1. Map of measurement locations. Orthophoto was provided by the Web Map Service (WMS) of the Czech Office for Surveying,
Mapping and Cadastre (ČÚZK, 2020). For more information about the point location (longitude, latitude etc.), see Table S1.

The period between the afternoon of 19 July and late after-       tion). Average daily temperatures ranged from −4 ◦ C on
noon on 21 July was mostly clear with cirrus clouds. The end      29 November to 9 ◦ C on 3 December. Average daily wind
of the campaign was cloudy, mostly with low-level cumulus.        speed was around 3 m s−1 , except for 26 November when it
The mid-episode (19 July 2018) solar parameters were as fol-      reached 4.4 m s−1 and 4–6 December with daily values of
lows: sunrise at 03:13 UTC, sunset at 19:02 UTC, and solar        4.8, 6.0 and 5.7 m s−1 . The diurnal solar radiation parameters
noon at 11:08 UTC.                                                in Prague on 1 December 2018 were as follows: sunrise at
                                                                  06:39 UTC, sunset at 15:02 UTC, solar noon at 10:51 UTC.
2.2.2   Winter campaign
                                                                  2.3     Observed quantities and equipment used
The winter part of the observation campaign lasted from
24 November to 10 December 2018 (see Table S3 in the              2.3.1    Infrared camera measurements
Supplement), and for the purposes of model validation,
three episodes were selected: 24–26 November (e1), 27–            Surface temperature measurements by an infrared (IR) cam-
29 November (e2), and 4–6 December (e3). Weather was in-          era were carried out during 2 d (45 h total) of the sum-
fluenced by a typical late-autumn synoptical situation with       mer and 3 d (50 h total) of the winter campaigns (see Ta-
westerly flow and low-pressure systems as well as a series of     bles S2 and S3). Measurements were taken at 12 loca-
fronts separated by two anticyclonic events (27–29 Novem-         tions shown in Fig. 1 approximately every 60–80 min. At
ber and 5 December). During the campaign, several occluded        each location, several directions were chosen, and usu-
frontal passages were recorded in Prague: 24 and 30 Novem-        ally two snapshots capturing horizontal (ground) and ver-
ber, and 2, 3, 4 and 6 December, with rainfall on 30 Novem-       tical (wall) surfaces were taken in each direction. We use
ber (4.3 mm at Praha-Ruzyně station; WMO ID 11518) and           the following nomenclature hereafter: -
2 and 3 December (9.8 and 3.6 mm at Praha-Ryzyně sta-            _H/V. For example 02-1_H means im-

Geosci. Model Dev., 14, 4797–4842, 2021                                            https://doi.org/10.5194/gmd-14-4797-2021
J. Resler et al.: PALM model validation in a real urban environment                                                           4801

age of the ground taken from the second location in the first     flux plates and two pairs of thermocouples (TCs). The op-
direction. In every image, a few evaluation points (EPs) la-      erating temperature range of the HFP01 plates and TCs is
belled by numbers were chosen, and temperature time series        −30 to +70 ◦ C. The declared sensitivity of temperature dif-
were extracted. The particular point at which modelled and        ference measurements between the inner and outer sides of
observed values are compared is then referred to, for exam-       the wall is 0.02 ◦ C, and the heat flux measurement resolu-
ple, as 02-1_H3. In total, the observation campaign gathered      tion is 0.02 W m−2 . The calibration uncertainty of HFP01
time series of surface temperature for 66 ground and 73 wall      plates is ±3 % (Hukseflux, 2020). Heat fluxes were mea-
EPs, representing various surface types, in order to evalu-       sured through the north-east-facing wall of Sinkule house
ate model performance under different surface parameter set-      and through the north-facing wall and window of the build-
tings such as different surface materials and conditions.         ing in Zelená Street (Fig. 2). The position of the sensors on
   Temperature was measured by the FLIR SC660 (FLIR,              both buildings is shown in Fig. S6. Silicone glue was used
2008) – the same camera used in Resler et al. (2017). As          to attach the sensors to the outside wall on the first floor of
in this article, the camera’s thermal sensor field of view is     Sinkule house during the winter campaign. Otherwise, sen-
24◦ × 18◦ and the spatial resolution (given as an instanta-       sors were mounted using two-sided carpet tape.
neous field of view) is 0.65 mrad. The spectral range of the         Sinkule house was built before World War II, and its walls
camera is 7.5 to 13.0 µm, and the declared thermal sensitivity    are made of construction blocks. The ground floor wall is
at 30 ◦ C is 45 mK. The measurement accuracy for an object        34 cm thick without insulation, and the facade is made of ce-
with a temperature between 5 and 120 ◦ C given an ambient         ramic tiles. The wall of the first floor is 41 cm thick, including
air temperature between 9 and 35 ◦ C is ±1 ◦ C, or ±1 % of the    6 cm thick polystyrene insulation on the outer side. The fa-
reading. The camera offers a built-in emissivity-correction       cade surface is scratched plaster with scratches of 1–2 mm
option, which was not used for this study. Apart from the in-     depth (see Fig. 2).
frared pictures, the camera allowed us to simultaneously take        The house in Zelená Street is a typical representative of
pictures in the visible spectrum.                                 buildings in the area, with walls that are also made of con-
   Where possible, pictures were processed semi-                  struction blocks. The wall thickness at the measurement lo-
automatically as described in Resler et al. (2017). This          cation was approx. 30 cm with 2.5 cm lime-cement plaster on
processing requires the presence of four well-defined             the inner and outer sides of the wall. Heat flux measurement
points in each picture, which are used to correct for             through the window was not used in PALM validation and,
changes in camera positioning between measurements as             therefore, is not described here.
the camera was rotated around locations. Pictures that did           A quality check measurement was done at the beginning of
not allow for semi-automatic processing (mostly ground            the summer campaign – sensors were placed side-by-side on
images) were handled manually, and temperatures were              the first floor of Sinkule house between 19 July, 17:40 CEST,
extracted by the FLIR Tools v5.13.18031.2002 software             and 20 July, 12:00 CEST. The absolute difference of the fa-
(https://www.flir.eu/products/flir-tools/, last access: 28 June   cade surface temperature was 0.0–1.5 ◦ C with a median value
2021). Examples of semi-automatic and manually processed          of 0.1 ◦ C. The absolute difference of measured heat fluxes
images are shown in Fig. S4.                                      was 0.0–2.1 W m−2 with a median value of 0.6 W m−2 .
   Surface temperature measured by the FLIR SC660 was
compared with the data from heat flux measurements at             2.3.3   Vehicle observations
Sinkule house captured by the heat flux measuring sys-
tem TRSYS01 (see Sect. 2.3.2). The results are shown in           Air quality and meteorological measurements in the street
Fig. S5. The IR camera generally gives higher values than         canyons were obtained by two monitoring vehicles, which
the TRSYS01 system (instantaneous measurements are com-           were shuttled periodically among the three locations marked
pared with 10 min averages): in summer, ground floor tem-         using green squares in Fig. 1. One location was in Ju-
peratures are on average 1 ◦ C higher (difference range 0.0–      goslávských partyzánů Street (Jug. p. Street), an approx.
2.8 ◦ C), and first floor temperatures are on average 0.1 ◦ C     42 m wide boulevard with sparse trees. The two remaining
higher (range of differences between −2.0 and +1.3 ◦ C); in       locations were in the 25 m wide Terronská Street, one next
winter, the ground floor temperatures are on average 2.1 ◦ C      to Bubeneč house and the other next to Orlík house. Near
higher (difference range 0.5–3.5 ◦ C), and first floor temper-    Bubeneč house, there are full-grown broadleaf trees with
atures are on average 1 ◦ C higher (range of differences be-      crowns covering the whole street. Broadleaf trees near Or-
tween −0.6 and +2.0 ◦ C).                                         lík house are smaller and their crowns cover a maximum of
                                                                  two-thirds of the street canyon. Buildings at all locations are
2.3.2   Wall heat flux measurements                               approx. 25 m high. Pictures of the measurement locations
                                                                  are shown in Fig. S7. The observations were organized so
Heat fluxes through the building facade and windows were          as to provide information about air quality and meteorologi-
measured by the high-accuracy building thermal resistance         cal conditions at the three locations and also to compare the
measuring system TRSYS01 equipped with two HFP01 heat             eastern and western sides of the street canyons. Each mon-

https://doi.org/10.5194/gmd-14-4797-2021                                             Geosci. Model Dev., 14, 4797–4842, 2021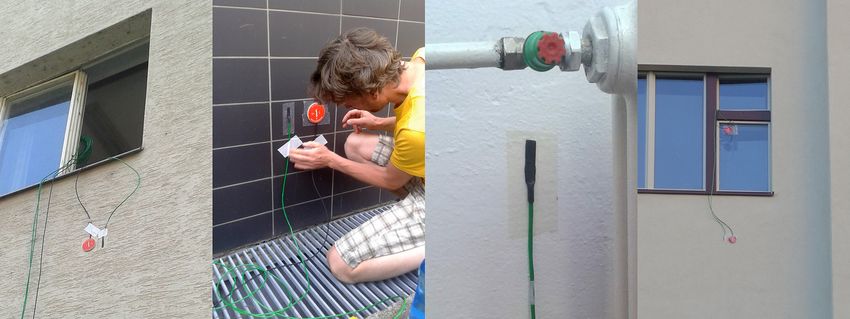
4802                                                       J. Resler et al.: PALM model validation in a real urban environment

Figure 2. Details of heat flux sensor and thermocouple mounting. The left panel shows the first floor of Sinkule house, the centre-left panel
shows the ground floor of Sinkule house, the centre-right panel shows the inner temperature sensor on the ground floor of Sinkule house, and
the right panel shows Zelená Street. For the Sinkule house and Zelená Street locations, see Fig. 1.

itoring vehicle remained at a particular location for at least           used for detailed time disaggregation of traffic emissions at
2 whole days (see Tables S2 and S3). Based on our own                    the measurement location and for calibration of an automatic
traffic census from 4–6 December 2018, the total workday                 counting system (see Sect. 3.4).
load on Terronská Street past Bubeneč house is 7700 vehi-                  The vehicle in Sinkule house courtyard measured the same
cles, which is approximately 44 % of the traffic intensity in            variables with the same time resolution except for the fol-
Jug. p. Street The number of small trucks (60) in Terronská              lowing differences: PM1 , PM2.5 , and turbulence characteris-
Street is only 20 % of that in Jug. p. Street, and the number of         tics were not measured; wind speed and direction were mea-
buses (20) is only 2 % of the number in Jug. p. Street. There            sured by the GILL 2D WindSonic anemometer at the stan-
was only one large truck per day noted in Terronská Street,              dard height of 10 m.
compared with approx. 80 in Jug. p. Street. Apart from the
street canyon measurements, one stationary monitoring vehi-              2.3.4   Mobile measurements
cle was located in the courtyard of Sinkule house throughout
the whole campaign to provide the urban background mete-                 On selected days of the measurement campaigns, to get
orological and air quality values.                                       more detailed information on air quality in the child domain,
   The vehicles in the street canyons were equipped with                 mobile measurements using a dedicated monitoring vehicle
analysers of NOx , NO2 , NO, O3 , SO2 , CO, PM10 , PM2.5 ,               were made (12, 18, 19 July, 26 November, and 4 Decem-
and PM1 measured at the top of the vehicle roof (approx.                 ber). This vehicle travelled between the locations shown in
4.6 m). Calibrations of all air quality analysers were per-              Fig. 1, stopping and measuring at each of them for 5 min.
formed during transfer between locations to eliminate loss               Two loops were made on every measurement day. On 19 July,
of data during parallel measurements. Meteorological vari-               only one loop among locations 3, 6, and 15–17 was made,
ables measured included wind speed and direction, as well                with measurements taken over 15–20 min. The vehicle was
as turbulent flow characteristics measured by the METEK 3D               equipped with NOx , NO2 , NO, O3 , SO2 , CO, PM10 , PM2.5 ,
ultrasonic anemometer on a meteorological mast at a height               and PM1 analysers. Starting from the second measurement
of about 6.8 m above the ground (to fit under the tree crowns            on 17 July, a GARNI 835 weather station was used for an in-
in Terronská Street next to Bubeneč house). In addition to              dicative measurement of temperature, wind, and relative hu-
the above-mentioned variables, air temperature, relative hu-             midity. Some measurements were not available on particular
midity, global radiation, and atmospheric pressure were mea-             days – details are given in Tables S2 and S3.
sured at the top of the vehicle roof (approx. 4.6 m). Wind
and turbulent flow characteristics measured by the METEK                 2.3.5   Higher-level observations
anemometer had a 10 min resolution, while the remaining
variables were recorded at 1 min resolution. For further anal-           To get information about higher levels, the observation cam-
ysis and PALM evaluation, 10 min averages of measured                    paign used two other measurement platforms. The first was a
variables were used. Both vehicles also had a video camera               stationary measurement of wind flow on the top of the high-
placed at the front windscreen. These recordings were then               est building in the child domain (approx. 60 m high). A 2D
                                                                         anemometer was installed on the flat roof of the Faculty of

Geosci. Model Dev., 14, 4797–4842, 2021                                                    https://doi.org/10.5194/gmd-14-4797-2021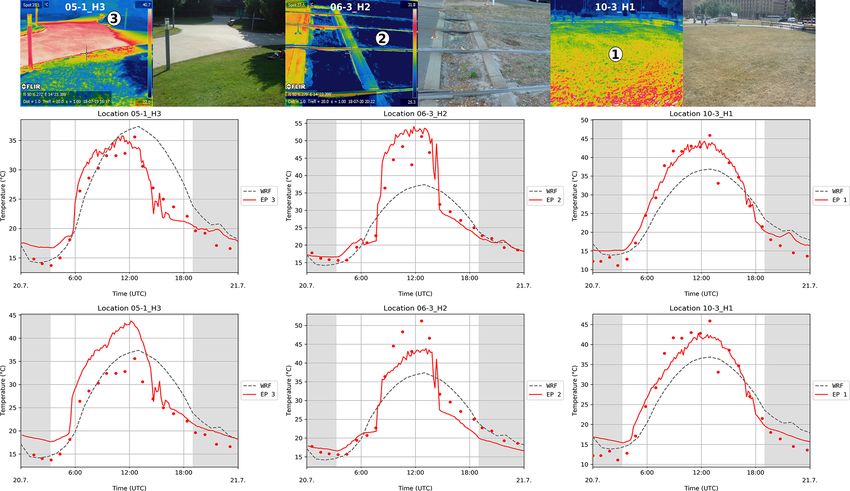
J. Resler et al.: PALM model validation in a real urban environment                                                             4803

Civil Engineering of the Czech Technical University – (FSv;              wind speed and, in conjunction with the campaign wind mea-
see Fig. 1). The anemometer was positioned approximately                 surements on the FSv building roof, the modification of wind
in the middle of the highest roof section, 2 m above the flat            speed by the orography and buildings and how PALM cap-
roof top. The location was the same in the summer and win-               tures this effect.
ter campaigns. Measurement frequency was 1 s, and 10 min
averages were used for further evaluation. The second was
a measurement of vertical profiles in the lowest part of the             3     Model simulation set-up
atmosphere by drone. Originally, two 1 d drone observation
campaigns were scheduled. Due to administrative restric-                 3.1    PALM model and domains configuration
tions, the summer drone observations were not realized and
the winter ones had to be moved from the centre of the child             The PALM model system version 6.0 revision 4508
domain to the location marked in Fig. 1. Additionally, the               (Maronga et al., 2015, 2020) was utilized for this valida-
maximum flight altitude had to be limited to 80 m above the              tion study. It consists of the PALM model core and compo-
ground. The drone was equipped with the GRIMM portable                   nents that have been specifically developed for modelling ur-
laser aerosol spectrometer and Dust Monitor Model 1.108                  ban environments. The PALM model core solves the incom-
and a HC2A-S probe from ROTRONIC for temperature and                     pressible, filtered, Boussinesq-approximated Navier–Stokes
relative humidity measurements (ROTRONIC, 2020). Unfor-                  equations for wind (u, v, w) and scalar quantities (poten-
tunately, the probe showed a longer than expected relaxation             tial temperature, water vapour mixing ratio, passive scalar)
time which meant that the observation instruments were not               on a staggered Cartesian grid. The sub-grid-scale terms that
able to stabilize quickly enough during the descent. Recalcu-            arise from filtering are parameterized using a 1.5-order clo-
lation of particle counts to mass concentration was also bur-            sure by Deardorff (1980) with modifications following Mo-
dened with large errors. The results obtained were not reli-             eng and Wyngaard (1988) and Saiki et al. (2000). Buildings
able enough to be used for PALM validation, but temperature              and orography are mapped onto the Cartesian grid using the
and relative humidity profiles are provided in the Supplement            mask method (Briscolini and Santangelo, 1989), where a grid
(Figs. S8, S9).                                                          cell is either 100% fluid or 100% obstacle. The advection
                                                                         terms are discretized by a fifth-order scheme after Wicker
2.3.6   Standard CHMI observations used for validation                   and Skamarock (2002). For temporal discretization, a third-
                                                                         order low-storage Runge–Kutta scheme (Williamson, 1980)
Relevant standard CHMI1 meteorological and air quality                   is applied. The Poisson equation is solved by using a multi-
measurements were used for the evaluation of WRF (Weather                grid scheme (Maronga et al., 2015).
Research and Forecasting) and CAMx (Comprehensive Air-                      The following are the urban-canopy-related PALM mod-
quality Model with Extensions) simulations which provided                ules employed in this study. The land surface model (LSM,
initial and boundary conditions for PALM, as described in                Gehrke et al., 2020) was utilized to solve the energy bal-
Sect. 3.3. This evaluation is presented in Sect. 4. WRF ver-             ance over pavements, natural surfaces, and water bodies.
tical profiles were evaluated against the upper air sound-               The building surface model (BSM, called USM in previous
ings from Praha-Libuš (WMO ID 11520) station located in                  versions and in Resler et al., 2017) was used to solve the
a southern suburb of Prague, 11 km from the centre of the                energy balance of building surfaces (walls and roofs). The
PALM child domain. A radiosonde is released every day at                 BSM was configured to utilize an integrated support for mod-
00:00, 06:00, and 12:00 UTC. For the evaluation of global ra-            elling of fractional surfaces (Maronga et al., 2020). Dynamic
diation, two meteorological stations were selected: (1) Praha-           and thermodynamic processes caused by resolved trees and
Libuš and (2) the Praha-Karlov (WMO ID 11519) station sit-               shrubs were managed by the embedded plant-canopy model
uated in a densely built-up area nearer the centre of Prague             (PCM). Radiation interaction between resolved-scale vege-
approximately 4 km from the PALM child domain. PM10 and                  tation, land surface, and building surfaces was modelled via
NOx concentrations from the CAMx model were compared                     the radiative transfer model (RTM; Krč et al., 2021). Down-
with measurements from automated air quality monitoring                  welling shortwave (SW) and longwave (LW) radiation from
stations. Only the five background stations closest to the               the upper parts of the atmosphere, which were used as bound-
PALM child domain were used. Station locations are shown                 ary conditions for the RTM, were explicitly prescribed from
in Fig. S10. More detailed information about the stations is             the stand-alone Weather Research and Forecasting model
given in Tables S4 and S5.                                               (WRF; see Sect. 3.3 for details) simulation output for the
   Observations from the Praha-Ruzyně station (WMO ID                   respective days, rather than being modelled by, for exam-
11518) situated at Prague airport approximately 9 km west                ple, the Rapid Radiation Transfer Model for Global Mod-
of the centre of PALM domain were used to evaluate WRF                   els (RRTMG). This way, effects of mid- and high-altitude
   1 Czech Hydrometeorological Institute (https://chmi.cz, last ac-      clouds on the radiation balance were considered in the sim-
cess: 26 July 2021) is the official national meteorological service in   ulations. It is important to note that by not using RRTMG
the Czech Republic.                                                      some physical processes were missed, such as vertical diver-

https://doi.org/10.5194/gmd-14-4797-2021                                                   Geosci. Model Dev., 14, 4797–4842, 2021
4804                                                   J. Resler et al.: PALM model validation in a real urban environment

gence of radiation fluxes leading to heating/cooling of the       for winter simulations respectively. This extent safely covers
air column itself; these may become especially important at       the convective layer with a sufficient buffer. We note that the
night-time. However, sensitivity tests with RRTMG applied         10 m resolution of the parent domain is sufficient to explicitly
revealed that the effect on night-time air temperature was        resolve the majority of the buildings and trees (see Figs. S11
negligible in our simulations. In addition to the meteorolog-     and S12 in the Supplement); thus, no additional parameteri-
ical quantities, the embedded online chemistry model (Khan        zation of the urban canopy is needed. The child domain ex-
et al., 2021) was applied to model concentrations of NOx ,        tent is 1440 × 1440 × 242 m3 in the x, y, and z directions
PM10 , and PM2.5 . Chemical reactions were omitted in this        respectively, with an isotropic grid spacing of 2 m.
case to simulate purely passive transport of the pollutants.         Parent and child domains were initialized by vertical pro-
   Both self-nesting and online nesting features of PALM          files of u, v, w, potential temperature and mixing ratio, and
were utilized. Self-nesting means that a domain with a finer      soil moisture and soil temperature, transformed from WRF
resolution can be defined inside a larger domain, and this sub-   simulations (see Sect. 3.3). As the initial soil and wall tem-
domain (child domain) receives its boundary conditions from       peratures from a mesoscale model are only a rough estimate
the coarse-resolution parent domain at every model time           due to its aggregated nature, the PALM spin-up mechanism
step. Here, a one-way nesting without any feedback from           was applied (Maronga et al., 2020). During a 2 d spin-up,
the child simulation on the parent simulation (Hellsten et al.,   the atmospheric code was switched off and only the LSM
2021) was applied. The coarse-resolution parent simulation        and BSM as well as the radiation and RTM model were exe-
itself received its initial as well as lateral and top bound-     cuted. Using this method, the material temperatures were al-
ary conditions from the simulations of the WRF mesoscale          ready close to their equilibrium value and significant changes
model transformed to a PALM dynamic driver (see Sect. 3.3).       in material temperatures at the beginning of the simulation
This process is hereafter referred to as mesoscale nesting        were avoided.
(Kadasch et al., 2020). The values of the velocity compo-
nents, potential temperature, and values for the mixing ratio     3.2   Urban canopy properties
at the lateral and top boundary were updated at every model
time step, while linear interpolation in time was used to in-     Data availability, their harmonization, and cost/efficiency
terpolate between two WRF time steps. The WRF solution            trade-offs often need to be considered (Masson et al., 2020).
was mapped fully onto the boundaries starting at the first grid   For solving the energy-balance equations as well as for radi-
point above the surface; boundary grid points that lie below      ation interactions, BSM, LSM, and RTM require the use of
the surface were masked and were not considered further. As       detailed and precise input parameters describing the surface
the mesoscale model does not resolve turbulence, turbulence       materials such as albedo, emissivity, roughness length, ther-
was triggered at the model boundaries using an embedded           mal conductivity, thermal capacity, and capacity and ther-
synthetic turbulence generator (STG) according to Xie and         mal conductivity of the skin layer. Also the plant canopy
Castro (2008), which imposed spatially and temporally cor-        (trees and shrubs) is important, as it affects the flow dy-
related perturbations every time step onto the velocity com-      namics, heating, and evapotranspiration as well as radiative
ponents at the lateral boundaries. For additional details on      transfer within the urban environment. Urban and land sur-
PALM’s mesoscale nesting approach, we refer to Kadasch et         faces and subsurface materials become very heterogeneous
al., 2020.                                                        in a real urban environment when going to very fine spa-
   The initial and boundary concentrations of modelled pol-       tial resolution. Any bulk parameterization for the whole do-
lutants of the parent domain were taken from simulations of       main setting would, therefore, be inadequate. Instead, a de-
the CAMx model (Comprehensive Air-quality Model with              tailed setting of these parameters was supplied wherever pos-
Extensions; see Sect. 3.3). For more detailed information         sible. To obtain the needed detailed data, a supplemental on-
about the PALM model, embedded modules, and the PALM-             site data collection campaign was carried out and a detailed
4U components, see Maronga et al. (2020) and the associated       database of geospatial data was created. Land cover data are
papers in this special issue.                                     based on a combination of national (ZABAGED) and city
   The locations of the parent and child modelling domains        of Prague (Prague OpenData) databases. ZABAGED geo-
are shown in Fig. S1. The parent domain extends horizon-          database (ČÚZK, 2020) distinguishes 128 categories of well-
tally by 4 km×4 km in the x and y directions respectively,        targeted geographical objects and fields – for example, built-
with an isotropic grid spacing of 10 m. The vertical z direc-     up areas, communications, hydrology, vegetation, and sur-
tion is covered by 162 layers for summer and 82 layers for        face. The Prague OpenData geodatabase (Prague Geoportal,
winter simulations respectively. The vertical grid spacing is     2020) distinguishes many local, user-specified geographic in-
10 m for the lower 250 m of the domain. Above 250 m, when         formation system (GIS) layers – for example, plans show-
the height was well above the building-affected layer, the ver-   ing actual and future development, land cover for architects,
tical grid was successively stretched up to a maximum ver-        and a photogrammetry-based digital elevation model (DEM).
tical grid spacing of 20 m in order to save computational re-     Building heights were available from the Prague 3D model,
sources. The domain top is at 2930 m for summer and 1330 m        maintained by the Prague Institute of Planning and Devel-

Geosci. Model Dev., 14, 4797–4842, 2021                                           https://doi.org/10.5194/gmd-14-4797-2021
J. Resler et al.: PALM model validation in a real urban environment                                                          4805

opment. For the first tree canopy data mapping, lidar scan-        al., 2008) have been used in all simulations. Urban vs. non-
ning was used in combination with a photogrammetric-based          urban parameterizations for PBL were tested and, as a re-
DEM. Derived heights were manually calibrated using data           sult, the Yonsei University PBL scheme (Hong et al., 2006)
from the terrain mapping campaign and extended with ad-            was chosen for the summer episodes, whereas the Boulac
ditional parameters like crown height, width and shape, and        urban PBL (Bougeault and Lacarrère, 1989) gave a better
trunk height and width. All descriptions of surfaces and ma-       agreement with observations for the winter episodes. With
terials and their properties were collected in GIS formats and     this exception, no other urban parameterizations have been
then preprocessed into a PALM NetCDF input file corre-             used in the WRF model. MODIS land use categories have not
sponding to the PALM Input Data Standard (PIDS; Heldens            been altered. WRF was initialized from the Global Forecast
et al., 2020). This file includes information on wall, ground,     System (GFS) operational analyses and forecasts, and output
and roof materials as well as properties similar to those used     data from overlapping WRF 12 h runs was collected. The first
to estimate surface and material properties in Resler et al.       6 h of each run served as a spin-up. The boundary conditions
(2017) and Belda et al. (2021).                                    for the mesoscale nesting were then generated from forecast
   Each surface is described by material category, albedo, and     horizons 7–12.
emissivity. BSM surfaces additionally carry thickness and             Air quality simulations that served as chemical initial
window fraction. Parameters such as thermal conductivity           and boundary conditions were made using the chemistry
and capacity are assigned to categories and estimated based        transport model (CTM) CAMx version 6.50 (ENVIRON,
on surface and storage material composition. In the case of        2018). CAMx is an Eulerian photochemical CTM that con-
walls and roofs, which are limited to four layers in the current   tains multiple gas-phase chemistry options (CB5, CB6,
version of BSM, this means that the parameters of the two          SAPRC07TC). Here, the CB5 scheme (Yarwood et al., 2005)
outer layers were assigned according to the properties of the      was invoked. Particle matter was treated using a static two-
covering material (e.g. plaster or insulation), while remain-      mode approach. Dry deposition was calculated following
ing layers were initialized by the properties of the wall ma-      Zhang et al. (2003), and the Seinfeld and Pandis (1998)
terial (e.g. bricks, construction blocks, concrete, insulation).   method was used for wet deposition. To calculate the com-
Wall and roof properties are described in Table S6. For pave-      position and phase state of the ammonia–sulfate–nitrate–
ments and other LSM surfaces, all parameters except albedo         chloride–sodium–water inorganic aerosol system in equilib-
and emissivity were assigned according to the PALM LSM             rium with gas-phase precursors, the ISORROPIA thermody-
categories.                                                        namic equilibrium model was used (Nenes et al., 1998). Fi-
   Each tree in the child domain was detailed by its position,     nally, secondary organic aerosol (SOA) chemistry was solved
diameter, trunk parameters, and vertically stratified base leaf    using the secondary organic aerosol partitioning (SOAP)
area density. The actual distribution of the leaf area density     semi-volatile equilibrium scheme (Strader et al., 1999).
(LAD) within the treetop was then calculated according to             CAMx was coupled offline to WRF, meaning that CAMx
the available light exposure of the particular grid box inside     ran on WRF meteorological outputs. WRF outputs were
the treetop following the Beer–Lambert law, leading to lower       translated to CAMx input fields using the WRFCAMx pre-
LAD in the centres of large and/or dense treetops. At the mo-      processor provided along with the CAMx source code (see
ment, PALM does not consider the effect of trunks on the           https://www.camx.com/download/support-software, last ac-
dynamic flow field and the thermodynamics; only LAD is             cess: 28 June 2021). For those CAMx input variables that
considered. However, for the winter case, leafless deciduous       were not available directly in WRF output, diagnostic meth-
trees were considered to be 10 % of their summer LAD to ac-        ods were applied. One of the most important inputs for
count for the effect of trunks and branches on the flow field.     CAMx, which drives the vertical transport of pollutants, is
                                                                   the coefficient of vertical turbulent diffusion (Kv). Kv is a
3.3   Initial and boundary conditions                              significant parameter that determines the city-scale air pol-
                                                                   lution, and it is substantially perturbed by the urban canopy
Initial and boundary meteorological conditions for the par-        effects (Huszar et al., 2018a, b, 2020a, b). Here, the “CMAQ”
ent domain of the PALM simulations were obtained from              scheme (Byun, 1999) was applied for Kv calculations.
the WRF model (Skamarock et al., 2008), version 4.0.3. The            WRF and CAMx outputs were then post-processed into
WRF model was run on three nested domains, with hori-              the PALM dynamic and chemistry driver. The data were
zontal resolutions of 9, 3, and 1 km and 49 vertical levels.       transformed between coordinate systems and a horizon-
The child domain has 84 × 84 grid points in the horizon-           tal and vertical interpolation was applied. As the coarse-
tal. The choice of configuration started from the most usual       resolution model terrain would not match the PALM model
settings for the given resolution and required latitude. Mi-       terrain exactly, the vertical interpolation method included ter-
nor variations in parameterizations were then tested so as to      rain matching, and the atmospheric column above the terrain
provide the best possible boundary conditions to PALM for          was gradually stretched following the WRF hybrid vertical
each simulation. Consequently the Noah land surface model          levels as they were converted to the fixed vertical coordinates
(Chen and Dudhia, 2001) and RRTMG radiation (Iacono et             of the PALM model. The interpolated airflow was adjusted to

https://doi.org/10.5194/gmd-14-4797-2021                                             Geosci. Model Dev., 14, 4797–4842, 2021
4806                                                  J. Resler et al.: PALM model validation in a real urban environment

enforce mass conservation. A detailed technical description
of the 3D data conversion procedure is given in the Supple-
ment in Sect. S6. The Python code used for processing the
WRF and CAMx data into the PALM dynamic driver file
has been included in the official PALM distribution and pub-
lished in the PALM SVN repository since revision 4766 in
the directory trunk/UTIL/WRF_interface.
   Emission data for Prague used in the CAMx model were
as described in the following section. Other emission inputs
are described in detail in Ďoubalová et al. (2020).

3.4    Emission data

Air pollution sources for our particular case are dominated
by the local road traffic. Annual emissions totals were based
on the traffic census 2016 conducted by the Technical Ad-
ministration of Roads of the City of Prague – Department
of Transportation Engineering (TSK-ÚDI). The emissions
themselves were prepared by ATEM (Studio of ecological           Figure 3. Nitrogen oxides (NOx ) emitted by cars along their tra-
models; http://www.atem.cz, last access: 28 June 2021) using     jectories in selected locations in Dejvice, Prague. Emissions were
the road transport emission model MEFA 13. Jugoslávských         summarized in grams per day per square metre (g d−1 m−2 ) and
partyzánů and Terronská streets, where air quality was mea-     disaggregated to 1 h time steps. The red and blue squares in the top
sured during the campaigns, were both covered by this cen-       left map indicate the extent of the parent and child PALM domains
sus. Emissions from streets not included in the census were      respectively. The orange and green rectangles show the locations of
available on a grid with a 500 m spatial resolution. These       the expanded views given in the right and lower left panels. The ex-
emissions were distributed between the streets not covered       panded views show the air quality measurement locations (MV) in
by the census according to their parameters. Particulate mat-    Terronská Street – Bubeneč house (lower left) and Jugoslávských
ter (PM) emissions included resuspension of dust from the        partyzánů Street (right) using green squares. The base map of the
                                                                 Czech Republic at 1 : 10 000 for the city of Prague was provided
road surface (Fig. 3). Time disaggregation was calculated us-
                                                                 by the Czech Office for Surveying, Mapping and Cadastre (ČÚZK,
ing a Prague transportation yearbook (TSK-ÚDI, 2018), pub-       2020).
lic bus timetables, and our own census conducted over a short
time period (19–21 July and 4–6 December; days on which
traffic intensities were derived from camera records). This      use it for heating only (Novák et al., 2019; OTE, 2020). Daily
time disaggregation was the same for the primary emissions       variation of residential heating emissions was taken from
(e.g. exhaust, brake wear) as well as for resuspended dust.      Builtjes et al. (2003).
Higher dust resuspension caused by sprinkle material during        All of these input emission data were processed into
winter time was not considered.                                  PALM input NetCDF files corresponding to the PALM In-
   Traffic data were supplemented by emissions from station-     put Data Standard (PIDS).
ary sources from the Czech national inventory REZZO. Point
sources correspond to the year 2017, the latest year available   3.5   Observation operator
at the time of model input preparation. Residential heating
was based on a 2017 inventory and rescaled to 2018 by mul-       To compare modelled and observed values, an observation
tiplying by the ratio of degree days DD(2018)/DD(2017);          operator that links model variables to observed quantities is
DD is the sum of the differences between the reference in-       needed. For vehicle measurements, the situation was straight-
door temperature and the average daily outdoor temperature       forward: horizontally, we used atmospheric quantities and
on heating days. Residential heating emissions were avail-       chemical compounds at the grid cell closest to the real place-
able on elemental dwelling units – urban areas with average      ment of the sensors, whereas vertically, we performed lin-
area 0.5 km2 – and were spatially distributed to building ad-    ear interpolation to the real height of the sensor. This ap-
dresses, where local heating sources are registered, in pro-     proach was sufficient given the fine 2 m resolution within the
portion to the number of flats. Time disaggregation of point     child domain. For surface observations at grid-aligned sur-
source emissions was based on monthly, day-of-week, and          faces (wall sections without significant influence of step-like
hour-of-day factors (Builtjes et al., 2003; available also in    structures), the modelled values at the nearest grid face ac-
Denier van der Gon et al., 2011). Residential heating emis-      cording to the actual placement of the sensor or EP were also
sions were allocated to days according to the standardized       taken. However, at non-grid-aligned walls (i.e. walls that are
load profile of natural gas supply for the households, which     oriented in one of the south-west, south-east, north-west, and

Geosci. Model Dev., 14, 4797–4842, 2021                                            https://doi.org/10.5194/gmd-14-4797-2021
J. Resler et al.: PALM model validation in a real urban environment 4807
4.1 Meteorology
4.1.1 Evaluation of the driving synoptic-scale
simulation
As the boundary conditions for the PALM simulations come
from a model simulation as well, we need to check for
potential misrepresentation of the real atmospheric condi-
tions. First, we assess the overall performance of the WRF
model simulation on the synoptic scale by comparing the
results with the known state of the atmosphere, represented
here by the ERA-Interim reanalysis and atmospheric sound-
Figure 4. Sketch to illustrate the mapping of a wall surface obser- ings obtained by the CHMI radiosondes (downloaded from
vation point to a gridded step-wise approximation of the wall. The the University of Wyoming database; http://weather.uwyo.
red line represents the real wall surface, light grey lines delineate edu/upperair/sounding.html, last access: 28 June 2021). Fig-
the grid cells, the light red area shows the footprint of the gridded
ures S13 and S14 show maps of geopotential height at 500
building, the blue circle shows the surface evaluation point, and the
and 850 hPa comparing the results of the WRF simulation
blue arrows represent the assignment of this point to the grid faces
(blue lines) used for the calculation of the corresponding modelled (9 km domain) with the ERA-Interim reanalysis. Generally,
values. the WRF simulations, driven by the Global Forecast Sys-
tem (GFS), correspond well to the ERA-Interim reanalysis
in terms of the 500 hPa geopotential height field, with some
north-east directions), walls are approximated by step-like shifts of the pressure field eastward on 19 July and north-
structures, and choosing the nearest grid face is no longer ward on 21 July. Geopotential height at 850 hPa is also very
unique, as illustrated in Fig. 4. In these cases, the orienta- well represented with some added detail, mainly during the
tion of the real wall cannot be sufficiently represented by one day in the summer due to a better resolved topography in the
grid face but is approximated by grid faces with perpendicu- higher-resolution regional model simulation.
lar orientation. For this reason, we virtually sampled surface Additionally, we compared the WRF results with atmo-
quantities at the two perpendicular surfaces and calculated spheric soundings for the station closest to our domain of in-
the modelling counterpart of the observation as the average terest, Praha-Libuš, which is about 11 km south-southeast of
of these values. In the graphs of the surface temperature, the the modelled area. Figures 5 and 6 show observed and mod-
sampled values are plotted by thin dashed lines in addition to elled profiles of the potential temperature and wind speed at
their average representing the modelled value which is shown the sounding location for 20–21 July (summer e2 episode)
by thick solid lines. Implications of this for the model eval- and 4–5 December (winter e3 episode) respectively. Graphs
uation as well as for the comparability of the model to the for other episodes are provided in the Supplement (Figs. S15,
observations are discussed in Sect. 5.1.7, along with the grid S16, and S17). The radiosonde measurements are taken three
discretization. times per day at 00:00, 06:00, and 12:00 UTC. The modelled
values are inferred from the 1 km resolution WRF model. In
order to estimate spatial variability and, consequently, the
4 Evaluation of model simulation set-up utility of the sounding for validation of the WRF profiles
within the PALM domain, WRF profiles for the centre of the
To ensure the correct model couple set-up and correspon-
PALM domain are also shown. Modelled profiles from the
dence to general meteorological conditions, basic character-
PALM parent domain simulation are also included in these
istics are evaluated in this section. This includes the evalu-
graphs; these are discussed in Sect. 4.1.2 below.
ation of the driving synoptic-scale simulations of the WRF
WRF profiles of potential temperature generally corre-
and CAMx models, the vertical representation of the bound-
spond well with the observations with some notable excep-
ary layer in PALM, and the spatial development of the tur-
tions near the surface, where WRF tends to underestimate
bulent flow characteristics from the boundaries of the PALM
night-time stability and shows less marked near-surface in-
parent and child domains. Special focus is put on the summer
stability during daytime in the summer case. However, here
e2 and winter e3 episodes, in which IR camera observations
we emphasize that the near-surface profiles might also be af-
took place. A description of the statistical methods used is
fected by the fact that the relevant WRF model surface is
given in the Appendix A.
not necessarily representative of local detail. The WRF wind-
speed profiles also mainly reflect the conditions as observed,
with a well-modelled night-time low-level jet (e.g. 21 July at
00:00 UTC, 5 December at 06:00 UTC). However, compared
with potential temperature, modelled wind speed exhibits
https://doi.org/10.5194/gmd-14-4797-2021 Geosci. Model Dev., 14, 4797–4842, 2021You can also read