Use of Dispersants in Oil Spill Response and Emerging Application Technologies - Kenneth Lee
←
→
Page content transcription
If your browser does not render page correctly, please read the page content below

Use of Dispersants in Oil Spill Response and
Emerging Application Technologies
Kenneth Lee

The Purpose of Oil Spill Response
• Prevention is always better than responding
• The purpose of any oil spill response method is to
  reduce the damage (ecological and socio-economic)
  that would be caused by the oil spill
• Most damage is done when spilled oil drifts into
  shallow water or comes ashore – i.e., sites where the
  most oil-sensitive resources typically exist

What are Chemical Dispersants?
Dispersants are liquid solutions of detergent-like surfactants dissolved or
suspended in solvent
The surfactants have two ends: one attracted to oil (lipophilic) and another
attracted to water (hydrophilic)

                                      Water-compatible (Hydrophilic)
                                      Oil-compatible (Lipophilic)

The solvent enables the surfactants (active ingredients) to be applied and helps
get them through the oil film to the water interface
At the interface the surfactants reduce the surface tension allowing the oil to
enter the water as tiny droplets which are degraded by natural bacteria
Activity of Chemical Dispersants
                                                                                 Dispersant (surfactant)

                    Oil                                                                          Hydrophilic

Dispersant sprayed onto oil slick                                                                Hydrophobic

                                                                                                   Surfactant-stabilized
                                                                                                   oil droplet (micelles)

      Surfactant locates at interface

Surfactant reduces the oil-water interfacial tension by orienting the interaction of hydrophilic groups with the water phase
and the hydrophobic groups with oil

Oil slick broken into droplets                                              The droplets dispersed by turbulence
by mixing energy                                                            leaving low oil concentrations
Reduced oil-water interfacial tension facilitates the formation of a large number of small oil droplets that can be entrained
in the water column
The Basis for Chemical Oil Dispersant Use

   • Based on the concept of
     transferring oil from the sea
     surface into the water column, as
     small oil droplets

   • These are diluted by natural
     processes to concentrations below
     toxicity threshold limits

   • Dispersed oil droplets are
     degraded more rapidly by natural
     bacteria

Presentation title | Presenter name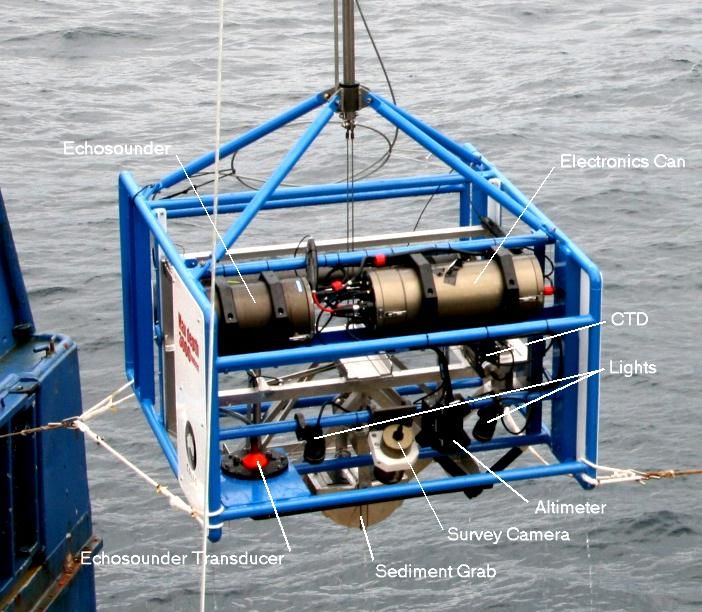
Recent Research Priorities

Concerns about dispersant use at sea include
  • Dispersant effectiveness in rough or calm
    seas
  • Biological effects of dispersed oils

National Research Council Committee in 2005 identified two factors
to be addressed:
 • Energy dissipation rate (turbulence/sea state)
 • Particle size distribution and mass balance
DFO /US EPA Wave Tank
   Tidal current simulation by vertical manifolds along the sides of the tank
   Reproducible waves of known energy dissipation rate, including breaking
   waves, at precise locations along length of tank
   Experimental protocols and instrumentation to monitor dispersed oil in the
   water column

                                                                           LISST

Presentation title | Presenter name
Dispersion of spilled oil

• Dispersion is the conversion of spilled oil on the sea
  surface into very small oil droplets that stay in the water
  column and are diluted to very low concentration
• Dispersion is a natural process caused by waves
• Natural dispersion occurs, but slows and stops due to
  changes in the physical nature of spilled oil from natural
  “weathering processes”.

Oil Droplet Size Distribution
- Dispersant + Dispersant
1.0 0.5
t = 1 min t = 1 min
0.5 0.0
t = 10 min
0.0 1.0
Particle Concentration (l/L)
t = 10 min
Particle Concentration (l/L)
0.5 0.5
0.0 0.0
t = 30 min t = 30 min
0.5 0.5
0.0 0.0
t = 60 min t = 60 min
0.5 0.5
0.0 0.0
10 100 10 100
Mean Diameter (m) Mean Diameter (m)
Dispersant Activity
         t = 0 ms                        t = 14 ms                      t = 28                          t = 38 ms
                                                                        ms

                                                                           5 mm

          t = 40 ms                      t = 42 ms                      t = 46 ms                      t = 48 ms

Extracted images from cinematic digital holography of turbulent break-up of crude oil mixed with dispersants into micro-
droplets. Gopalan, B. and J. Katz (2010) Physical Review Letters 104, 054501
Small Oil Droplets Rise Slower than Large Oil Droplets
Oil + Dispersant Oil
1sec
5sec
10secWhy Chemical Dispersants?
• There is no single response technique that is suitable for all circumstances
• The goal is to design a response strategy based on Net Environmental Benefit
Analysis
• Oil spill responses:
• Monitor and evaluate
• Booming and skimming
• In-situ burning
• Bioremediation
• Chemical dispersion
• At open sea, dispersant use attracts most attention due to restrictions to other methods
Presentation title | Presenter nameSpill Conditions Limit Response Options
Wave Height
(feet)
18
Natural Degradation and Dispersion
14
10
Mechanical
Recovery
6
Sea State Dispersant
Conditions Application
4
In-Situ
Burning
2
0.5
0.25
10 -2 10 -1 Millimeters 1 10
Courtesy of Al Allen
Average Oil ThicknessEncounter Rate is Key to Offshore Response Courtesy of Ocean Imaging
Why use Dispersants?
Advantages
 • Safety benefit
 • Rapid response over large areas
 • Application in relatively rough weather
 • May break / inhibit formation of emulsions
 • Reduces the risk of inshore water/shoreline impacts

Disadvantages
 • Redistribution of pollution
 • Effects on pelagic organisms in the upper water column
 • Increases in bioavailability of the oil
 • Time window for effective use
 • Monitoring arrangements / protocols
 • Required resources – boats, planes, support staff
Will dispersants work ?
• Higher viscosity oils are more difficult to disperse

• Most crude oils have a “window of opportunity”

• Oil will disperse more rapidly in rougher seas

• Application methods influence effectiveness

                                                         Sea state

                                             Oil properties    Dispersant
Dispersion and dilution of oil
• Wave action produces and submerges oil droplets
• Larger oil droplets recoalesce quickly to reform oil slicks
• Dispersed oil droplets will be rapidly diluted by physical
processes in the ocean (e.g., waves and currents)
• They do not sink
• Stay in top 10 to 20 metres – the “well-mixed” zone
• The concentration of dispersed oil in the water will:
• Initially increase as oil is dispersed, and then
• Decrease as the dispersed oil is dilutedGulf of Mexico Oil Spill Deepwater Horizon MC-252 oil spill - largest accidental marine oil spill in the history of the petroleum industry • April 20, 2010 - explosion on the Deepwater Horizon drilling rig killed 11 platform workers and injured 17 others • July 15, 2010 - leak was stopped by capping the wellhead which had released 4.9 million barrels of crude oil • September 19, 2010 - federal government declared the well "effectively dead“ after successful completion of the relief well
DWH Oil Spill Peak Statistics
• 4.9 million bbls of oil discharged
• 1.8 million gallons of dispersants used
• 411 in-situ burns conducted (265,450 bbls of oil burned)
• 48,200 responders
• 9,700 vessels
• 127 surveillance aircraft
• 3.8 million ft of hard
  boom deployed
• 9.7 million ft of soft
  boom deployed
Gulf of Mexico – May 24, 2010
Application of Oil Dispersants
• Based on discharge rates - final estimate of 53,000 barrels per day (8,400
  m3/d) - each day the Gulf of Mexico Oil Spill would be considered a major
  incident

• In addition to mechanical recovery techniques (skimming and booming)
  and in situ burning, oil dispersants were used to prevent landfall of the oil
  in the Deepwater Horizon Spill

• Beginning in early May responders began injecting dispersants at the
  source of the release (~1500m depth) to reduce oil from reaching the
  surface
• Advantages of subsurface injection:
  – Reduced VOCs (volatile organic compounds)
  – Reduced Oil Emulsification
  – Volume of dispersant needed
Dispersant Application on the Sea Surface
• Dispersant was applied from vessels by spraying when VOC levels near the
  source site reached unacceptable levels, enabling work to continue on the
  drilling and containment rigs/vessels
Cumulative Dispersant Use

* 4,200,000 L of dispersant added by subsurface injection
Subsurface Injection of Dispersants
Plume Monitoring and Assessment for
Subsurface Dispersant Application
(US EPA Directive – May 10, 2010)

PART 1: “Proof of Concept” to determine if
subsurface injection is chemically dispersing the oil

PART 2: Sampling to detect and delineate the
dispersed plume
Dispersant Monitoring and Assessment for Subsurface Dispersant Application US EPA and USCG directives required BP to implement a monitoring and assessment plan for subsurface and surface use of dispersants Shutdown Criteria – Significant reduction in dissolved oxygen (< 2 mg/L) – Rotifer acute toxicity tests Later addenda to implement USGS SMART Tier 3 Monitoring Program Droplet size distribution (LISST) CTD instrument equipped with CDOM fluorometer Discreet sample collection to measure fluorometry * Aim to eliminate surface application altogether with subsea dispersant addition limited to < 15,000 gpd
Joint Analysis Group (JAG)
Surface and Subsurface Oceanographic, Oil, and Dispersant Data

Working group of scientists from EPA, NOAA, OSTP, BP and DFO
Analyze an evolving database of sub-surface oceanographic data
by BP, NOAA, and academic scientists

Near term actions:
• Integrate the data
• Analyze the data
• Describe the distribution of oil
• Understand oceanographic processes affecting its transport
• Issue periodic reports
Vertical Profile - DO2 Depression

                                                               Concentration (ul/l)
                                             0.0   0.1   0.2     0.3     0.4       0.5    0.6    0.7     0.8

                                      -100

                                                                               Particles (2.5 ~ 60 um)
                                      -300

                                      -500

                         Depth (m)
                                      -700

                                      -900

                                     -1100

                                     -1300

                                     -1500

                           Small particles (2.5 - 60µm) were indicative of
                           oil droplets in the subsurface plume
Abstract Size distribution of oil droplets formed in deep water oil and gas blowouts have strong impact on the fate of the oil in the environment. However, very limited data on droplet distributions from subsurface releases exist. The objective of this study has been to establish a laboratory facility to study droplet size versus release conditions (rates and nozzle diameters), oil properties and injection of dispersants (injection techniques and dispersant types). This paper presents this facility (6 m high, 3 m wide, containing 40 m3 of sea water) and introductory data. Injection of dispersant lowers the interfacial tension between oil and water and cause a significant reduction in droplet size. Most of this data show a good fit to existing Weber scaling equations. Some interesting deviations due to dispersant treatment are further analyzed and used to develop modified algorithms for predicting droplet sizes in a second paper (Johansen et al., 2013). © 2013 Elsevier Ltd. All rights reserved. Presentation title | Presenter name
Sub-surface
Oil Profiles
Oil Chemistry Results
                                   All Depths
           Number of Samples Analyzed           Summary of Samples >LOD (ppm)
           Total      LOD         Min         Max       Median
 BTEX      2743     2350 (86%)     393 (14%)   0.000144     0.4849      0.0121
 PAHs      2307     1734 (75%)     573 (25%)    0.00002    10075.341   0.000188
nAlkanes   2304     2091 (91%)     213 (9%)     0.0005     23101.904    0.00068

                                 Bottom (>700m)
           Number of Samples Analyzed           Summary of Samples >LOD (ppm)
           Total      LOD         Min         Max       Median
 BTEX      1478     1164 (79%)     314 (21%)    0.00052     0.4849     0.027165
 PAHs      1219     995 (82%)      224 (18%)    0.00002     0.0272     0.0001997
nAlkanes   1219     1104 (91%)     115 (9%)     0.0005      0.1357      0.00066
Analysis of Near-field Oil Droplet Data (JAG Analysis) • Within 15 km of the well and below 1000 m oil droplet concentrations (< 65 microns) were fully consistent with neutrally buoyant plume • The plume was filamentous, a significant fraction of the bottle casts missed it and thus exhibited little or no oil in droplet form. Significant non-zero sample results, assumed to be within the filaments, showed total droplet volumes in the 10 ppm range with a max observed value of 16 ppm • Observed values dropped off by an order of magnitude within 10 km. If we use this as a rough scaling distance for the mixing and dilution of the oil droplet filaments or plume then we would expect to have total droplet concentrations reduced to the ppb level within about 40 km • Although this is a rough estimate it is consistent with the bulk of the available observations and by the time the droplets get 40 kilometers away numerous other physical and biological processes will start to alter the state and composition of the plume
Fate of
 the Oil:
 GOM Spill
Response estimates
expressed as %
cumulative volume of
oil discharged in the
best, expected, and
worst cases

Oil Budget Calculator
October 2010
NOAA (National Oceanic
and Atmospheric
Administration)

Other: Remaining oil is at the
surface as light sheen or weathered
tar balls, biodegraded, or already
came ashore
CSIRO Development of Equipment and Sensors
to Monitor Dispersant Use
Rationale for Dispersant Monitoring
To establish efficacy and potential impact of dispersant use in area
of application
  • Monitor spatial extent spread of dispersed oils
  • Provide data to address potential fate and effect issues
Operational drivers
  • Did the dispersant work?
  • Do I need further applications?
  • Is the dispersal model correct?

Scientific drivers
  • How did the oil get dispersed in to the water?
  • What were the concentrations in the subsurface dispersed oil?
  • What was the fate of the dispersant and oil?
Current guidance
on monitoring
from oil spill
hand book
Surface water monitoring technologies
CSIRO hydrocarbon sensor array system
                                         Internal
   WS = Water sample                                           S   = Sensor
   GPS = Global positioning system                  GPS
                                                                      Water
                                                                      Data

                        S1 S2    S3 S4
                       Tank 1
                                                          liquid-liquid
                                                                          GCMS
                                                    WS     extraction
   In water    Wet deck
        Underway system                                     Discrete samples
                                          waste

  S1 – S3 Fluorometers (PAHs), S4 membrane metal oxide sensor (VOCs)
  S1 239/360 nm, S2 & S3 254/360 nm
Field Monitoring.. Containerised analytical laboratories Presentation title | Presenter name | Page 40
Data integration
Ship-board database
logging and interpretation
Sensor data

Observations

                               Reports
  Samples

                                 Data
                             transmission
 Echosound

                               Sample
  Remote                       tracking
  sensing
CSIRO Monitoring Technologies: GOM
Corexit 9500 compounds
2‐Butoxyethanol
Dipropylene Glycol n‐Butyl Ether (DPnB)
Propylene Glycol
Dioctylsulfosuccinate (DOSS)
Oil chemistry samples
PIANO, PAH, TPH
© SBE S.M. Mudge et al. 2010
Other measurements
Dissolved Oxygen (SBE 43)
Fluorescence (Various CDOM, HC)
Turbidity (Transmissometers)
© Chelsea Technologies Group L
Particle sizing (LSST)
See JAG and OSAT reportsWater column and seabed monitoring • CSIRO Benthic Optical Acoustic and Grab Sampler system Integrated system for sediment sampling
CSIRO deepwater survey capability
                                 • specialised deepwater sampling
                                   capability
                                 • data management
                                 •Highly capable research platform

   RV Southern
   RV Investigator (89m) (67m)
                Surveyor
You can also read


