US Self-Storage Sales Volume & Buying Trends - February 2021 - Marshall ...
←
→
Page content transcription
If your browser does not render page correctly, please read the page content below
US Self-Storage Sales Volume &
Buying Trends – February 2021
    COVID-19 surfaced in the United States in Mid-March 2020. Federal, state and local governments
    responded by issuing strict stay-at-home orders and closing nonessential business. Trends in retail sales,
    vacancy rates, rent collection rates, and unemployment underscore the crippling effects of COVID-19 on
    American consumers and businesses alike. The United States Daily New Case table below highlights the
    progression of daily case counts relative to legislation imposed by state and local governments. A new
    high in case counts led to the implementation of the mask mandate in April 2020. Effective social distancing
    and mask mandates helped curb case counts over spring and summer 2020, and restrictions loosened.
    Colder weather and an increase in indoor gatherings around the holidays sent case counts surging again
    in the late fall and winter, shattering the previous high set in April 2020. Unemployment spiked over the
    period, reaching its highest levels in July. The unemployment rate decreased over the following five months
    before a slight increase in January 2021. Attention now turns to the rollout of the COVID vaccine and its
    effects on consumer sentiment and underlying market performance.

    With COVID on the forefront,
    fundamentals in many major
    markets      have    been   greatly
    altered.      This     publication
    analyzes sales trends in terms of
    number of transactions and
    dollar volume for self-storage
    properties     throughout       the
    United States.

         Empire State Building, 350 Fifth Avenue, Suite 4320, New York, NY 10118   212.425.4300   marshall-stevens.com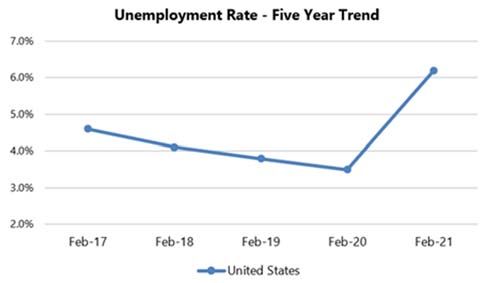
Number of Sales Transactions
Parameters: All self-storage sales in the United States, segmented by price tranche.
Stable transaction volume from January 2019 to March 2020.
April 2020- initial COVID shockwaves grip market, number of transactions slowly declined.
Uptick in transaction volume from May 2020 to August 2020 coincides with the demand for storage.
October 2020 – December 2020- experienced an upward trend in number of transactions.
December 2020- 44 total transactions- the highest number of transactions since March.
January 2021- 43 total transactions, 2.3% decrease from the prior month.
February 2021 – continues the downward trend with 28 total transactions, reflecting a 34.9% decrease.
The self-storage sales market has been one of the asset types least affected by the post-COVID era, however, data reflects
fluctuating trends with slightly lower levels of activity than normal. Transaction volume has continued to fluctuate, with the
past two months experiencing normal activity levels, as seen in the chart above.
Empire State Building, 350 Fifth Avenue, Suite 4320, New York, NY 10118 212.425.4300 marshall-stevens.comDollar Volume of Sales Transactions
In 2019, the average monthly sales volume was approximately $236 million. Comparatively, the average monthly sales volume in 2020 was
roughly $152 million, reflecting a decrease of approximately 35.4%. We tracked the dollar volume of monthly sales by tranche as seen below.
Average sales volume from January 2019 to March 2020 was $225,613,333.
Average sales volume from April 2020 to February 2021 was $141,272,727.
May 2020 had the lowest dollar volume over the 25-month period, reflecting $84,600,000.
Sales in “$10.0 million to $20.0 million” tranche is the largest contributor to US self-storage’s total dollar volume, representing a
31.7% stake in the market.
December 2020 dollar volume significantly increased from the prior month, reflecting a 59.5% increase in total dollar volume.
January 2021 reflected a decline of 47.9% in total dollar volume, as shown in the figure below.
February 2021 reflected a minor decline of 0.4% in total dollar volume from the prior month.
Empire State Building, 350 Fifth Avenue, Suite 4320, New York, NY 10118 212.425.4300 marshall-stevens.comAverage $/SF on Monthly Transaction
According to the graphic on the left, the average price per square
foot has fluctuated from $72 to $125 per square foot from January
2019 through December 2020. After experiencing an upward
trend in pricing from April 2020 to June 2020, the average dollar
per square foot experienced a decline in both July 2020 and
August 2020. Since then, the average dollar per square foot has
fluctuated, with a noticeable increase in February 2021 reflecting
the highest price per square foot ($150/SF) over the analysis
period.
Average Cap Rate of Monthly Transaction
The average capitalization rate for US self-storage transactions
has experienced fluctuations over the given period, with the most
recent month showing a slight decrease from the prior month.
Generally, cap rates for self-storage assets have remained within
a range of 6.5% to 8.7% over the study period, which reflects
relative stability. With an average cap rate of 7.5% over the study
period, the results of February 2021 at an average cap rate of 6.9%
are encouraging.
Average $/SF & Cap Rate: Quarterly Trend
Q4 2020 experienced the highest $/SF and lowest cap rate over
the quarterly study period. This is indicative of positive investor
sentiment for this segment. This segment has been somewhat
insulated to the effects of COVID-19 in that is a property type that
does not rely on high foot-traffic or large crowds to spur income.
Tenants in self-storage facilities do not frequently visit their unit,
and when they do visit, they can remain socially distanced with
ease. The market will be watching this asset class closely, as it
appears to be an asset class that is performing well despite the
ongoing Coronavirus pandemic.
SOURCE: CoStar and Marshall & Stevens
Patrick T. Craig, MAI, MRICS Catherine Gu Mike Gies
Executive Managing Director Senior Director Analyst
Real Estate Valuation Practice Real Estate Valuation Practice Real Estate Valuation Practice
212.897.9481 646.438.7602 609.613.2468
ptcraig@marshall-stevens.com cgu@marshall-stevens.com mgies@marshall-stevens.com
Empire State Building, 350 Fifth Avenue, Suite 4320, New York, NY 10118 212.425.4300 marshall-stevens.comYou can also read


