UNIVERSAL LOGISTICS HOLDINGS, INC - SUMMER 2021 - Universal Logistics ...
←
→
Page content transcription
If your browser does not render page correctly, please read the page content below
UNIVERSAL LOGISTICS
HOLDINGS, INC.

                      SUMMER 2021
DISCLAIMER

                                          CAUTIONARY STATEMENT REGARDING FORWARD-LOOKING STATEMENTS
  This presentation and any other written or oral statements made by us or on our behalf to analysts, investors, the media, and others may include
  forward-looking statements as defined in the Private Securities Litigation Reform Act of 1995. The terms “Universal,” the “Company,” “we,” “us” and
  “our” mean collectively Universal Logistics Holdings, Inc., a Michigan corporation, together with its subsidiaries when or where appropriate. The
  words “future,” “anticipates,” “assumes,” “intends,” “plans,” “seeks,” “believes,” “predicts,” “potential,” “objectives,” “estimates,” “expects,”
  “targets,” “projects,” “outlook,” “forecast,” “would,” “will,” “may,” “might,” “could,” “should,” “can,” and similar terms and expressions often signify
  forward-looking statements. Forward-looking statements are not based on historical information, but rather are related to future operations,
  strategies, financial results, or other developments. Forward-looking statements are based on management’s current expectations as well as certain
  assumptions and estimates made by, and information available to, management at the time the statements are made. Those statements are based on
  general assumptions and are subject to various risks, and because they also relate to the future, they are likewise subject to inherent uncertainties
  and other factors that may cause actual results to differ materially from the views, beliefs, and projections expressed in such statements. Therefore,
  we caution you against relying on any of these forward-looking statements. You should not place undue reliance on any forward-looking statements,
  which speak only as of the date made. Factors or events that could cause our actual results to differ may emerge from time to time, and it is not
  possible to predict all of them. We assume no obligation to update or revise any forward-looking statements that are made from time to time, either
  as a result of future developments, new information, or otherwise, except as may be required by law. See also our reports filed with the Securities
  and Exchange Commission. This presentation is the property of Universal, and any redistribution in any form without the express written consent of
  Universal is strictly prohibited.

PEOPLE DRIVEN SOLUTIONS                                                                                                                                2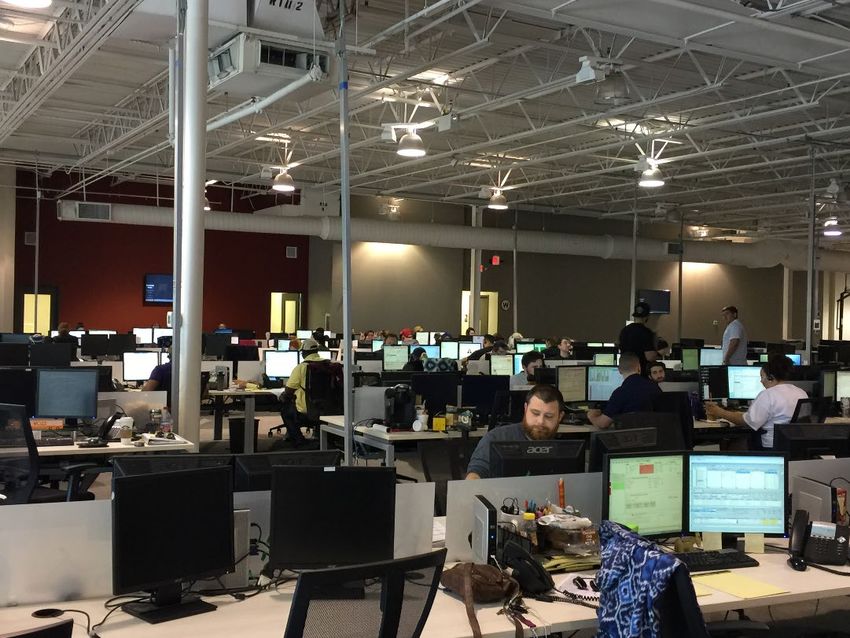
ABOUT US
BUSINESS OVERVIEW
Highlights

      •   Suite of transportation and logistics solutions         Warren, MI
                                                                 Headquarters
      •   Diversified, complementary service offerings           Nasdaq: ULH

      •   Variable cost model protects margin
                                                                  $670 million
      •   Focused on sales growth and managing costs              Market Cap

      •   Favorable long-term outlook across service lines

                                                                 4,200+ Tractor
                                                                    Fleet Size

                                                             9,150 Direct Employees
                                                                    and FTE's

                                                                   60 Active
                                                             Value-Added Programs

PEOPLE DRIVEN SOLUTIONS                                                               4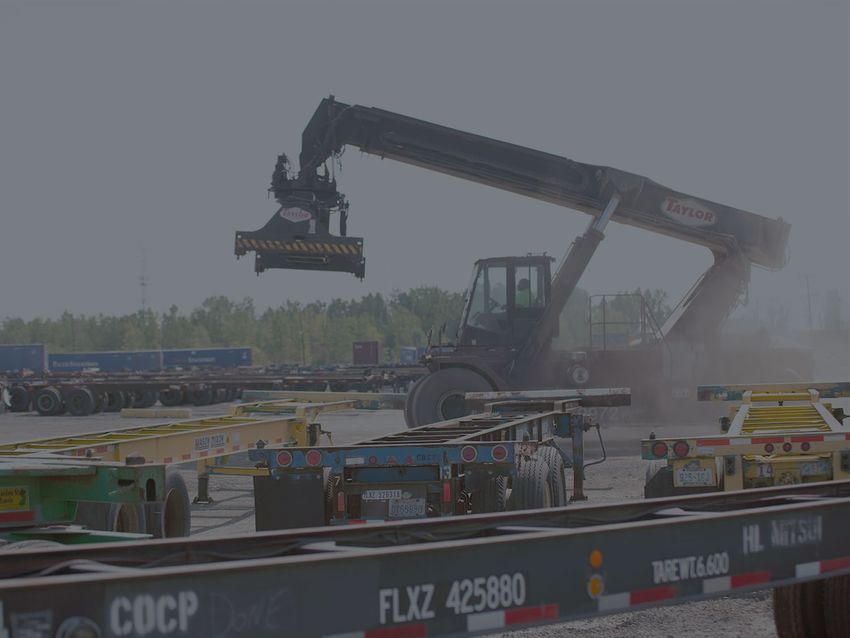
OUR HISTORY

        1981                                  2005                             2015 - 2016
                                                                             Corporate Streamline
                                                                                                    Six Strategic
       Universal            Strategic     Initial Public   LINC & Westport    Universal Logistics
                                                                                                     Intermodal
       Founded             Acquisitions      Offering        Acquisitions          Holdings
                                                                                                    Acquisitions
                                                                               (NASDAQ: ULH)

                          1981 - 2005                      2012 - 2013                              2018 - 2019

PEOPLE DRIVEN SOLUTIONS                                                                                             5
SEGMENTS
SEGMENTS

             CONTRACT LOGISTICS
                                                                                                                                                               COMPANY-
   VALUE-ADDED                             DEDICATED                          INTERMODAL                                 TRUCKING                              MANAGED
                                                                                                                                                              BROKERAGE
    Sequencing and sub-               Dedicated transportation             Drayage                                 Truckload transportation               Company-Managed
                                      Uses a mix of owner-operated and     Transports containerized cargo over     Uses a mix of owner-operated and       brokerage
    assembly                          company owned equipment for          short distances                         company owned equipment to
    Provides storage, pre-assembly                                                                                                                        Uses a nationwide network of
                                      committed capacity and close-loop                                            haul commodities in various end        broker carriers to fulfill the
    and rapid delivery of parts
                                      transportation                                                               markets. Services include dry van,     transportation capacity
                                                                           Storage                                 flatbed, heavy haul, refrigerated,
                                                                           Provides container, chassis and                                                requirements of customers
    Material handling and             Expedited transportation             trailer storage near port or railhead
                                                                                                                   and specialized equipment
    consolidation                     Provides expedited direct shipment   locations                                                                      Forwarding
    Coordinates receipt, unloading,   services using owner- operators                                              Specialized truckload                  Arranges and manages shipments of
    sorting and out-bound delivery                                                                                 Provides transportation services
                                                                           Maintenance & repair                                                           goods via ground, air and sea
    to specified destinations                                                                                      of customer goods which is over-
                                      Yard management                      Performs repair and preventative        weight, over-size, and a variety of
                                      Provides switching and inventory     maintenance on all types of             other specialty characteristics        Customs house brokerage
    Central materials area            management of customer trailers      intermodal equipment                                                           Provides expertise in customs &
                                      and containers
    operations                                                                                                     Truckload brokerage                    tariffs and offers the preparation of
    Operates facilities that store                                                                                                                        import/export documents
                                                                                                                   Agent-based brokerage and
    customers’ bulk orders until                                                                                   brokerage at company terminals
    transported to assembly plants                                                                                 to provide capacity for freight that
                                                                                                                   cannot be serviced by our tractors
    Kitting and repacking
    Provides multiple parts in one
    “kit” for a single assembly
    operation and repackaging of
    vendor supplied parts

    Returnable container
    management
    Manages the collection and
    return of customers’ containers
    following delivery

PEOPLE DRIVEN SOLUTIONS                                                                                                                                                                           7
CONTRACT LOGISTICS - VALUE-ADDED
  - Customized customer solutions: in-
    plant or offsite using proprietary
    technology

  - 5 – 10 year contracts with high
    renewal rate; 60 active programs

  - 5,574 full-time equivalents

  - Long-tenured customer base
        -   Retail & consumer goods
        -   Automotive
        -   Class 8
        -   Aerospace

  - Target revenue: $400-$430 million
                                         Business strategy
  - Target margins: 10% - 12%            Own the plant: Supporting inbound
                                         manufacturing for the OEM by providing
                                         multiple logistics services at the plants
                                         where we operate.

PEOPLE DRIVEN SOLUTIONS                                                              11
CONTRACT LOGISTICS - DEDICATED

   - Asset-based model

   - Custom tailored service offerings
     in the U.S. and Canada

   - Multi-year contracts

   - Serving industrial markets

   - 900 total tractors

   - Target revenue: $175-$200 million
                                         Business strategy
   - Target margins: 10% - 12%           Own the plant: Supporting inbound
                                         manufacturing for the OEM by providing
                                         multiple logistics services at the plants where
                                         we operate.

PEOPLE DRIVEN SOLUTIONS                                                               12
INTERMODAL
- Asset-right variable cost model
- Local and regional drayage
- 45+ terminals, 12 full service container
yards and 2,042 total tractors
- Diversified customer base
- BCO’s
- Steamship lines
- Railroads
- Target revenue: $450-$500 million
Business strategy
- Target margins: 10% - 12% Operate a national drayage network
supporting BCO’s, steamship lines, and
railroads by offering depot, trucking, and
maintenance repair services in the markets
where we operate.
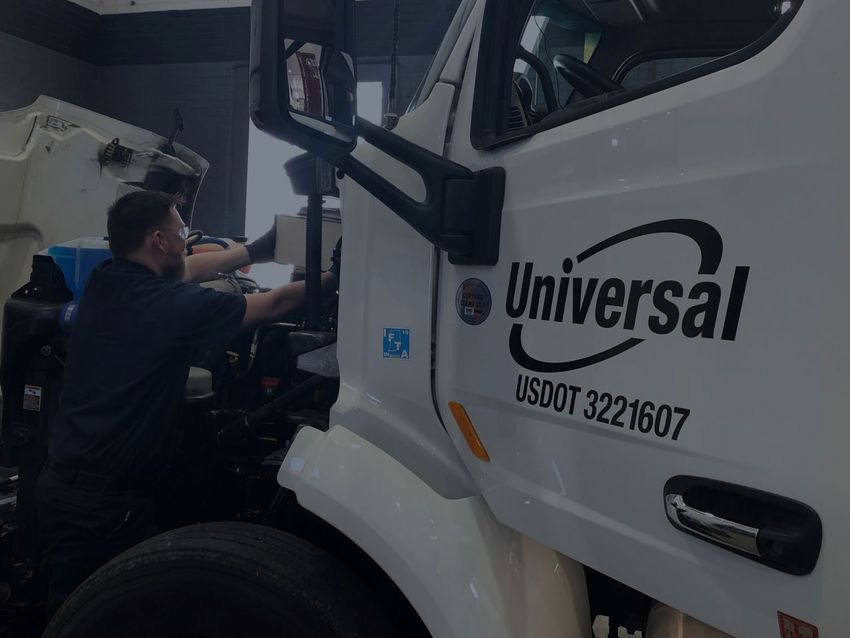
PEOPLE DRIVEN SOLUTIONS 8TRUCKING
- Asset-light variable cost model
- A national network of 319 agents and
company terminals in the U.S. and
Canada
- 1,330 total tractors
- Mix of spot and contractual rates
- Expertise and specialization in end
markets served
- Steel & metals Business strategy
- Oil & gas
- Industrials
Operating regional supercenters with a focus on
- Retail & consumer goods non-cyclical van business and flatbed where
strategic.
- Target revenue: $360-$385 million
- Target margins: 4% - 6%
PEOPLE DRIVEN SOLUTIONS 9COMPANY MANAGED BROKERAGE
- Asset-light variable cost model
- Nationwide network broker
carriers
- Mix of spot and contractual rates
- Expert 3PL offerings
- Retail & consumer goods
- Steel & metals
- Industrials
- Target revenue: $200-$220 million
- Target margins: 1% - 3% Business strategy
Aggregate freight for large national accounts
and optimize truckload assets where needed.
PEOPLE DRIVEN SOLUTIONS 10SHIFT IN BUSINESS MIX
Future Business Mix
Strategic shift to more profitable services
lines:
- $200 million in VAS and Dedicated wins
at full run rate in 2022
- 6 strategic intermodal acquisitions in key
markets: Southern California, Chicago,
and 26 locations east of the Mississippi Former Business Mix
Brokerage
- Transforming brokerage to asset-backed 23% Value-added
32%
brokerage
- Consistent returns in legacy truckload
business Truckload
25%
Intermodal
12%
Dedicated
8%
PEOPLE DRIVEN SOLUTIONS 13WHO WE SERVE
CUSTOMER RELATIONSHIPS

PEOPLE DRIVEN SOLUTIONS   15
CUSTOMER RELATIONSHIPS
Customer Truckload Brokerage Value-Added Dedicated Intermodal
General Motors
Walmart
Ford
General Electric
Fiat Chrysler
Mack
Ross Stores
Kraft Heinz
Niagara Bottling
Boeing
PEOPLE DRIVEN SOLUTIONS 16DIVERSIFICATION OF INDUSTRIES SERVED
2017 2021 Q1
OTHER ENERGY
ENERGY 9% 2%
2% STEEL & METALS
5% AUTOMOTIVE
STEEL & 33%
METALS AUTOMOTIVE
11% 40% OTHER
22%
INDUSTRIAL
INDUSTRIALS
11%
17%
RETAIL &
CONSUMER
GOODS
RETAIL & 27%
CONSUMER
GOODS
21%
Reduced exposure to automotive sector from 40% of
revenue in 2017 to 33% of revenue in Q1 2021
PEOPLE DRIVEN SOLUTIONS 17FINANCIAL OVERVIEW
FINANCIAL RESULTS
                                 Revenue (in millions)                                                                               Adjusted EPS
                                                                                    $415.2                                                                                       $0.80
         $383.2     $375.5     $375.9     $382.2                          $386.0
                                                               $365.0                                 $0.70
                                                                                                                                                                       $0.60
                                                    $258.0                                                                                                     $0.50
                                                                                                               $0.42 (1) $0.40 (1)    $0.45

                                                                                                                                                 $0.23

           Q2         Q3         Q4        Q1         Q2           Q3      Q4         Q1               Q2         Q3        Q4         Q1         Q2           Q3      Q4         Q1
                     2019                                   2020                     2021                        2019                                   2020                     2021

                              Adjusted operating margin                                                                      Adjusted Net Margin
          8.0%                                                                                        5.2%                                                                       5.2%
                                                                                     7.5%

                                          6.3%                     6.0%   6.1%                                                                                         4.2%
                                                                                                                                                               3.7%
                   5.2% (1)
                               4.9% (1)                                                                        3.2% (1)               3.2%
                                                     4.2%                                                                 2.9% (1)
                                                                                                                                                 2.4%

           Q2         Q3         Q4        Q1         Q2           Q3      Q4         Q1               Q2         Q3        Q4         Q1         Q2           Q3      Q4         Q1
                     2019                                   2020                     2021                        2019                                   2020                     2021

 (1)   Q3 2019 is adjusted to exclude the impact of $27.0 million or $0.72 per share in litigation charges; Q4 2019 is adjusted to exclude the impact of $2.9 million or $0.08 per share in
       litigation charges. See appendix.

PEOPLE DRIVEN SOLUTIONS                                                                                                                                                                   19
DEBT AND LIQUIDITY
- Flexible balance sheet with ability to raise capital:
- $67.5 million available on revolver
- $100 million accordion feature on existing
credit facility
- Can leverage up to 3.5x debt to adjusted
EBITDA
(1) Q3 2017 is adjusted to exclude the impact of $17.4 million or $0.38 per share in litigation charges; Q4 2018 is adjusted to exclude the impact of $7.0 million or $0.19 per share in
litigation charges; Q3 2019 is adjusted to exclude the impact of $27.0 million or $0.72 per share in litigation charges; Q4 2019 is adjusted to exclude the impact of $2.9 million or
$0.08 per share in litigation charges. See appendix
PEOPLE DRIVEN SOLUTIONS 20CURRENT OUTLOOK
FULL YEAR 2021 OUTLOOK
                                         Revenue
                                         Estimate      Target Margin   Target Margin   Target Margin   Target Margin
                                         Midpoint       Low-End %         Low-End       High-End %       High-End
                                        ($ Millions)                    ($ Millions)                    ($ Millions)
 Segments
 Contract Logistics - Value-Added   $            415             10% $           39              12% $           48
 Contract Logistics - Dedicated                  185             10%             19              12%             22
 Intermodal                                      475             10%             48              12%             57
 Trucking                                        375              4%             15               6%             23
 Company-Managed Brokerage                       210              1%              2               3%              6
 Total                              $          1,660              7% $          123               9% $          156

                               Near-Term Targets

                               • Target revenue: $2.0 billion

                               • Reduce back-office expenses by 50-100 bps

                               • Operating ratio target: 90.0%

PEOPLE DRIVEN SOLUTIONS                                                                                          22
INVESTING WITH ULH
Ingrained
Highly customer
Well positioned
Proven business experienced relationships
to deliver long-
model built on a leadership team, with some of the
term
highly variable with deep most
shareholder
cost structure industry recognizable
value
knowledge companies in
the world
PEOPLE DRIVEN SOLUTIONS 23APPENDIX
RECONCILIATION OF NON-GAAP MEASURES
 This presentation includes certain non-U.S. generally accepted accounting principles (GAAP) financial measures and adjustments. Presented are
 EBITDA, adjusted EBITDA, debt to EBITDA, adjusted operating margin, adjusted net margin and adjusted diluted earnings per share. The Company
 defines EBITDA as net income plus (i) interest expense, net, (ii) provision for income taxes and (iii) depreciation and amortization. EBITDA, Debt to
 EBITDA, adjusted operating margin, adjusted net margin and diluted earnings per share are adjusted in 2017 to eliminate the impact of certain items
 that we do not consider indicative of our ongoing operating performance, including the impact of a $17.4 million pre-tax litigation charge, or $0.38
 per diluted share, recorded in the third quarter 2017. EBITDA, Debt to EBITDA, adjusted operating margin, adjusted net margin and diluted earnings
 per share are adjusted in 2018 to eliminate the impact of certain items that we do not consider indicative of our ongoing operating performance,
 including the impact of a $7.0 million pre-tax litigation charge, or $0.19 per diluted share, recorded in the fourth quarter 2018. EBITDA, Debt to
 EBITDA, adjusted operating margin, adjusted net margin and diluted earnings per share are adjusted in 2019 to eliminate the impact of certain items
 that we do not consider indicative of our ongoing operating performance, including the impact of $27.0 million in pre-tax litigation charges, or $0.72
 per diluted share, recorded in the third quarter 2019 and $2.9 million in pre-tax litigation charges, or $0.08 per diluted share, recorded in the fourth
 quarter of 2019. The calculation of these measures, and a reconciliation to previously reported comparable measures calculated in accordance with
 U.S. GAAP is shown in the accompanying Appendix. The Company believes that this information, when used in conjunction with information
 presented in accordance with U.S. GAAP, can facilitate a better understanding of the impact of various factors and trends on the Company’s financial
 condition and results of operations. The Company believes that this information should be used in conjunction with the Company’s Quarterly Report
 on Form 10-Q for the quarter ended April 3, 2021 and previously filed public financial reports.

PEOPLE DRIVEN SOLUTIONS                                                                                                                              25
APPENDIX
                                             Year Ended               Year Ended            Year Ended             Year Ended              Year Ended          Twelve Months Ended
                                            December 31,             December 31,          December 31,           December 31,            December 31,                April 3,
                                                     2016                  2017                  2018                  2019                    2020                     2021
                                                (i n thous a nds )    (i n thous a nds )    (i n thous a nds )    (i n thous a nds )      (i n thous a nds )       (i n thous a nds )
 Revenue                                    $          1,072,751 $           1,216,665 $           1,461,708 $             1,511,998 $             1,391,083 $                1,424,152

 Adjusted Income from Operations
   Income from operations                   $              46,580 $              25,214 $              83,794 $                65,380 $                 80,360 $                  87,607
   Litigation charges                                         -                  17,356                 7,000                  29,992
       Adjusted income from operations      $              46,580 $              42,570 $              90,794 $                95,372 $                 80,360 $                  87,607
       Adjusted operating margin                             4.3%                  3.5%                  6.2%                    6.3%                     5.8%                      6.2%

 Adjusted EBITDA
   Net Income                               $              24,244 $              28,153 $             52,178 $                37,586 $                 48,132 $                  57,625
   Provision for income taxes                              15,161               (11,012)              17,211                  12,600                   15,778                    19,191
   Interest expense, net                                    8,109                 9,446               14,593                  17,012                   14,579                    13,533
  Depreciation                                             29,207                41,030               48,679                  59,023                   58,934                    59,096
  Amortization                                              7,495                 5,965                5,746                  15,742                   15,207                    14,612
       EBITDA                               $              84,216 $              73,582 $            138,407 $               141,963 $                152,630 $                 164,057
   Litigation Charges                                         -                  17,356                7,000                  29,992                      -                         -
       Adjusted EBITDA                      $              84,216 $              90,938 $            145,407 $               171,955 $                152,630 $                 164,057

 Debt to Adjusted EBITDA
   Total debt, net of debt issuance costs   $            261,267 $             247,978 $             400,452 $               457,612 $                460,120 $                 429,037
   Adjusted EBITDA                                        84,216                90,938               145,407                 171,955                  152,630                   164,057
   Debt to adjusted EBITDA                                  3.10                  2.73                  2.75                    2.66                     3.01                      2.62

PEOPLE DRIVEN SOLUTIONS                                                                                                                                                            26
APPENDIX
2019 2020 2021
Q2 Q3 Q4 Q1 Q2 Q3 Q4 Q1
2019 2019 2019 2020 2020 2020 2020 2021
(i n thous a nds ) (i n thous a nds ) (i n thous a nds ) (i n thous a nds ) (i n thous a nds ) (i n thous a nds ) (i n thous a nds ) (i n thous a nds )
Revenue $ 383,175 $ 375,485 $ 375,931 $ 382,162 $ 257,980 $ 364,988 $ 385,953 $ 415,231
Adjusted Income from Operations
Income from Operations $ 30,716 $ (7,353) $ 15,504 $ 23,908 $ 10,839 $ 22,063 $ 23,549 $ 31,156
Litigation charges - 27,044 2,948 - - - - -
Adjusted Income from Operations $ 30,716 $ 19,691 $ 18,452 $ 23,908 $ 10,839 $ 22,063 $ 23,549 $ 31,156
Adjusted operating margin 8.0% 5.2% 4.9% 6.3% 4.2% 6.0% 6.1% 7.5%
Adjusted EPS
EPS Diluted $ 0.70 $ (0.30) $ 0.32 $ 0.45 $ 0.23 $ 0.50 $ 0.60 $ 0.80
Litigation charges net of tax - 0.72 0.08 - - - - -
Adjusted EPS $ 0.70 $ 0.42 $ 0.40 $ 0.45 $ 0.23 $ 0.50 $ 0.60 $ 0.80
Adjusted net income
Net income $ 19,972 $ (8,416) $ 8,737 $ 12,163 $ 6,168 $ 13,578 $ 16,223 $ 21,656
Litigation charges net of tax 20,283 2,212
Adjusted net income $ 19,972 $ 11,867 $ 10,949 $ 12,163 $ 6,168 $ 13,578 $ 16,223 $ 21,656
Adjusted net margin 5.2% 3.2% 2.9% 3.2% 2.4% 3.7% 4.2% 5.2%
PEOPLE DRIVEN SOLUTIONS 27CONTACT US
Steve Fitzpatrick
Investor Relations
sfitzpatrick@universallogistics.com
PEOPLE DRIVEN SOLUTIONS 28You can also read