UK INNOVATION REPORT 2022 - Benchmarking the UK's industrial and innovation performance in a global context
←
→
Page content transcription
If your browser does not render page correctly, please read the page content below
UK INNOVATION REPORT 2022

Benchmarking the UK’s industrial and innovation
performance in a global context

Institute for Manufacturing, University of Cambridge
March 2022
What makes this report different

While numerous sources of data on the topic of innovation exist, the UK Innovation Report aims to make a contribution by bringing together, in a
single place, innovation and value added indicators in a concise and accessible format. The report seeks to demonstrate the value of combining
different types of indicator and data sets to facilitate policy discussions on innovation and industrial performance – and the interplay between
them.

Instead of structuring the report according to input and output indicators, as is typically done in reviews of innovation activity, the focus has been
on bringing together indicators that provide rich quantitative representations that are relevant to the vitality of the UK’s innovation activity and
its industrial performance in an international context. While the report does not make specific policy recommendations, it does highlight areas
where additional evidence and policy action may be required.

                      ▪   Review the UK’s innovation and industrial performance and compare it with that of other selected countries
 Motivation           ▪   Facilitate discussions on the relation between innovation and sectoral competitiveness
                      ▪   Contribute to the evidence base available to inform industrial and innovation policy

                                                                                                                                                       2
Contributors and acknowledgements
Cambridge Industrial Innovation Policy
Cambridge Industrial Innovation Policy (CIIP) brings together the Centre for Science, Technology & Innovation Policy at the Institute for Manufacturing, the Policy
Links Unit from IfM ECS and the Babbage Policy Forum. Our work is based around what we call industrial innovation policy, a policy domain that focuses on the
interplay between technology, innovation and industrial competitiveness. CIIP is based at the Institute for Manufacturing, a division of the University of
Cambridge's Department of Engineering.
17 Charles Babbage Road, Cambridge, CB3 0FS, United Kingdom
https://www.ciip.group.cam.ac.uk/
Contributors
The contributors to this report are: Jennifer Castaneda-Navarrete, David Leal-Ayala, Carlos López-Gómez, Michele Palladino and Liz Killen. Technical advice was provided by Ana Rincon-
Aznar (National Institute of Economic and Social Research). Research assistance was provided by Maximilian Elsen (Institute for Manufacturing). Cover design by Ella Whellams. Copy editing
by Jason Naselli.
Acknowledgements
The authors would like to thank Tim Minshall and Eoin O’Sullivan, who provided comments, suggestions and reviewed earlier versions of this report. We would also like to thank all the
organisations from the private and public sectors who provided valuable time and insights during the interviews and workshops carried out to inform the report.
Disclaimer
Names of countries and territories follow widely accepted conventions and do not imply the expression of any opinion whatsoever on the part of the authors or their affiliated institutions
concerning the legal status of any country, territory, city or area or of its authorities. Any mention of firm names or commercial products does not constitute an endorsement by the authors or
their affiliated institutions.
For further details, please contact: ifm-policy-links@eng.cam.ac.uk
Please reference as: Policy Links (2022). UK Innovation Report 2022. Benchmarking the UK’s Industrial and Innovation Performance in a Global Context. IfM Engage.
Institute for Manufacturing, University of Cambridge.
3Executive summary
UK INNOVATION REPORT 2022
4Executive summary (1/6)
Theme (1) Structure and performance of the UK economy Pages 15-27
Key policy ▪ How has the structure of the UK economy changed in the last few years?
questions ▪ Are these changes affecting economic performance?
addressed ▪ How does this compare with other countries?
▪ In the last two decades, the share in the UK economy of high-productivity sectors such as manufacturing and mining
has reduced while the participation of sectors such as construction and services has grown. Between 1998 and 2019, the
manufacturing sector had one of the highest productivity growth rates in the UK economy, but it was also the sector
whose share in the economy decreased the most (from 16.1% to 9.7%) during this period.
▪ Finance was the main driver of productivity growth prior to 2008 but its contribution became negative in the post-
crisis period. Before the financial crisis finance was the main driver of productivity growth in the UK, but Bank of
Key findings
England analysis suggests that this was likely driven by “unsustainable increased debt and higher risk tolerance”. The
contribution of finance to national productivity growth became negative post-crisis.
▪ The loss of manufacturing has imposed a penalty on UK productivity growth of half a percentage point on average each
year for the last two decades. In contrast, manufacturing was responsible for around 30% of aggregate productivity
growth in China and almost half in Taiwan during the period 1998–2017. It also contributed to around 30% of aggregate
productivity growth in Korea between 2005 and 2017 and 15% in Singapore between 2010 and 2017.
5Executive summary (2/6)
Theme (2) Investment in innovation Pages 28-43
Key policy ▪ Is the UK spending enough on R&D?
questions ▪ How do the public and private sectors contribute to national expenditure on innovation?
addressed ▪ How does the UK compare with other countries?
▪ The UK spends less on R&D than the OECD average; a significant increase in public funding for R&D has been
announced but delayed. At 1.74%, the UK’s gross domestic expenditure on R&D remains well below the 2019 OECD
average of 2.5%. The UK government has committed to investing £22 billion in R&D by 2026/27 (pushing back the
original target date of 2024).
▪ Compared to other countries, the business sector in the UK contributes less to R&D funding; universities perform
significantly more of the country’s R&D and the government significantly less. In the UK the business sector funds
Key findings
around 55% of R&D – a lower proportion than in countries such as Germany, Korea and Japan. The UK’s higher education
sector stands out from comparator countries, performing 23.1% of the country’s R&D in 2019. The government sector in
the UK performs only 6.6% of R&D, well below comparator countries.
▪ Very few firms headquartered in the UK are global leaders in R&D investment and patent applications. In 2020, only two
companies headquartered in the UK were among the top 100 R&D investing firms and no firms headquartered in the UK
were among the top 100 patent applicants at the United States Patent and Trademark Office (USPTO).
6Executive summary (3/6)
Theme (3a) Industrial performance – Focus on pharmaceutical manufacturing sector Pages 44-61
Key policy ▪ Are UK sectors becoming more or less competitive internationally?
questions ▪ How are UK sectors performing in terms of productivity, value added and employment?
addressed ▪ What are the drivers behind the observed performance trends?
Key UK pharmaceutical manufacturing trends in the last decade Drivers identified in literature review and sector expert consultations
▪ The value added and productivity of the UK pharmaceutical
manufacturing sector have declined significantly in the last decade. ➢ Company restructuring and site closures, including those by major sector employers
Of the top 13 countries by pharmaceutical value added in 2018, the ➢ Increased offshoring of pharmaceutical manufacturing, including a large share of APIs
UK is the only one to have experienced a significant productivity ➢ UK’s inability to capture the “second wave” of international manufacturing investments
decline, at a rate of -7.9% per year between 2008 and 2018. ➢ Greater incentives (e.g. tax) offered by other countries to attract manufacturing
▪ The UK trade balance in pharmaceuticals has deteriorated ➢ New entrants focusing on early-stage drug discovery and non-manufacturing activities
significantly since 2014. The UK has recorded deficits in ➢ Inability to commercialise and scale up manufacture of technologies developed in the UK
pharmaceutical product trade in all years between 2014 and 2020, ➢ Caps on drug spending having an impact on the perception of the UK by investors
except in 2015, with trade balance going from a $9.6 billion surplus ➢ Increased use of generics pushing prices downwards and driving imports upwards
in 2010 to a deficit of over $1 billion in 2020. ➢ 2016 EU membership referendum adding uncertainty to investment decisions
▪ Pharma business R&D expenditure in the UK has remained stagnant ➢ Large share of domestic business R&D expenditure decisions taken abroad
in the last decade and remains significantly lower than comparator ➢ Competitor countries having greater incentives to attract R&D investment
countries. The sector spent only 6% more in 2018 than it did in 2008, ➢ Difficulties to access scale-up funding locally leading to firm decisions to migrate
compared to increases of around 30% in the US and Germany, and ➢ UK companies reducing in-house R&D investment in favour of acquiring small firms
over 100% in Korea.
7Executive summary (4/6)
Theme (3b) Industrial performance – Focus on automotive manufacturing sector Pages 62-79
Key policy ▪ Are UK sectors becoming more or less competitive internationally?
questions ▪ How are UK sectors performing in terms of productivity, value added and employment?
addressed ▪ What are the drivers behind the observed performance trends?
Key UK automotive manufacturing trends in the last decade Drivers identified in literature review and sector expert consultations
▪ The value added and productivity of the UK automotive sector
grew steadily between 2008 and 2018. The UK belongs to a group
of nations where productivity was high and rising over the 2008–
18 period, together with Germany, Korea and the US. ➢ Increased specialisation of the UK’s automotive sector in premium product segments
➢ Future sector growth dependent on the UK’s ability to produce electric and hydrogen
▪ Despite being the ninth largest exporter of vehicles in 2020, the
vehicles and components
UK maintains a significant deficit in automotive product trade.
➢ High levels of automation influencing growth in employment in recent years
Since 2010 the UK has recorded a persistent trade deficit in
➢ Skills shortages, particularly in higher technical education reported by industry
automotive products, standing at $21.8 billion in 2020. Industry
➢ Decisions by foreign original equipment manufacturers (OEM) favouring other locations
reports suggest 50% local content is a plausible target for the UK
➢ Increased competitive pressures from both established and upcoming nations
car industry.
➢ Increased uncertainty around trade and investment due to the 2016 EU membership
▪ UK business expenditure on automotive R&D grew rapidly referendum
between 2009 and 2016 but has declined in recent years. UK ➢ R&D investment decisions mostly driven by foreign OEMs
business enterprise expenditure on R&D (BERD) for automotive
grew by 11.7% (CAGR) between 2009 and 2018 (but with a slow
down in 2017 and 2018).
8Executive summary (5/6)
Theme (4) Science and engineering workforce Pages 80-89
Key policy ▪ Is the UK producing enough scientists and engineers?
questions ▪ Is the UK government investing enough in technical and vocational education?
addressed ▪ How does this compare with other countries?
▪ Tertiary education attainment in the UK is well above the OECD average – and a comparatively larger share of graduates
is found in science, technology, engineering and mathematics (STEM) disciplines. In 2019 graduates in STEM
disciplines accounted for 43.4% of the total number of graduates in the UK, above comparator countries such as France
(36.8%), Canada (37.8%) and the United States (37.6%)
▪ Women are under-represented in STEM disciplines. Only 27% of the STEM workforce in the UK is female, compared
Key findings with 52% in the total workforce. For UK engineers a gender pay gap exists but it is smaller than the pay gap for all UK
workers.
▪ Higher technical education enrolment is comparatively low in the UK. Enrolment rates in post-secondary education
courses, below the standard three-year Bachelor’s degree, are comparatively low in the UK when compared with
countries such as the US, Korea and France. The government’s White Paper, Skills for Jobs recognises a “significant
shortage of vital technician-level STEM skills”.
9Executive summary (6/6)
Theme (5) Net zero innovation Pages 90-100
Key policy ▪ How does the UK compare in low carbon and renewable energy technology research and development (R&D) investment?
questions ▪ How is R&D expenditure translating into patenting performance?
addressed ▪ Is the UK capturing the economic potential of the transition towards net zero?
▪ The UK is one of the global leaders in both public R&D budget and patenting of net zero-related technologies. The
International Energy Agency (IEA) estimates that in 2020 the UK’s public R&D budget in low carbon and renewable
energy technologies was $1.2bn (USD $2020), lower than France, Japan, and the US, but ahead of Germany and Canada .
The UK ranks 8th in the registration of climate change mitigation technology (CCMT) patents, behind Japan, the US,
Germany, Korea, China, France and Taiwan.
▪ Most of the low carbon and renewable energy sectors in the UK have been declining over the last 5 years. The ONS
Key findings
defines the low carbon and renewable energy economy (LCREE) as 17 low carbon sectors including wind, renewables, PV,
CCS, nuclear, and energy-efficient products. Ten out of 17 LCREE sectors show a decline in turnover between 2014-2019.
Overall, there were 27,000 fewer LCREE business and 33,800 fewer jobs in LCREE sectors in 2019 than in 2014.
▪ There are some national disparities, with Scotland performing strongly. At £1m turnover, 4.1 jobs and 2.2 businesses per
1,000 inhabitants, Scotland performed above the UK annual average for all categories between 2014-2019. Wales also
performs above national averages for LCREE businesses and jobs at 2.46 businesses and 3.35 jobs per 1,000 inhabitants.
10Introduction
UK INNOVATION REPORT 2022
11Introduction
The aim of the UK Innovation Report is to facilitate policy discussions on innovation and industrial performance – and the interplay between them. The 2022 edition of the report is
published amid a changing policy landscape. In March 2021 the UK government released a new strategy, Build Back Better: our plan for growth, which replaces the 2017 Industrial
Strategy and sets out the government’s plan to address the “invented in Britain”/“made elsewhere” disconnect. A new Innovation Strategy published in July 2021 sets out a “long-
term plan for delivering innovation-led growth”, announcing a commitment to increase annual public investment on R&D to £22 billion. The government has also established a new
Office for Science and Technology Strategy and a National Science and Technology Council. In February 2022 the first chief executive of the new Advanced Research and Invention
Agency (ARIA), modelled after the US Advanced Research Projects Agency (ARPA), was appointed.
The UK Innovation Report 2022 maintains last year’s four core sections (structure and performance of the UK economy, investment in innovation, industrial performance and
science and engineering workforce) and incorporates a new one (net-zero innovation). It not only provides updates using newly available data but also seeks to address policy
questions from different angles. The report uses new indicators and longer time series, integrates additional national and international databases, and analyses more granular data at
industry and firm level.
Section 1 provides new decompositions of productivity growth rates and international productivity comparisons at sector level, building on a related project being conducted by the
Policy Links Unit in collaboration with the National Institute of Economic and Social Research. Section 2 presents firm-level data on R&D investment and patent applications.
Section 3 deep-dives into the pharmaceutical and automotive manufacturing sectors, incorporating insights gathered during consultations with industry experts from the public and
private sectors from around twenty different organisations. Section 4 places additional emphasis on science, technology, engineering and mathematics (STEM) disciplines and
technical education. Finally, Section 5 incorporates data on innovation and the economic performance of low-carbon and renewable-energy sectors.
New section in this edition: net zero innovation
For many, the greatest challenge of the 21st century is climate change. Net zero refers to achieving a balance between the carbon emitted into the atmosphere and the carbon
removed from it. Markets for new technologies that can help businesses and countries to achieve net zero are expanding, and therefore they are a key area in which innovative
activity has the potential to contribute to national economic growth and competitive advantage. Our 2022 report has chosen net zero innovation as a topic in focus, to highlight how
the UK is performing in what has the potential to be a high-growth economic sector.
12List of charts
UK INNOVATION REPORT 2022
13List of charts
Theme 1: Structure and performance of the UK economy Theme 3: Industrial performance – Focus on Theme 4: Science and engineering workforce
pharmaceutical and automotive manufacturing sectors
Chart 1.1. Labour productivity: international comparison
Chart 1.2. UK economic structure and sectoral productivity Chart 4.1. Tertiary education attainment
Chart 1.3. UK economic structure and sectoral productivity
Chart 4.2. Graduates by subject areas
Chart 1.4. Sectoral sources of UK productivity growth
Chart 4.3. STEM PhDs
Chart 1.5. Sectoral sources of UK productivity growth, pre-crisis
Chart 1.6. Sectoral sources of UK productivity growth, post-crisis Chart 4.4. Women in STEM tertiary education
Chart 1.7. Sectoral sources of UK productivity growth, COVID-19 Chart 4.5. Engineering profession salaries
Chart 1.8. Sectoral productivity: international comparison Chart 3.1. Pharmaceutical manufacturing – value added and Chart 4.6. Government researchers
Chart 1.9. Structural change: international comparison employment Chart 4.7. Higher technical education
Chart 1.10. Sectoral contribution to aggregate productivity Chart 3.2. Pharmaceutical manufacturing – productivity growth Chart 4.8. Green skills for net-zero transition
growth: international comparison (1/2) Chart 3.3. Pharmaceuticals – trade balance (a)
Chart 3.4. Pharmaceuticals – trade balance (b)
Theme 2: Investment in innovation Chart 3.5. Pharmaceuticals – UK top trade partners Special theme
Chart 3.6. Pharmaceuticals – business spending on R&D (a) Theme 5: Net zero innovation
in this edition
Chart 2.1. R&D expenditure: international comparison Chart 3.7. Pharmaceuticals – business spending on R&D (b)
Chart 2.2. Actual UK R&D expenditure against 2.4% target Chart 3.8. Pharmaceuticals – foreign R&D in the UK
Chart 2.3. UK government net expenditure on R&D against the Chart 3.9. Automotive – value added and employment Chart 5.1. UK carbon emissions by sector
2026/2027 £22 billion target Chart 3.10. Automotive – productivity growth Chart 5.2. Public R&D spending on low carbon and renewable
Chart 2.4. R&D expenditure by source of funding Chart 3.11. Automotive – trade balance (a) energy technologies
Chart 2.5. R&D expenditure by sector of performance Chart 3.12. Automotive – trade balance (b) Chart 5.3. Top 10 countries by global share of patents in climate
Chart 2.6. UK government net expenditure on R&D by Chart 3.13. Automotive – local content change mitigation technology (CCMT)
department Chart 3.14. Automotive – business spending on R&D (a) Chart 5.4. Top 10 UK patent applicants in the field of climate
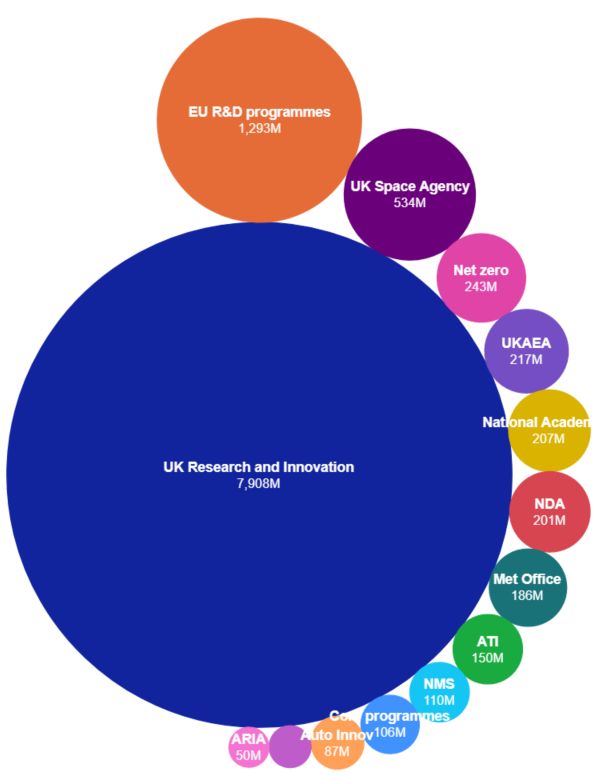
Chart 2.7. BEIS R&D funding allocation, 2021–2022 Chart 3.15. Automotive – business spending on R&D (b) change mitigation technologies (CCMT)
Chart 2.8. Top 20 R&D investing companies in the world Chart 3.16. Automotive – foreign R&D in the UK Chart 5.5. UK low carbon and renewable energy economy
Chart 2.9. Top R&D investing companies worldwide (LCREE) sector performance
Chart 2.10. Expenditure of top R&D investing companies Chart 5.6. Employment and number of businesses in the low
Chart 2.11. Top 10 UK companies investing in R&D carbon and renewable energy economy (LCREE)
Chart 2.12. Top 100 patent applicant firms at USPTO Chart 5.7. Low carbon and renewable energy economy
Chart 2.13. UK top 10 patent applicants at USPTO (LCREE) sectors comparison by country
Chart 2.14. Top 10 UK patent applicants at USPTO by industry
14Theme 1: Structure and performance of the UK economy
UK INNOVATION REPORTTheme 1: Policy questions and key messages
▪ How has the structure of the UK economy changed in the last few years?
▪ Are these changes affecting economic performance?
▪ How does this compare with other countries?
In the last two decades high-productivity sectors such as manufacturing and mining have reduced their participation in the UK economy in favour
of sectors such as construction and services
▪ Manufacturing productivity growth rate was among the highest in the UK economy between 1998 and 2019, but it was also the sector whose share in the economy
decreased the most (from 16.1% to 9.7%) during this period.
▪ Services whose share of the economy increased during this period include (change in value added shares in brackets, percentage points): human health and social
activities (2.1); professional, scientific and technical activities (2.0); and administrative service activities (1.4).
Finance was the main driver of productivity growth prior to 2008 but its contribution became negative in the post-crisis period
▪ In the period 1998–2007, finance was the main driver of productivity growth in the UK, adding 0.37 percentage points on average each year to aggregate productivity
growth. After the crisis, finance’s contribution to national productivity became negative.
▪ Administrative services; construction; information and communication; and professional, scientific and technical activities were among the top contributors to
aggregate productivity growth in the post-crisis period (2011–19).
▪ Following the COVID-19 pandemic the main contributor to productivity growth was human health and social activities.
The loss of manufacturing has imposed a penalty on UK productivity growth of half a percentage point each year on average for the last two decades
▪ The reduction in manufacturing share in economies is a common feature across most of the economies examined between 1998 and 2017. But as a result of its high-
productivity growth rates, manufacturing is one of the sectors that makes the largest contribution to aggregate productivity growth in the best-performing countries.
▪ During the period 1998–2017, manufacturing was responsible for around 30% of the aggregate productivity growth in China and almost half of productivity growth
recorded in Taiwan during the period 1998–2017. Manufacturing also contributed to around 30% of aggregate productivity growth in Korea between 2005 and 2017
and 15% of productivity growth in Singapore between 210 and 2017.
▪ In contrast, manufacturing had a negative contribution to aggregate productivity growth in the UK during this period, mainly due to a reduction in its participation in
the economy (as reflected in a negative allocation effect of -0.5 percentage points).
16Chart 1.1. Labour productivity: international comparison
Output per worker, selected countries, 1998–2017
Pre-crisis Crisis Post-crisis
12%
▪ In the pre-crisis period (1998–2007) UK labour
10% productivity growth rates were similar to those
observed in other developed countries such as
8% Germany and the US. China, Korea and Taiwan
recorded the strongest performance during this
Annual growth
period.
6%
▪ In the aftermath of the financial crisis (2008–10),
4% most countries analysed experienced a significant
slowdown in productivity growth. However, the UK
2% was hit the hardest, recording a negative growth
rate of -0.5%.
0% ▪ In the post-crisis period (2011–17) the strongest
productivity performance was recorded by China,
-2% Korea and Germany (7.3%, 3.2% and 2.3%,
France
France
France
US
UK
US
UK
Germany
US
UK
China
Germany
China
Germany
China
Korea
Taiwan
Korea
Taiwan
Korea
Singapore
Taiwan
respectively). Productivity growth in the UK, the US
and Taiwan was considerably weaker (0.7%, 0.7%
and 1.1%, respectively).
1998–2007 2008–2010 2011–2017
Source: Authors’ computation based on data from the APO Productivity Database 2020 Ver.1 (5 August 2020); OECD STAN
Industrial Analysis (2020 ed.); Korea Productivity Center; Singapore Department of Statistics; Singapore Ministry of Trade and 17
Industry; Manpower Research & Statistics Department; Taiwan Statistical Bureau UK Office for National Statistics; US Bureau of
Economic Analysis and US Bureau of Labor Statistics.Chart 1.2. UK economic structure and sectoral productivity
Labour productivity and value added, 1998 and 2019 ▪ Sector-level analysis reveals the key structural factors
1998 2019 Change 1998–2019 behind the relatively slow rates of productivity growth
Value added Value in the UK. The contribution of economic sectors to
Value added Value added per hour added
Economic sector Value added Value added aggregate productivity growth depends on how
per hour per hour (annual shares
(1) shares shares
(pounds) (pounds)(1) average (percentage productive they are (usually measured by value added
growth rate) points)
Real estate activities(2) 411.6 14.7% 292.9 13.3% -1.6% -1.4 per hour), their rate of productivity growth and their
Mining and quarrying 300.3 1.5% 163.2 1.0% -2.6% -0.5 relative size in the economy (usually measured in
More productive
Electricity, gas, steam and air- terms of value added and employment shares).
109.5 1.5% 98.9 1.4% -0.1% -0.1
conditioning supply
Activities of households 50.6 0.2% 98.8 0.3% 4.6% 0.1
Water supply; sewerage, waste
▪ In 2019 the most productive market sectors in the UK
73.0 1.4% 69.0 1.2% 0.3% -0.2 economy included (overall value added per hour
management and remediation
Financial and insurance activities 46.2 5.7% 63.9 6.3% 2.5% 0.6 worked in brackets): mining and quarrying (£163.2),
Information and communication 24.4 5.6% 50.4 6.9% 3.7% 1.3
Manufacturing 24.4 16.1% 39.1 9.7% 2.2% -6.5 electricity and gas (£98.9), water supply (£98.8),
Public administration and defence;
35.0 5.1% 39.1 5.0% 0.5% -0.1
financial and insurance activities (£63.9),
compulsory social security
information and communication (£50.4) and
Professional, scientific and technical
20.4 5.7% 30.3 7.7% 2.1% 2.0 manufacturing (£39.1).
activities
Education 38.4 4.9% 29.9 5.9% -1.3% 1.0
Construction 25.1 5.5% 29.0 6.5% 0.6% 1.1 ▪ The case of manufacturing stands out. While
Wholesale and retail trade; repair of manufacturing productivity growth was among the
18.8 12.2% 26.7 10.3% 1.6% -1.8
motor vehicles and motorcycles
highest between 1998 and 2019 (with an annual
Less productive
Transportation and storage 24.7 4.4% 26.2 4.1% 0.4% -0.3
Other service activities 26.2 1.5% 25.6 1.7% 0.1% 0.3 growth rate of 2.2%), it was the sector with the largest
Arts, entertainment and recreation 30.2 1.2% 23.7 1.6% -0.7% 0.5
decline in value added shares during this period (-6.5
Human health and social activities 19.7 5.5% 23.6 7.6% 0.9% 2.1
Administrative and support-service percentage points).
14.3 3.9% 23.1 5.3% 2.2% 1.4
activities
Accommodation and food-service ▪ Meanwhile, mining and quarrying almost halved its
16.4 2.5% 17.5 3.0% 0.4% 0.5
activities labour productivity while reducing its value added
Agriculture, forestry and fishing 10.4 1.1% 15.5 0.7% 2.7% -0.4
Whole economy 28.2 100% 35.4 100% 1.1% 0 share by 1.4 percentage points during this period.
Notes: (1) Chain volume measure (CVM) prices. (2) The productivity of the real estate sector is distorted by the inclusion of
imputed rents from owner-occupied dwellings in the value added of this sector. 18
Source: Own computation based on data from the UK Office for National Statistics.Chart 1.3. UK economic structure and sectoral productivity
Labour productivity and value added, selected sectors, 1998–2019
Human health and Professional, scientific
social activities and technical activities
3.0
Administrative and Information and
Expanding
support service communication
2.0 activities Financial and
insurance activities
1.0
(percentage points, 1998–2019)
Construction
▪ Chart 1.3 shows the productivity in 2019 and the
Change in value-added shares
0.0 changes in value added shares between 1998 and
2019 for selected sectors.
-1.0 Wholesale and retail
Agriculture, forestry trade; repair ▪ The participation of manufacturing in the economy
and fishing
-2.0 declined significantly during this period (by 6.5
percentage points). Meanwhile construction and
Declining
-3.0 both high- and low-productivity service activities
increased their participation in the economy.
-4.0
▪ Services that experienced the largest increase in
-5.0 value added shares during this period include
(changes in percentage points in brackets): human
-6.0 health and social activities (2.1); professional,
Manufacturing scientific and technical activities (2.0); and
-7.0 administrative and support service activities (1.4).
0 10 20 30 40 50 60 70
Labour productivity (value added per hour, £, 2019)
Higher productivity
Source: Own computation based on data from the UK Office for National Statistics.
19Chart 1.4. Sectoral sources of UK productivity growth ▪ Sectors contribute differently to aggregate productivity growth
because of disparities in their productivity performance and
Sectors with the largest and lowest contributions to UK aggregate productivity
their participation in employment and output.
growth, selected time period
▪ In the pre-crisis period (1998–2007) financial and insurance
activities were the main driver of productivity growth in the
Pre-crisis (1998–2007) Post-crisis (2011–19) COVID-19 (2019–20) UK, with an average annual contribution to productivity growth
UK aggregate productivity UK aggregate productivity UK aggregate productivity of 0.37 percentage points. In contrast, manufacturing had a
growth (average): 2.1% growth (average): 0.3% growth: 1.2% negative contribution (-0.31).
Economic sector Contribution Economic sector Contribution Economic sector Contribution ▪ In the post-crisis period (2011–19), the contributions of the
Financial and Human health and financial and insurance sector to aggregate productivity growth
0.37 Real estate activities 0.19 1.97
insurance activities social activities declined to negative levels (-0.17 percentage points), with real
Construction 0.29
Administrative and
0.14 Real estate activities 0.63
estate activities, administrative and support services and
support services
information and communication having among the largest
Human health and
Top 5 social activities
0.29 Construction 0.11 Education 0.56 contributions (0.19, 0.14 and 0.10 respectively).
Professional, scientific
0.29
Information and
0.10
Public admin, defence,
0.53 ▪ A likely explanation for the decline of the financial sector is
and technical activities communication social security
that, in the pre-crisis period, high growth was mainly driven by
Information and Professional, scientific Financial and
communication
0.23
and technical activities
0.08
insurance activities
0.32 unsustainable increased debt and higher risk tolerance.[1]
Water supply, Wholesale, retail trade Transportation and
▪ It is important to note that the contribution of the real estate
0.02 -0.06 -0.41 sector is distorted by the inclusion of imputed rents from
sewerage, etc. and repair storage
Public administration, owner-occupied dwellings in the value added of this sector.[2]
Mining and quarrying 0.02 -0.06 Manufacturing -0.44
defence, social security
Activities of ▪ The increasing demand for health and social services
Bottom 5 0.00 Manufacturing -0.07 Construction -0.56
during the COVID-19 pandemic meant that this sector was
households
Agriculture, forestry
-0.03 Mining and quarrying -0.08
Administrative and
-0.64
responsible for the largest contribution to aggregate
and fishing support services productivity growth in 2020 (1.97 percentage points).
Financial and Accommodation and
Manufacturing -0.31 -0.17 -1.18 Meanwhile, accommodation and food service activities
insurance activities food service activities
had a negative contribution (-1.18 percentage points).
Note: Contribution to aggregate productivity is computed as the sum of intra-industry productivity growth (within) effect and [1] Teneyro, S. (2018). The fall in productivity growth: causes and
allocation (between) effect. Figures correspond to average annual contributions. implications. 20
Source: Own computation based on data from the UK Office for National Statistics. [2] Riley et al. (2018). Below aggregate: a sectoral account of the UK
productivity puzzle.Chart 1.5. Sectoral sources of UK productivity growth, pre-crisis
Sectors with the largest and lowest contributions to UK aggregate productivity ▪ In the decade before the financial crisis (1998–2007)
growth, 1998–2007 the sectors with the largest contributions to aggregate
productivity growth were: financial and insurance
Pre-crisis (1998–2007) activities (0.37); construction (0.29); human health
and social activities (0.29); professional, scientific
Contribution to productivity and technical activities (0.29); and information and
Change 1998–2007 growth 1998–2007 communication (0.23)
(annual average)
Economic sector Value added ▪ The contributions of financial and insurance
Value added Employment Intra-
per hour(1) activities, information and communication and
shares shares industry Allocation
(annual Total
average
(percentage (percentage productivity effect professional, scientific and technical activities
points) points) effect
growth rate) during 1998–2007 were mainly driven by the growth of
Financial and insurance activities 6.8% 2.6 -0.2 0.38 -0.01 0.37 productivity in each of these sectors (intra-industry
Construction 0.1% 1.2 0.6 0.03 0.26 0.29 productivity effect).
Top 5
Human health and social activities 1.8% 1.5 1.2 0.09 0.20 0.29 ▪ Meanwhile, the contributions of the construction and
Professional, scientific and human health and social activities sectors during this
3.5% 1.2 1.1 0.20 0.08 0.29
technical activities
period are largely explained by their expansion
Information and communication 6.7% 0.7 0.2 0.40 -0.17 0.23 (allocation effect).
Water supply, sewerage, waste ▪ At 4.2%, the productivity growth rates of the
management, remediation 2.0% -0.1 0.0 0.03 -0.01 0.02 manufacturing sector were among the highest during
activities 1998–2007 (resulting in an intra-industry productivity
Bottom 5 Mining and quarrying -2.2% 0.3 -0.1 -0.02 0.04 0.02 effect of 0.57). However, its employment share
Activities of households -4.7% 0.0 0.2 0.00 0.00 0.00 declined by 5.5 percentage points (resulting in a
Agriculture, forestry and fishing 4.0% -0.4 -0.4 0.05 -0.07 -0.03 negative allocation effect of -0.89). As a result, the
Manufacturing 4.2% -5.4 -5.5 0.57 -0.89 -0.31 contribution of manufacturing to productivity growth in
Note: (1)Chain
volume measure (CVM) prices. this period was the lowest in the economy (-0.31).
Source: Own computation based on data from the UK Office for National Statistics.
21Chart 1.6. Sectoral sources of UK productivity growth, post-crisis
Sectors with the largest and lowest contributions to UK aggregate productivity growth,
2011–2019
▪ In the decade after the financial crisis (2011–19) the
Post-crisis (2011–19)
sectors with the largest contributions to UK aggregate
Contribution to productivity productivity growth included: real estate activities
Change 2011–19 growth 2011–19 (0.19); administrative and support service activities
(annual average) (0.14); construction (0.11); information and
Economic sector Value added
per hour(1)
Value added Employment Intra- communication (0.10); and professional, scientific
shares shares industry Allocation and technical activities (0.08).
(annual Total
(percentage (percentage productivity effect
average
points) points) effect
growth rate) ▪ Except for real estate activities, the contributions of
Real estate activities -0.4% 1.0 0.2 -0.06 0.25 0.19 these sectors are largely explained by relatively higher
Administrative and support productivity growth rates (intra-industry productivity
2.7% 1.1 0.6 0.12 0.02 0.14
service activities effect).
Construction 0.7% 0.7 0.1 0.04 0.07 0.11
Top 5
Information and
1.3% 0.5 0.3 0.08 0.01 0.10 ▪ The sectors with the weakest contributions to
communication aggregate productivity in the reference period include:
Professional, scientific and
technical activities
1.0% 0.6 1.2 0.07 0.00 0.08 financial and insurance activities (-0.17); mining
and quarrying (-0.08); manufacturing (-0.07); public
Wholesale and retail trade; administration (-0.06); and wholesale and retail
repair of motor vehicles and 2.1% -0.4 -1.0 0.23 -0.28 -0.06 trade (-0.06).
motorcycles
Public administration and
0.5% -0.5 -0.9 0.03 -0.09 -0.06
▪ Except for mining and quarrying, the negative
Bottom 5 defence; social security contributions of these sectors were due to their
Manufacturing 0.1% -0.9 -0.6 0.01 -0.09 -0.07 contraction in size (allocation effect). Among these
Mining and quarrying -2.2% -0.8 0.0 -0.07 -0.02 -0.08
Financial and insurance
activities, the wholesale and retail trade sector
-1.0% -1.7 -0.4 -0.08 -0.10 -0.17 experienced the largest contraction in employment.
activities
Note: (1)Chain
volume measure (CVM) prices.
Source: Own computation based on data from the UK Office for National Statistics.
22Chart 1.7. Sectoral sources of UK productivity growth, COVID-19
Sectors with the largest and lowest contributions to UK aggregate productivity
▪ During the COVID-19 pandemic (2019–20) the sectors
growth, 2019–2020
with the largest contributions to aggregate productivity
COVID-19 (2019–20) growth included: human health and social activities
(1.97); real estate activities (0.63); education (0.56);
Contribution to productivity public administration (0.53); and financial and
Change 2019–20
growth, 2019–20
insurance activities (0.62).
Economic sector Value added Value added Employment Intra- ▪ Other sectors (not presented in the table) with relatively
per hour(1) shares shares industry Allocation
Total large positive contributions in the reference period
(annual (percentage (percentage productivity effect
growth rate) points) points) effect include professional, scientific and technical activities
(0.28) and information and communication (0.10).
Human health and social
-7.3% 1.9 0.2 -0.56 2.53 1.97
activities ▪ The sectors with the weakest contributions to aggregate
Real estate activities -2.1% 0.5 0.2 -0.28 0.90 0.63 productivity in the reference period include:
Top 5 Education -5.9% 0.5 0.1 -0.34 0.91 0.56 accommodation and food services (-1.18);
Public administration and
-0.8% 0.5 0.2 -0.04 0.57 0.53
administrative and support services (-0.64;
defence; social security construction (-0.56); manufacturing (-0.44); and
Financial and insurance activities -4.8% 0.2 0.1 -0.30 0.62 0.32 transportation and storage (-0.41).
Transportation and storage -3.6% -0.5 0.0 -0.15 -0.26 -0.41 ▪ The negative contributions of accommodation and food
services and transportation and storage during this
Manufacturing 4.5% -0.5 -0.1 0.43 -0.87 -0.44
period are explained by both deterioration in productivity
Construction 3.9% -0.6 -0.1 0.25 -0.81 -0.56
Bottom 5 growth (negative intra-industry productivity effect) and a
Administrative and support-
-1.8% -0.7 -0.3 -0.10 -0.54 -0.64 reduction in size (negative allocation effect). Meanwhile,
service activities
the negative contributions of administrative and
Accommodation and food-service
activities
-11.9% -1.2 -0.2 -0.36 -0.82 -1.18 support service activities, construction and
manufacturing are a result of their reduction in size.
Note: (1)Chain volume measure (CVM) prices.
Source: Own computation based on data from the UK Office for National Statistics.
23Chart 1.8. Sectoral productivity: international comparison
Labour productivity growth in selected countries, 1998–2017
Output per worker (average annual growth rate, 1998–2017)
Economic sector
China France Germany Korea Singapore Taiwan US UK
6.8% 3.3% 3.3% 4.5% N/A N/A 2.9% 2.4%
▪ Between 1998 and 2017 China and Korea
Agriculture, forestry and fishing
Mining and quarrying 11.6% 4.8% 4.2% 3.6% N/A 1.1% 2.6% -2.8% experienced the strongest productivity growth
Manufacturing 8.3% 2.5% 3.0% 7.0% 7.0% 6.0% 3.7% 2.5% among the eight economies studied (8.9% and
Electricity, gas, steam and air-
conditioning supply
N/A 2.4% 3.9% N/A N/A 2.8% N/A 0.1% 5.1% on average per year, respectively).
Water supply; sewerage, waste
management and remediation
N/A 2.0% 2.7% N/A N/A 2.5% N/A 0.2% ▪ The UK showed the lowest productivity growth rate
Construction 6.9% 2.7% 2.1% 4.5% 1.7% -0.2% -0.9% 0.5% in this period. However, some UK sectors
Information and communication N/A 1.4% 1.6% 4.1% 1.1% 5.0% 6.5% 4.0% performed relatively better. Service sectors in which
Financial and insurance activities 6.7% 3.0% 2.9% 6.0% 4.5% 2.0% 2.3% 3.4%
Professional, scientific and technical
the UK may have comparative advantages include
N/A 2.2% -0.7% 3.2% -1.0% 1.0% 1.4% 2.3% (average annual growth rate in brackets):
activities
Education N/A 2.3% 1.1% 4.1% N/A 1.2% -0.4% -1.2% information and communication (4.0%);
Wholesale and retail trade; repair of
motor vehicles and motorcycles
7.1% 1.7% 2.4% 6.0% 4.0% 2.2% 2.1% 1.4% financial and insurance activities (2.3%);
Transportation and storage 7.3% 2.4% 1.9% 4.6% 1.0% 2.7% 0.6% 0.4% professional, scientific and technical activities
Accommodation and food-service (2.3%); and administrative and support services
N/A 2.1% 1.2% 4.7% 1.6% -1.8% 0.0% 0.4%
activities
Real estate activities N/A 3.4% 1.2% 2.4% 0.8% 2.3% 1.9% -1.3% (2.3%).
Administrative and support-service
activities
N/A 1.0% 0.4% 2.4% 7.6% 0.4% N/A 2.3% ▪ In contrast, UK market sectors that performed
Public administration and defence;
N/A 2.6% 2.7% 5.0% N/A N/A 0.0% 0.5% relatively worse than those in other countries in the
compulsory social security
Human health and social activities N/A 2.7% 1.6% 1.1% N/A -1.2% 0.6% 1.3%
reference period include (average annual growth
Arts, entertainment and recreation N/A 2.0% 1.0% N/A N/A 0.6% 0.6% -0.5% rate in brackets): mining and quarrying (-2.8%);
Activities of households N/A 0.1% 1.5% N/A N/A N/A N/A 5.9% transportation and storage (0.4%); wholesale
Other service activities 6.9% 1.8% 0.8% 3.3% 0.9% 2.4% -1.2% -0.1%
and retail trade (1.4%); and manufacturing
Whole economy 8.9% 2.2% 1.7% 5.1% 3.1% 2.7% 1.6% 1.2%
(2.5%).
Note: N/A not available. *2010–17 annual average is computed for Singapore.
Source: APO Productivity Database 2020 Ver.1 (5 August 2020); OECD STAN Industrial Analysis (2020 ed.); Singapore
Department of Statistics; Singapore Ministry of Trade and Industry; Manpower Research and Statistics Department; Taiwan
Statistical Bureau; UK Office for National Statistics; US Bureau of Economic Analysis and US Bureau of Labor Statistics. 24Chart 1.9. Structural change: international comparison
Output shares in selected countries, 1998 and 2017 ▪ The shrinking of manufacturing is a major structural
change observed in most of the economies examined
Agriculture, Knowledge-
Mining and Other between 1998 and 2017.
Country Year forestry and
quarrying
Manufacturing Utilities Construction intensive
services
fishing services
▪ The biggest declines in manufacturing shares were
1998 19.5% 4.2% 34.9% 2.0% 6.1% 8.8% 24.5% recorded in (changes in percentage points in brackets):
China 2017 7.9% 2.6% 29.3% 2.0% 6.7% 14.5% 36.9% Singapore (-8.6), the UK (-5.9%) and China (-5.6). There
Change -11.6 -1.7 -5.6 0.0 0.6 5.7 12.5 have, however, been some exceptions. Manufacturing
1998 2.7% 0.2% 16.2% 2.9% 5.0% 14.9% 58.1% output shares expanded in Germany (0.7), Korea (3.6) and
France 2017 1.7% 0.1% 11.2% 2.4% 5.6% 17.0% 61.9% Taiwan (7.4). And while Singapore reported the largest
Change -1.0 -0.1 -5.0 -0.5 0.6 2.1 3.8 decline in manufacturing output shares among the countries
1998 1.1% 0.3% 22.1% 3.0% 6.4% 15.2% 51.9%
examined (-8.6), this trend has been reverted in the years
Germany 2017 0.9% 0.1% 22.8% 2.8% 4.7% 15.0% 53.6%
since 2017.
Change -0.2 -0.2 0.7 -0.2 -1.7 -0.1 1.7
1998 5.2% 0.3% 25.9% 2.1% 9.2% 15.4% 41.9% ▪ Meanwhile, service activities have expanded in most of the
Korea 2017 2.0% 0.1% 29.5% 2.4% 6.0% 16.3% 43.6% countries analysed. This is true for both knowledge-
Change -3.2 -0.2 3.6 0.3 -3.2 0.9 1.8 intensive services and other services (see note).
2005 N/A N/A 29.3% N/A 3.1% 19.4% 46.6%
Singapore 2017 N/A N/A 20.6% N/A 4.2% 23.7% 50.2% ▪ The largest expansions in output shares of knowledge-
Change N/A N/A -8.6 N/A 1.1 4.3 3.6 intensive activities were seen in (changes in percentage
1998 2.4% 0.3% 26.1% 2.8% 4.1% 13.7% 50.5% points in brackets): China (5.7), Singapore (4.3) and the UK
Taiwan 2017 1.9% 0.1% 33.5% 2.0% 2.4% 12.2% 48.1% (4.1). Other service activities have also expanded,
Change -0.6 -0.2 7.4 -0.8 -1.7 -1.6 -2.4 changes range from 1.7 percentage points in Germany to
1998 1.1% 0.9% 15.8% 1.8% 4.2% 17.8% 58.4% 12.5 in China.
US 2017 0.9% 1.4% 11.2% 1.6% 4.1% 20.3% 60.5%
Change -0.2 0.5 -4.6 -0.2 -0.1 2.5 2.1
1998 1.1% 1.5% 16.1% 2.9% 5.5% 17.0% 56.0%
Note: Knowledge-intensive services group together information and communication, financial and
UK 2017 0.6% 0.9% 10.2% 2.7% 6.5% 21.1% 57.9% insurance activities, professional, scientific and technical activities, and education, with the
Change -0.4 -0.6 -5.9 -0.1 1.0 4.1 1.9 exception of China, which only groups financial and insurance activities. Other services include:
wholesale and retail, transportation and storage, accommodation and food-service activities, real
estate activities, administrative and support-service activities, public administration and defence,
Source: APO Productivity Database 2020 Ver.1 (5 August 2020); OECD STAN Industrial Analysis (2020 ed.); Korea human health and social work activities, arts, entertainment and recreation, and other service
Productivity Center; Singapore Department of Statistics; Singapore Ministry of Trade and Industry; Manpower Research & activities, with the exception of China, which groups wholesale and retail, transportation and
Statistics Department; Taiwan Statistical Bureau; UK Office for National Statistics; US Bureau of Economic Analysis and US storage, and community, social and personal services. 25
Bureau of Labor Statistics..Chart 1.10. Sectoral contribution to aggregate productivity growth:
international comparison (1/2)
Decomposition based on output per worker measures, selected countries, 1998–2017
▪ As a result of its high productivity growth rates and
Intra-industry productivity growth effect
(Annual average 1998-2017)
relatively large output shares, manufacturing is one of the
Economic sector China France Germany Korea* Singapore** Taiwan US UK sectors with the largest contributions to aggregate
Agriculture, forestry and
fishing 0.74 0.07 0.03 0.10 N/A 0.03 0.02
productivity growth in the best-performing countries.
-0.11
Mining and quarrying 0.51 0.01 0.01 0.00 0.00 0.06 -0.06
Utilities 0.31 0.06 0.09 0.12 0.06 0.03 0.00 ▪ Manufacturing was responsible for around 30% of the
Manufacturing 2.66 0.35 0.63 1.61 1.50 1.82 0.51 0.33 aggregate productivity growth in China and almost half of
Construction 0.42 0.14 0.09 0.22 0.10 0.00 -0.04 0.03
Knowledge intensive services 0.69 0.47 0.23 0.50 0.52 0.44 0.55 0.52
the productivity growth recorded in Taiwan during the
Other services 2.23 1.29 0.82 1.52 1.34 0.76 0.60 0.21 period 1998–2017. Manufacturing also contributed to
Whole economy 7.56 2.38 1.90 4.06 3.34 3.03 1.74 1.05
Allocation effect
around 30% of the aggregate productivity growth in
(Annual average 1998-2017) Korea between 2005 and 2017 and 15% of the
Economic sector China France Germany Korea* Singapore** Taiwan US UK productivity growth in Singapore between 2010 and
Agriculture, forestry and
fishing -0.25 -0.07 -0.03 -0.09 N/A -0.04 -0.04 2017.
0.13
Mining and quarrying -0.17 -0.01 -0.01 0.00 -0.01 -0.02 0.03
Utilities 0.00 -0.02 -0.05 -0.03 -0.04 -0.02 0.03 ▪ In contrast, manufacturing had a negative contribution to
Manufacturing -0.12 -0.31 -0.21 -0.24 -1.02 -0.67 -0.55 -0.50
Construction 0.16 0.02 -0.08 -0.03 -0.15 -0.04 0.12 0.11
aggregate productivity growth in the UK during this
Knowledge intensive services 0.55 0.10 0.11 0.19 0.29 -0.23 -0.06 0.03 period, mainly due to a reduction in its participation in the
Other services 1.21 0.08 0.09 0.39 0.54 0.38 0.39 0.43 economy (as reflected in a negative allocation effect of -
Whole economy 1.34 -0.21 -0.18 0.19 -0.22 -0.61 -0.19 0.10
Total contribution to productivity growth 0.5 on average).
(Annual average 1998-2017)
Economic sector China France Germany Korea* Singapore** Taiwan US UK ▪ This means that the loss of manufacturing has imposed a
Agriculture, forestry and
fishing 0.49 0.00 0.01 0.00 N/A 0.00 -0.01
penalty on UK productivity growth of half a percentage
0.00
Mining and quarrying 0.33 0.00 0.00 0.00 -0.01 0.04 -0.03 point per year between 1998 and 2017.
Utilities 0.31 0.04 0.04 0.09 0.02 0.01 0.03
Manufacturing 2.54 0.03 0.42 1.37 0.48 1.15 -0.04 -0.17 ▪ Another distinctive feature of the UK economy is a lower
Construction 0.59 0.16 0.01 0.19 -0.06 -0.04 0.07 0.14
Knowledge intensive services 1.24 0.57 0.34 0.69 0.81 0.21 0.49 0.55
intra-industry productivity growth effect (due to lower
Other services 3.44 1.37 0.91 1.91 1.88 1.14 0.99 0.65 productivity growth) than the other countries analysed
Whole economy 8.90 2.17 1.72 4.26 3.12 2.43 1.55 1.15
across most sectors.
Note: Decomposition based on output per worker. Figures may not add up to total because of rounding. *For Korea, the 2005–17 the annual average
is computed; ** for Singapore 2010-17 the annual average is computed. 26
Source: Authors’ computation based on data from APO Productivity Database 2020 Ver.1 (5 August 2020); OECD STAN Industrial Analysis (2020
ed.); Korea Productivity Center; Singapore Department of Statistics; Singapore Ministry of Trade and Industry; Manpower Research & Statistics
Department; Taiwan Statistical Bureau; UK Office for National Statistics; US Bureau of Economic Analysis and US Bureau of Labor Statistics.Chart 1.10. Sectoral contribution to aggregate productivity growth:
international comparison (2/2)
Decomposition based on output per worker measures, selected countries, 1998–2017
Intra-industry productivity growth effect
▪ Across the countries studied, the contraction of the
(Annual average 1998-2017) manufacturing sector has been mirrored by a
Economic sector China France Germany Korea* Singapore** Taiwan US UK
Agriculture, forestry and
greater contribution of services to aggregate
fishing 0.74 0.07 0.03 0.10
-0.11
N/A 0.03 0.02 productivity growth.
Mining and quarrying 0.51 0.01 0.01 0.00 0.00 0.06 -0.06
Utilities 0.31 0.06 0.09 0.12 0.06 0.03 0.00 ▪ Between 1998 and 2017, the contribution of
Manufacturing 2.66 0.35 0.63 1.61 1.50 1.82 0.51 0.33
Construction 0.42 0.14 0.09 0.22 0.10 0.00 -0.04 0.03
knowledge-intensive services was positive in all
Knowledge intensive services 0.69 0.47 0.23 0.50 0.52 0.44 0.55 0.52 countries analysed (ranging from 0.2 in Taiwan to 0.55
Other services 2.23 1.29 0.82 1.52 1.34 0.76 0.60 0.21
Whole economy 7.56 2.38 1.90 4.06 3.34 3.03 1.74 1.05
in the UK and 1.2 in China). The positive contribution
Allocation effect of knowledge-intensive services is mainly explained
(Annual average 1998-2017) by high productivity growth rates (as reflected in
Economic sector China France Germany Korea* Singapore** Taiwan US UK
Agriculture, forestry and positive intra-industry productivity growth effects).
fishing -0.25 -0.07 -0.03 -0.09 N/A -0.04 -0.04
Mining and quarrying -0.17 -0.01 -0.01 0.00
0.13
-0.01 -0.02 0.03 ▪ In comparison, other services contributed less to
Utilities 0.00 -0.02 -0.05 -0.03 -0.04 -0.02 0.03
Manufacturing -0.12 -0.31 -0.21 -0.24 -1.02 -0.67 -0.55 -0.50
aggregate productivity growth in the UK than they did
Construction 0.16 0.02 -0.08 -0.03 -0.15 -0.04 0.12 0.11 in the other seven countries during this period. The
Knowledge intensive services 0.55 0.10 0.11 0.19 0.29 -0.23 -0.06 0.03 contribution of other services to UK productivity
Other services 1.21 0.08 0.09 0.39 0.54 0.38 0.39 0.43
Whole economy 1.34 -0.21 -0.18 0.19 -0.22 -0.61 -0.19 0.10 growth was 0.65, compared to 3.44 in China, 1.91 in
Total contribution to productivity growth Korea and 1.88 in Singapore.
(Annual average 1998-2017)
Economic sector China France Germany Korea* Singapore** Taiwan US UK
Agriculture, forestry and
fishing 0.49 0.00 0.01 0.00 N/A 0.00 -0.01
0.00
Mining and quarrying 0.33 0.00 0.00 0.00 -0.01 0.04 -0.03
Note: Knowledge-intensive services group together information and communication, financial
Utilities 0.31 0.04 0.04 0.09 0.02 0.01 0.03
and insurance activities, professional, scientific and technical activities, and education, with the
Manufacturing 2.54 0.03 0.42 1.37 0.48 1.15 -0.04 -0.17 exception of China, which only groups financial and insurance activities. Other services include:
Construction 0.59 0.16 0.01 0.19 -0.06 -0.04 0.07 0.14 wholesale and retail, transportation and storage, accommodation and food-service activities,
Knowledge intensive services 1.24 0.57 0.34 0.69 0.81 0.21 0.49 0.55 real estate activities, administrative and support-service activities, public administration and
Other services 3.44 1.37 0.91 1.91 1.88 1.14 0.99 0.65 defence, human health and social work activities, arts, entertainment and recreation, and other
Whole economy 8.90 2.17 1.72 4.26 3.12 2.43 1.55 1.15 service activities, with the exception of China, which groups wholesale and retail, transportation
and storage, and community, social and personal services.
Note: Decomposition based on output per worker. Figures may not add up to total because of rounding. *For Korea, the 2005–17 the annual average
is computed; ** for Singapore 2010-17 the annual average is computed. 27
Source: Authors’ computation based on data from APO Productivity Database 2020 Ver.1 (5 August 2020); OECD STAN Industrial Analysis (2020
ed.); Korea Productivity Center; Singapore Department of Statistics; Singapore Ministry of Trade and Industry; Manpower Research & Statistics
Department; Taiwan Statistical Bureau; UK Office for National Statistics; US Bureau of Economic Analysis and US Bureau of Labor Statistics.Theme 2: Investment in innovation
UK INNOVATION REPORTTheme 2: Policy questions and key messages
▪ Is the UK spending enough on R&D?
▪ How do the public and private sectors contribute to national expenditure on innovation?
▪ How does the UK compare with other countries?
The UK spends less on R&D than the OECD average; a significant increase in public funding for R&D has been announced but
delayed
▪ At 1.74%, the UK’s gross domestic expenditure on R&D (GERD) remains well below the 2019 OECD average of 2.5%.
▪ The UK’s expenditure on R&D has risen steadily over the past decades but, as a proportion of GDP, its growth has been slower than the OECD average.
▪ The UK government has committed to investing £22 billion in R&D by 2026/27 (pushing back the original target date of 2024).
Compared to other countries, the business sector in the UK contributes less to R&D funding; universities perform
significantly more of the country’s R&D and the government significantly less
▪ In the UK the business sector funds around 55% of R&D – less than in Germany (64.5%), Korea (76.9%) and Japan (78.9%).
▪ The UK’s higher education sector stands out from comparator countries, performing 23.1% of the country’s R&D in 2019, compared to 20.1% France and
17.4% in Germany.
▪ The government sector in the UK performs only 6.6% of R&D, well below comparator countries.
Very few firms headquartered in the UK are global leaders in R&D investment and patent applications
▪ Only two companies headquartered in the UK are among the top 100 R&D investing firms in 2020.
▪ Among the top 2,500 R&D investing firms in the world, only 105 were UK-based in 2020 (779 are based in the USA, 597 in China, 293 in Japan and 124 in
Germany).
▪ There were no firms headquartered in the UK among the top 100 patent applicants at the United States Patent and Trademark Office (USPTO) in 2020.
29You can also read