Spring 2022 - Economic Outlook Calgary and Region
←
→
Page content transcription
If your browser does not render page correctly, please read the page content below
Spring 2022

 Calgary and Region
Economic Outlook
    2022-2027
Table of Contents

    Calgary Economic Region Map..................................................................................................................................................3
    Introduction................................................................................................................................................................................5
    Executive Summary....................................................................................................................................................................6
    Forecast Implications.................................................................................................................................................................8
    Context......................................................................................................................................................................................10
      Two years later, the COVID-19 recovery remains challenging, even as severity wanes and immunity improves.......................... 10
      The Economic Recovery of the Contact-Intensive Services-Producing Sector in 2022........................................................................... 11
      Tightening Monetary Policy as Inflation Poses Challenges............................................................................................................................... 11
    Assumptions and Risks............................................................................................................................................................12
      Forecast Assumptions...................................................................................................................................................................................................... 12
      Forecast Risks...................................................................................................................................................................................................................... 13
      Risk Scenarios..................................................................................................................................................................................................................... 13
    Forecast.....................................................................................................................................................................................15
      City of Calgary.................................................................................................................................................................................................................... 15
        Population........................................................................................................................................................................................................................ 15
        Textbox 1. Why The City Population Estimate differs from the Federal Census...................................................................................... 16
        Residential Real Estate Market.................................................................................................................................................................................. 17
        Building Permits............................................................................................................................................................................................................. 18
        Textbox 2. Is there a housing affordability problem on the horizon for the city? A historical supply-side review.................... 19
      Calgary Census Metropolitan Area (CMA)................................................................................................................................................................ 21
        Consumer Price Index (CPI) Inflation ..................................................................................................................................................................... 21
        Non-residential Building Price Inflation ............................................................................................................................................................... 21
      Calgary Economic Region (CER)................................................................................................................................................................................... 22
        Real GDP Growth in the CER...................................................................................................................................................................................... 22
        CER’s Labour Market..................................................................................................................................................................................................... 22
        Textbox 3. Calgary’s Budding Technology (Tech) Sector Holds Promise................................................................................................... 24
      Commodity Price Inflation Rates................................................................................................................................................................................. 25
        Shocks and Shortages.................................................................................................................................................................................................. 25
        Construction Commodity Price Inflation.............................................................................................................................................................. 25
        Operational Commodity Price Inflation................................................................................................................................................................ 26
    Economic and Market Conditions Outside Calgary...............................................................................................................29
      Energy Markets................................................................................................................................................................................................................... 29
        World Crude Oil Market............................................................................................................................................................................................... 29
        North American Natural Gas Market...................................................................................................................................................................... 30
      Alberta................................................................................................................................................................................................................................... 30
        Economic Recovery in Alberta.................................................................................................................................................................................. 30
        Alberta’s Labour Market.............................................................................................................................................................................................. 31
        Residential Investment in Alberta........................................................................................................................................................................... 31
      Canada.................................................................................................................................................................................................................................. 33
        Real GDP Growth .......................................................................................................................................................................................................... 33
        Labour Market ............................................................................................................................................................................................................... 33
        Monetary Policy and Inflation Rate......................................................................................................................................................................... 33
      The U.S................................................................................................................................................................................................................................... 34
        Real GDP Growth .......................................................................................................................................................................................................... 34
        Labour Market................................................................................................................................................................................................................ 35
        Monetary Policy Measures......................................................................................................................................................................................... 35
      The World............................................................................................................................................................................................................................. 37
        Real GDP Growth .......................................................................................................................................................................................................... 37
        Trade Volume Changes ............................................................................................................................................................................................... 37
        CPI Inflation .................................................................................................................................................................................................................... 37
    Forecast Tables.........................................................................................................................................................................38
    Glossary.....................................................................................................................................................................................43
    Who We Are...............................................................................................................................................................................46

2                                                                                                                         Calgary and Region Economic Outlook 2022-2027 | Spring 2022
he specialized
 on region
growth       specialized
       affected            in? property tax revenue base?
                  in?municipality’s
                the
        Calgary
 chgrowthCalgary
    affected      Economic
           affected  Economic
                    the         Region
                        municipality’s
             the municipality’s           Map
                                     Region
                                       property
                                property tax      Map
                                                 tax
                                             revenue revenue
                                                       base? base?
nomic Region
onomic
mic     Region
 cated in one
              Region                                                                                                                             Trochu
                                                Sundre                               Olds
 ir customers live
uals live in one                                                                                                                             Three Hills
  located
din     one inAlso,
    inanother.    one                                                            Didsbury
g   events   generally                           Sundre      Sundre                                              Olds
heir
 tomers customers
             live     live                                                                        Olds
  er than a local                                                                    Carstairs
 iduals
 ve        live in one
       in one
  ements are common
  rk  insociety,
  other.
 dern     another.   Also,
            Also,where                                                                      Didsbury Didsbury
 ing    events
  nts generally
omic    and socialgenerally                                                              Crossfield
The
antherageographic
          than a local
         local                                                                                    Carstairs     Carstairs Irricana
r by various
ngements
nts             are common
       are common                                                                           Airdrie
mmunication links.
modern
 society,society,
          where where                                    Cochrane

 nomic
 and    and social
     social                                                                                           Crossfield Crossfield
m.eographic
   The geographic
                                                                                                              Chestermere                  Irricana
                                                                                                                                      Strathmore           Irricana
her by various
 arious                                                                                                    Airdrie       Airdrie
 ommunication
 nication links. links.                                     Tsuu T’ina Nation

                                                             Cochrane Cochrane

                                                                                                 Okotoks
                                                                                                                                     Chestermere
                                                                                                                            Chestermere                        Strathm
           Legend                                                      Black Diamond

                    Calgary Economic Region                          Turner Valley
                    Calgary Metropolitan Area                                   Tsuu T’ina NationHigh River
                                                                    Tsuu T’ina Nation
                    City of Calgary

                                                                                                                                                Vulcan

                                                                                                                Nanton
                                                                                                    Okotoks                 Okotoks
       Legend Legend                                                                      Black Diamond
                                                                                Black Diamond

            +      + Economic
                 Calgary CalgaryRegion
                                 Economic Region (CER)                           Calgary’s Economic Performance 2001-2015
                                                                         Turner Valley
                                                             Turner Valley
                                                                                                                                                       1

                   + Metropolitan
                 Calgary Calgary Census
                                   Area Metropolitan Area (CMA)                               High River High River
                             City of Calgary
                 City of Calgary

       Calgary and Region Economic Outlook 2022-2027 | Spring 2022                                                                                         3
Executive Summary

4                   Calgary and Region Economic Outlook 2022-2027 | Spring 2022

Introduction
Preamble How many jobs is the Calgary Economic Region (CER)
expected to create?
The City of Calgary tracks economic indicators throughout the
year to develop insights into the impacts of external events on What is the forecast for population growth in the City of
the local economy. The results from this process are published Calgary and the CER?
semi-annually (one in the spring and one in the fall) as the Cal- What is the expected consumer price inflation in the
gary and Region Economic Outlook (the Outlook). Calgary Census Metropolitan Area?
What are the implications of the forecast, and how will it
The Outlook presents forecasts for a selected number of eco-
impact municipal finance?
nomic variables. It provides an analysis of those factors that are
considered most likely to have a significant effect on the local Calgary as a small open economy
economy over the forecast period.
Calgary is a small open economy, and therefore is affected by
changes outside its borders. The growth of Calgary’s local econ-
Purpose omy is driven by its participation in international trade, espe-
We create and publish this outlook to assist The City of Calgary cially the exports of Alberta’s crude oil and other commodities
in the financial and physical planning of the city. The forecast to the outside markets. Compared to their trade partners, Cal-
enables the municipal government to take into consideration gary and Alberta are small players and cannot influence global
the current economic conditions and po-tential economic out- commodity prices. The volatility of crude oil prices in the world
look to prudently and responsibly plan the financial path for- market affects Calgary’s economic growth and job market con-
ward while understanding risks and opportunities. dition relative to the rest of Canada.
The Outlook presents a comprehensive economic analysis of Our forecast is also dependent on the economic and market
Calgary’s local economy, which most other economic reports conditions outside the CER over the forecast period. The critical
exclude. Unlike most research institutions’ reports, which re- external forces are as follows:
strict their analyses to the national or provincial economy and a
few urban areas within the provinces, this Outlook answers the 1. 1. Forces driving change in world economic expansion or
following key questions: contraction, such as the duration of the COVID-19 pan-
demic and the Russia-Ukraine war.
What is the overall forecast for the rate of growth of Cal-
2. 2. Change to the rate of economic growth and job cre-
gary’s local economy?
ation in the rest of Canada over the forecast period.
What are the drivers of Calgary’s local economy?
Calgary’s Growth Drivers: Gross Domestic Product (GDP) Growth (Left) vs. West Texas Intermediate
ry's Growth(WTI)
Drivers:
Calgary's Growth
Oil Prices
GDP (Right)
Growth Drivers:
(Left) vs.
(1988-2021 WTIGrowth
GDP
Actual, (Right) (Left)
2022-2027 vs. WTI
Forecast)
(1988-2020 Calgary's
(Right)
Actual, 2021-2026 Growth
Forecast)
(1988-2020 Drivers:
Actual, GDP
2021-2026 Growth (Left) vs. WTI (Right) (1
Forecast)
t) WTIcent)
(per (Right) Canada Alberta (per cent)(CER)
Calgary (US$/bbl)
WTI (Right) (US$/bbl)
Canada Alber
15 15 125 125
FORECAST
10 10 100 100
5 5 75 75
0 0 50 50
-5 -5 25 25
-10 -10 0 0
8 1990 1992 1994 1996
1988 1998 2000
1991 Recession
2002
1994 2004 periods
2006
1997 2008
2000 2010
20032012 2014
2006 2016
2009 20181988
2020
2012 1990
2022
1992
2015 2024
19942026
2018 1996 1998
2021 2000
2024 2002 2004
2027 2006 2008 2010 2
(per cent) (per cent) (US$/bbl) (US$/bbl)
WTI (Right) World The U.S. Canada WTI (Right) World T
15 15 125 125
10 10 100 100
5 5 75 75
0 0 50 50
-5 -5 25 25
-10 -10 0 0
1990 1992 1994 1996
1988 1998 1991
2000 2002
1994 20041997
2006 2008
2000 201020032012 2006
2014 201620092018 2012
2020
1988 2022
1990
20152024
1992 2018
2026
1994 1996
2021 1998 2024
2000 2002
2027 2004 2006 2008 2010
Calgary and Region Economic Outlook 2022-2027 | Spring 2022 5
Executive Summary

Canada, Alberta, and Calgary started economic recovery in                   flict between Russia and Ukraine, which began in late February
2021. Economic growth is expected to continue into 2022                     2022, will also add upward pressure on energy commodities
against the backdrop of high inflation, elevated energy prices,             and food prices and dampen global growth prospects.
increased vaccination against COVID-19 and variants across the
globe, and an ongoing war between Russia and Ukraine. The                   We expect to see employment in the Calgary Economic Region
Bank of Canada has commenced a more aggressive monetary                     finally exceed the pre-pandemic 2019 employment level in
stance to rein in inflation and the implications are still unfold-          2022, growing by as much as 4.1 per cent or 36,000 persons
ing. Lower hospitalization rates and higher vaccination uptake              above the 2021 annual employment level. Inflation in Calgary
across the globe have prompted a relaxation of most public                  is expected to remain elevated into 2022, increasing from 3.2
health-related measures. The public health relaxations in some              per cent in 2021 to 5.6 per cent this year as supply disruptions
regions have contributed to more robust regional demand as                  persist and some semblance of demand of the pre-pandem-
business activities return to some degree of normalcy. Though               ic era returns. However, inflation should wane as the Bank of
global supply chain constraints persist due to varying degrees              Canada’s monetary policy stance in 2022 wrestles inflation to
of pandemic-variant disruptions, among others, the advent of                2.6 per cent by 2023. The City of Calgary’s population is expect-
the Russia-Ukraine war has contributed to increasing uncertain-             ed to grow by 1.7 per cent, or over 22,000 persons, in 2022,
ty surrounding the global supply chain.                                     as prospects for employment opportunities strengthen. The
                                                                            City’s population is then expected to increase by an average of
Canada is expected to see growth in real GDP of 3.8 per cent                22,000 persons per year over the forecast horizon 2023-2027.
in 2022, as a sizable portion of the services-producing sector              The total new houses started in the city are expected to mim-
(such as food and accommodation) returns to more normal                     ic 2021 levels of about 12,700 units in 2022 and normalize at
operations after the pandemic health-related measures dis-                  about 11,000 houses started per year over the forecast horizon.
proportionately impacted their industry. In Alberta and Cal-                Total building construction investments in the city are expect-
gary, real GDP growth is expected to reach 5.7 per cent and 5.5             ed to be over $6 billion in 2022, on the back of expected higher
per cent, respectively, aided by elevated energy prices in 2022             population growth, sustained housing demand and expected
and the larger presence of the resource sector. Employment is               stronger employment growth in 2022. The challenges of new
expected to grow at a rate above the pre-pandemic five-year                 COVID-19 variants emerging and the ongoing war between
historical average growth rate in Alberta and Calgary over the              Russia and Ukraine will exacerbate risks to the current forecast.
forecast horizon. The average annual West Texas Intermediate                The economic challenges across regions will vary as the poli-
oil price increased by US$29 per barrel in 2021 from 2020 as                cy prescription and success of vaccinations against COVID-19
pandemic health-related measures eased. It is expected to rise              have varied across countries, coupled with export disruptions
by as much as US$32 per barrel more in 2022. The ongoing con-               caused by the war and economic sanctions against Russia.

    Real GDP Growth for 2022:                     West Texas
                                                 Intermediate                US$32 /bbl
                                                                                                        CER Employment for
                                                                                                              2022                      + 31.4
                                                                                                                                           thousand
                                                                                                                                                (2023)
    Calgary CER                         5.5%                    US$29 /bbl

         Alberta                        5.7%                         US$        US$          US$
                                                                     39.2       68.1       100.2
         Canada                  3.8%                                /bbl       /bbl        /bbl
                                                                     2020      2021         2022                 897,400

    Calgary CMA                                 City of Calgary                                       City of Calgary                 Total Building
                                2023   2.6%     Population for 2022          1,343,500                                                Permit Value
    Inflation Rate                                                                                    Housing Starts
                                                                                                         12.7 11.5                       2022
                                                                                                      2022

                                                                                                                        2023

                                2022   5.6%                                                                  thousand      thousand      $6.1
                                                                                                                                          billion
                                                                                   22,200                                                      2023
                                2021   3.2%                                               from 2021                                       $6.1 billion

6                                                                       Calgary and Region Economic Outlook 2022-2027 | Spring 2022
Executive Summary
Forecast Table:                                              Actual         Estimate                                              Forecast
Selected Key Indicators                                       2021           2022                2023              2024            2025             2026           2027
 World: GDP (%)                                                6.1            3.6                    3.6             3.4            3.4              3.3            3.3
 The U.S.: GDP(%)                                              5.7            3.7                    2.5             1.8            1.7              1.7            1.7
 Canada: GDP (%)                                               4.6            3.8                    2.9             1.8            1.6              1.7            1.8
 Alberta: GDP (%)                                              6.0            5.7                    2.4             1.8            1.9              1.7            1.8
 Calgary Economic Region: GDP (%)                              4.2            5.5                    3.6             2.2            2.2              2.2            2.1
 Calgary Economic Region: Unemployment Rate (%)                9.1            7.7                    6.9             6.4            5.9              5.5            5.2
 Calgary Census Metropolitan Area: CPI (%)                     3.2            5.6                    2.6             1.8            2.0              2.0            2.2
 City of Calgary: Total Building Permits ($billion)            5.7            6.1                    6.1             5.9            6.0              6.2            6.3
 City of Calgary: Total Population ('000 persons)            1,321.3*       1,343.5*            1,366.2         1,388.9           1,409.7          1,431.5        1,454.4
 City of Calgary: Housing Starts ('000 units)                 12.7            12.7               11.5              10.5             10.4            10.6           10.6
* Estimates from Corporate Economics’ Population Model.

 Calgary Economic Region: Real
                          TotalGDP
                                Employment
                                   Growth                                        Calgary Economic Region: Total
                                                                                                          Employment
                                                                                                                Employment
                                                                                                                      Growth
 (thousands
 (per cent) of persons)                                                          (thousands of persons)
  8                                                                                      60                Spring 2022
                Spring 2022                       FORECAST                                                                                         FORECAST
  4             Fall 2021                                                                30                Fall 2021

  0                                                                                       0
 -4                                                                                  -30
 -8                                                                                  -60
       2017         2019        2021       2023       2025           2027                      2017           2019          2021           2023            2025      2027
Source: Statistics Canada, Corporate Economics.                                  Source: Statistics Canada, Corporate Economics.

 Calgary CMA:
         Economic
              Inflation
                   Region:
                        RateTotal Employment                                     City of Calgary: Population
 (thousands
 (per cent) of persons)                                                          (thousands of persons)
  6                                                                                  1,500
                 Spring 2022                      FORECAST                                                  Spring 2022                            FORECAST
                 Fall 2021                                                                                  Fall 2021
  4                                                                                  1,400

  2                                                                                  1,300

  0                                                                                  1,200
       2017         2019        2021       2023       2025           2027                        2017          2019         2021            2023           2025      2027
Source: Statistics Canada, Corporate Economics.                                  Source: The City of Calgary, Corporate Economics.

 City of Calgary: Housing Starts                                                 City of Calgary: Total Building Permit Value
 (thousands of units)                                                            (billions of dollars)
  15                                                                                 7
                  Spring 2022                                                                              Spring 2022                             FORECAST
                                                  FORECAST
                  Fall 2021                                                          6                     Fall 2021
  12
                                                                                     5
   9                                                                                 4
   6                                                                                 3
       2017         2019        2021       2023       2025           2027                     2017          2019           2021            2023        2025          2027
Source: CMHC, Corporate Economics.                                               Source: Statistics Canada, Corporate Economics.

Calgary and Region Economic Outlook 2022-2027 | Spring 2022                                                                                                                 7
Forecast Implications
Averages: Current (2019 to 2022) vis-à-vis Forecast (2023 to 2026) Budget Cycle
                             Current          Next
                           Service Plans   Service Plans
Economic                    and Budget      and Budget
                               Cycle           Cycle
                                                                                           Forecast Implications
Indicator
                            2019-2022       2023-2026
                             Average         Average
Assumptions
World
                                                           Higher global growth also highlights the staggered global COVID-19 response recovery
                                                           from the different regions. The expected growing global demand pressures are positive
Real Gross Domestic                                        attributes to supporting growth in Canada, however, Canada's exposure to global trade
                                2.4             3.4
Product Growth (%)                                         is currently significantly tied to the United States, Canada's biggest trading partner. The
                                                           growth in global GDP and corresponding slow down in the United States GDP will have a
                                                           push and pull effect on Canada.
The United States
Real Gross Domestic                                        Reduction in demand for Canadian exports in next budget cycle as U.S. economic growth
                                2.1             1.9
Product Growth (%)                                         slows down. Canada's energy exports however expected to remain stable.
Canada
Real Gross Domestic                                        With the effects of the COVID-19 pandemic fading away, the average rate of economic
                                1.3             2.0
Product Growth (%)                                         growth in Canada will be higher in the next budget cycle, supporting interprovincial trade.
Prime Business Loan                                        After dropping to record lows in 2020 and 2021, interest rates will rise to more typical levels
                                3.0             4.1
Rate (%)                                                   during the next budget cycle, increasing The City's borrowing costs.
Exchange Rate                                              A mild increase in the value of the Canadian dollar in the next budget cycle will help to
                               0.77            0.79
(US$ for 1C$)                                              limit increases in the cost of imported goods.
Alberta
Real Gross Domestic                                        The City's next budget cycle will be supported by the recovery in the oil and gas sector, as
                                0.9             2.0
Product Growth (%)                                         the province is expected to benefit from higher oil and gas prices.
Total Employment                                           The demand for City services will increase in the next budget cycle as pace of job growth
                                0.8             1.9
Growth (%)                                                 increases.
Unemployment Rate                                          Reduced demand for social assistance programs from The City as the number of
                                8.6             6.0
(%)                                                        unemployed persons reduces.
Housing Starts                                             Relative stability in housing between current and next budget cycle, as relative affordability
                               29.7            29.9
('000 Units)                                               and international migration keeps demand steady.
                                                           Despite persistent inflation in the current cycle due to pent-up demand and volatile energy
                                                           markets, monetary policies by the Bank of Canada is expected to slow down consumer
Inflation Rate (%)              2.8             2.1
                                                           price growth in the next cycle . This is expected to reduce pressure on City revenue sources
                                                           as the risks of insufficient revenue reduces.
                                                           Oil prices are expected to remain significantly elevated in the next budget cycle in
West Texas Intermediate
                               66.1            79.5        comparison to the current cycle. This is due to a ramp-up in energy demand, compounded
- WTI (US$/bbl)
                                                           by geopolitical tensions that have led to volatile energy supply globally.
Western Canadian                                           Quality preferences and limited market access expected to be a contributing factor to
                               52.2            63.2
Select - WCS (US$/bbl)                                     slightly elevated WCS discount over the next cycle.
Alberta Natural Gas                                        An increase in natural gas prices likely to increase operational costs for businesses, cost of
                                3.0             3.4
Price - AECO/NIT ($/GJ)                                    living for households and increase in city franchise fees.
Industrial Product Price                                   Price growth for finished products will be lower than the previous budget cycle, as inflation
                                5.3             0.6
Index (%)                                                  and production costs subside after 2022, reducing inflationary pressure in The City.
Raw Materials Price                                        Raw material prices are expected to decline after 2022 an into the next budget cycle as
                                9.2            -0.5
Index (%)                                                  global supply chains stabilize and inflationary pressures die down within the region.
Alberta Average Annual                                     Higher wage growth in the next budget cycle will raise incomes as well as the cost of
                                0.9             1.8
Wage Rate Growth (%)                                       labour, contributing to inflationary pressure within the province and The City.

8                                                                         Calgary and Region Economic Outlook 2022-2027 | Spring 2022
Forecast Implications
Averages: Current (2019 to 2022) vis-à-vis Forecast (2023 to 2026) Budget Cycle
                             Current          Next
                           Service Plans   Service Plans
 Economic                   and Budget      and Budget
                               Cycle           Cycle
                                                                                           Forecast Implications
 Indicator
                            2019-2022       2023-2026
                             Average         Average
 Forecast
 Calgary Economic Region
                                                           While the pandemic-driven recession has created significant economic challenges in the
 Real Gross Domestic
                                1.4             2.6        current budget cycle, stable growth is expected for the region in the coming budget cycle,
 Product Growth (%)
                                                           supporting recovery in the non-residential tax base.
 Total Employment ('000                                    An increasing employed population will bring an increased consumer base and increase
                               868.6          960.5
 persons)                                                  demand for housing and services in the region.
                                                           Compared to the current budget cycle, which was impacted by the COVID-19 pandemic,
 Total Employment
                                1.2             2.6        the rate of employment growth will increase the rate of demand for City services and
 Growth (%)
                                                           infrastructure in the upcoming budget cycle.
 Unemployment Rate                                         A falling unemployment rate in the next budget cycle will increase the competition for
                                 8.9            6.2
 (%)                                                       skilled workers and reduce demand for social services that support the unemployed.
 Calgary Census Metropolitan Area (CMA)
 Housing Starts ('000                                      Housing investments in the Calgary area are expected to increase slightly in the coming
                                12.8           13.3
 units)                                                    budget cycle as growth in Calgary's neighbouring municipalities continues.
                                                           Following the high inflation of 2021-2022, increases in consumer prices will moderate in
 Inflation Rate (%)             2.8             2.1        the coming cycle. More stability in the cost of goods and services helps limit the risks of
                                                           cost overruns and budget adjustments.
 Non-Residential                                           Costs are expected to rise every year in the forecast, yet average a lower non-residential
 Building Construction          2.8             2.4        escalation in the next budget cycle. Previously, cost escalation would generally skip a year
 Inflation (%)                                             or more.
 City of Calgary
 Demography
 Total Population ('000
                                                           Larger total population means demand for municipal services would be higher and the
 Persons)                     1,314.2        1,399.1
                                                           residential property tax base would increase.
 at the end of the cycle
                                                           Calgary population continues to grow, from births as well as in migration. When the
 Total Population Growth
                                1.5             1.6        pandemic finally ends the City may find itself having to do a lot of catch-up to provide
 (%)
                                                           services to its larger population.
                                                           Following disruptions due to the COVID-19 pandemic in the current budget cycle, net
 Net Migration ('000
                               10.4            13.5        migration to Calgary is expected to pick up in the upcoming cycle, supporting demand for
 Persons)
                                                           housing.
 Household Formation                                       The higher household formation in the next budget cycle supports the narrative of a larger
                                7.0             8.6
 ('000 Units)                                              residential tax base and increased demand for City infrastructure and services.
 Real Estate
 Residential Market
                                                           Stable residential construction activity in the next business cycle will support increases in
 Housing Starts ('000
                               11.0            10.7        the residential tax base, development and building permit activity, and demand for the
 units)
                                                           continued expansion of City infrastructure.
 Average Residential
                                                           Home affordability in Calgary will remain challenging for new housing market entrants in
 MLS Sale Price (%              3.4             3.1
                                                           the upcoming cycle as price growth remains stronger than inflation.
 change)
                                                           Led by stable growth in residential and non-residential construction, as well as increases in
 Building Permits (city)
                                5.1             6.1        the price of real estate, higher building permit values in the next budget cycle will lead to
 ($billions)
                                                           increased revenues and demand for services.

Calgary and Region Economic Outlook 2022-2027 | Spring 2022                                                                                           9
Context          Two years later, the COVID-19 recovery
                 remains challenging, even as severity
                 wanes and immunity improves
                 After two years of grappling with COVID-19, the world
                 finally seems to be turning the corner. The rise in new
                 cases and deaths globally has slowed significantly since
                 the fourth pandemic wave towards the end of 2021. In
                 particular, while new COVID-19 cases rose by 11 per cent
                 in the first quarter of 2022, new COVID-related deaths in
                 the first quarter of 2022 have declined by 24 per cent.
                 In addition, the percentage of fully vaccinated persons
                 globally crossed the 50 percent mark in 2022. Using data
                 from the University of Oxford, by March 31, 2022, 58 per
                 cent of the global population was fully vaccinated, mark-
                 ing an 8.5 percentage point increase from 2021. Despite
                 the current pandemic wave in China and the subsequent
                 restrictions imposed in hot spots as a result, there ap-
                 pears to be a more optimistic long-term outlook on how
                 successful nations will be in containing the spread of the
                 virus.

                 Despite the current pandemic wave in China and the
                 subsequent restrictions in hot spots as a result, there ap-
                 pears to be a more optimistic long-term outlook on how
                 successful nations will be in containing the spread of the
                 virus.

                 On February 8, 2022, Alberta dropped its vaccine pass-
                 port mandates due to declining COVID-19 hospitaliza-
                 tions. On March 1, 2022, Alberta Premier Jason Kenney
                 announced the lifting of most public health measures,
                 including indoor masking mandates and capacity lim-
                 its. In the absence of the discovery of new COVID-19
                 variants, the economic risks associated with new public
                 health measures seem to outweigh the potential bene-
                 fits.

                 The post-COVID-19 pandemic recovery, however, fac-
                 es several challenges. Due to a significant relaxation in
                 measures, the rapid rise in demand for goods and ser-
                 vices has contributed to many countries grappling with
                 persistent inflation, tight labour markets and global sup-
                 ply shocks.

                 Geopolitical tensions, specifically conflicts between Rus-
                 sia and Ukraine, have furthered the economic challenges
                 within the post-COVID-19 era.

10        Calgary and Region Economic Outlook 2022-2027 | Spring 2022
Context
New COVID-19 Cases per Million, 7-day Moving Average In 2022, the extreme challenges faced by contact-intensive ser-
(as of April 18, 2022) vices-producing businesses are subsiding. When nearly all pub-
(cases per million population) lic health restrictions in Alberta were lifted on March 1, 2022,
3,000 contact-intensive businesses could again operate at full capaci-
World Canada United States ty. So far in 2022, significant recovery in the CER as a result of re-
2,500 laxed restrictions can already be seen, with services-producing
employment in Q1 2022 6.1 per cent higher than in Q1 2019.
2,000 This recovery of employment in the services-producing sector
is expected to continue through 2022.
1,500
1,000 Tightening Monetary Policy as Inflation Poses
Challenges
500
Following the onset of the COVID-19 pandemic, the Bank of
0 Canada reduced interest rates to record lows to support the
May-21
Sep-21
Oct-21
Feb-22
Feb-21
Jun-21
struggling economy. However, as the economy began to re-
Dec-21
Jan-22
Mar-22
Apr-22
Jan-21
Mar-21
Apr-21
Aug-21
Jul-21
Nov-21
cover, higher demand, high energy prices and supply chain dis-
Source: Our World in Data, Corporate Economics.
ruptions led to increasing inflation in 2021. In 2022, the conflict
in Ukraine and related sanctions on Russia have only added to
inflationary pressures. In response, the Bank of Canada began
The Economic Recovery of the Contact- to raise the overnight interest rate target on March 2, 2022, with
Intensive Services-Producing Sector in 2022 a second, larger increase of half a percentage point on April 13.
Continued incremental rate hikes are expected this year and
When public health measures were in place in 2020 and in 2021, next. Higher interest rates will help to combat inflation but may
many businesses could not operate at full capacity or open at pose challenges to highly indebted households and reduce in-
all, primarily in the services-producing sector. The most severe- centives for business investment.
ly impacted industries were those most reliant on close human
contact, such as food and accommodation or arts and recre-
Canada: Bank
Canadaof Canada's
Overnight RateTarget for Inflation
Target and the Overnight
ation. In the Calgary Economic Region (CER), total employment
Rate and CPI Inflation (April 2017 - April 2022)
in services-producing industries fell by 5.8 per cent in 2020 and
(per cent)
remained 2.3 per cent below 2019 levels in 2021.
8
Canada Inflation Rate Target for the Overnight Rate
Calgary Economic
Calgary Region:
Economic Region: Indexed Employment
Indexed Employment by by
6
Sector (2009 - YTD 2022)Sector
(index 2009=100)
4
130
Goods-Producing Sector Services-Producing Sector All Industries 2
120 0
-2
110
Apr-17
Aug-17
Apr-18
Apr-19
Apr-20
Apr-21
Dec-17
Aug-18
Dec-18
Aug-19
Dec-19
Aug-20
Dec-20
Aug-21
Apr-22
Dec-21
100 Source: Bank of Canada, Corporate Economics.
YTD
90 2022
2009 2011 2013 2015 2017 2019 2021
Source: Statistics Canada, Corporate Economics.
Calgary and Region Economic Outlook 2022-2027 | Spring 2022 11Assumptions and Risks
Assumptions
Forecast Assumptions
and Risks Coexisting with COVID-19 and Variants
Moving Forward
The lifting of pandemic health-related restric-
tions across many countries as the severity of the
current pandemic impact wanes is assumed to
continue as we go forward. We expect vaccina-
tions, therapies and approaching regional herd
immunity should prevent potential widespread
economic lockdowns that were experienced in
previous years. As a result, the economic impacts
of regional health policy reactions are expected to
be minimized. Over the last two years of COVID-19
and its variants, the world has become better
equipped to adapt to pandemic-related econom-
ic disruptions.
Oil prices are expected to remain high in 2022 as
global demand maintains strength due to pan-
demic-related health policy relaxations world-
wide. The strength in global demand is partly due
to increased commuting as workers return to of-
fices, increasing local and international travel, and
increased production.
The United States and Canada’s other major trad-
ing partners are expected to see strong economic
growth in 2022 and increase demand for Canadi-
an goods and services exports.
The Bank of Canada is expected to increase the
overnight policy rate significantly in 2022 to tack-
le persistent high inflation, a reverse in monetary
stance from a year ago. The Bank of Canada has
also ended quantitative easing as of April 25, 2022,
further tightening the monetary policy stance.
Global GDP growth is expected to remain strong
in 2022 despite the war in Ukraine.
It is assumed that the war between Russia and
Ukraine will be short-lived (year-end), however,
some economic sanctions against Russia will re-
main in place after the war.
12 Calgary and Region Economic Outlook 2022-2027 | Spring 2022Assumptions and Risks
Forecast Risks Risk Scenarios
Given the uncertainty surrounding how the conflict in Ukraine
Upside Risks: will play out, we have considered three potential scenarios.
The world has been building up immunity against These scenarios are defined primarily by the impact of the con-
COVID-19 and its variants since 2020. The availabil- flict on global oil prices.
ity of vaccines, therapies, and regional approaches to
Base case
herd immunity have enabled the relaxation of public
health-related restrictions in Canada and worldwide. The forecast assumptions listed earlier apply to the
If the health severity of other variants of COVID-19 re- base case scenario. In this scenario, the Russia-Ukraine
mains low, we should expect to see the correction of conflict has a significant impact on oil prices and other
some supply chain limitation challenges created by commodity prices this year. The conflict reaches a reso-
the pandemic and previous public health-related mea- lution by the end of 2022 and the global effects of the
sures. conflict wane in 2023.
The actions of the Bank of Canada and other Central Escalated Scenario
Banks to quickly rein in inflation are successful, and the
supply chain bottlenecks are correspondingly resolved. In the escalated scenario, the impact of the conflict on
It would stem the power purchasing erosion for house- commodity prices is more extreme. Nations’ sanctions
holds and businesses from inflation faster than expect- against Russia are tightened and other oil-producing
ed. countries do not increase oil production to fill the gap.
In addition, the conflict is longer than expected and its
The war in Ukraine pushes the European Union to seek effects continue through 2023.
permanent access to energy from alternative sources
other than Russia. In this case, Canada can potentially De-escalated Scenario
fill this need long-term. In the de-escalated scenario, the conflict is more short-
lived, coming to a resolution in mid-2022. Sanctions
Downside Risks: against Russia are less severe than in the other scenari-
The discovery of new COVID-19 variants proves to be os, and other oil-producing nations increase output and
more severe and there is a return to health-related pub- bring down global oil prices.
lic policy measures. This would add further challenges The escalated scenario represents a worst-case scenario among
to the current supply chain limitations and result in the three for the world, leading to a slowdown in economic
slower or delayed economic growth. growth, high inflation, and the death and destruction associ-
The high inflation persists despite a tighter monetary ated with a continued conflict. However, Alberta and Calgary’s
policy stance, implying that cost-push factors persist, oil and gas sector would benefit from high energy prices. As
leading to over-dampened household demand as wag- a result of this benefit, better economic outcomes for Alberta
es fail to keep pace with inflation. and Calgary would develop under the escalated scenario.
The war in Ukraine is prolonged. It would cause food in- The potential impacts of these three scenarios on key indica-
stability in different regions of the world. In addition, it tors of Calgary’s economy are illustrated below. Despite the
would lead to higher energy prices impacting non-en- challenges of predicting the outcomes of major geopolitical
ergy producing countries more significantly and fur- conflicts, the base case scenario is considered the most likely
ther speed up geopolitical unrest. outcome. For this reason, only the base case assumptions are
considered for the remainder of this document.
Calgary and Region Economic Outlook 2022-2027 | Spring 2022 13De-escalated Scenario Base Case Escalated Scenario
Deviation from Deviation from
Base Case Base Case
Per cent or Cumulative Per cent or Cumulative
percentage Change in percentage Change in
points level points level
WTI Oil Price
2022 84 -16.0%
100 120 +19.8%
($US/bbl)
2023 72 -18.3%
88 121 +37.4%
5.5
-1.2 billion, +1.2 billion,
CER GDP 2022 4.4 -1.1 pp
2012$ 6.6 +1.1 pp
2012$
Growth
3.6
(%) -1.5 billion, +2.3 billion,
2023 3.4 -0.2 pp
2012$ 4.5 +0.9 pp
2012$
4.1
-2.7 +2.5
CER 2022 3.8 -0.3 pp
thousand 4.4 +0.3 pp
thousand
Employment
3.5
Growth (%) -3.3 +4.0
2023 3.4 -0.1 pp
thousand 3.7 +0.2 pp
thousand
CER 2022 8.0 +0.3 pp
7.7 7.3 -0.4 pp
JOB Unemploy-
ment Rate
(%) 2023 7.2 +0.3 pp
6.9 6.4 -0.5 pp
CMA CPI 2022 5.2 -0.4 pp
5.6 6.7 +1.1 pp
Inflation
(%) 2023 2.5 -0.1 pp
2.6 2.9 +0.3 pp
City of Calgary 2022 1.6 1.6 1.6
Population
1.7
Growth (%) -1.5 +1.4
2023 1.6 -0.1 pp
thousand 1.8 +0.1 pp
thousand
City of Calgary
Housing Starts
2022 12.4 -2.4%
12.7 13.2 3.9%
(thousands of
units) 2023 11.3 -1.7%
11.5 11.9 3.5%
City of Calgary
Total Building
2022 5.9 -3.3%
6.1 6.3 3.3%
Permits
($billion) 2023 6.0 -1.6%
6.1 6.3 3.3%
14 Calgary and Region Economic Outlook 2022-2027 | Spring 2022Forecast
City of Calgary
Population
Population Growth in Calgary by Components
Population Growth Total Population
(thousands of persons) (thousands of persons)
50 2,400
Net Migration (Left) Natural Increase (Left)
Population Growth (Left) Total Population (Right)
40 2,000
30 1,600
20 1,200
10 800
0 400
-10 0
1997 2002 2007 2012 2017 2022 2027
Source: The City of Calgary, Corporate Economics.
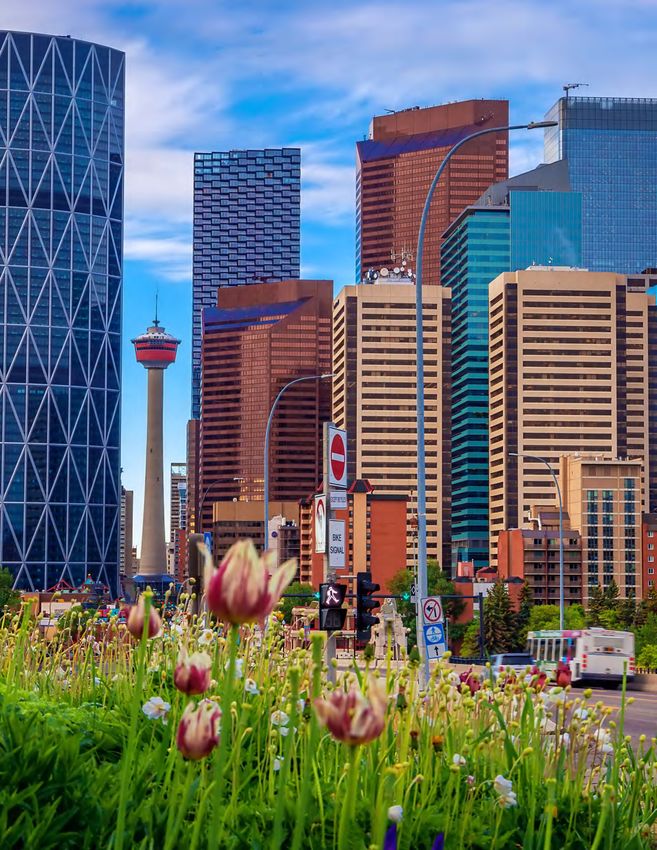
The City of Calgary’s population as of April 1, 2021, is estimated
at 1,321,255 persons. Amid the COVID-19 pandemic, Calgary’s
2021 population growth rate of 1.1 per cent remained well
below Calgary’s average growth rate of two per cent over the
previous 10 years. 2021’s relatively low net migration of about
6,100 was largely to blame for the low population growth, as the
Calgary region faced high unemployment and the COVID-19
pandemic led to a slowdown in international migration.
By April 1, 2022, Calgary’s population is estimated to have in-
creased to 1,343,502 persons, growing by about 22,300 persons
(1.7 per cent) since 2021. Due to the dropping of pandemic-re-
lated barriers to immigration, net migration improved for 2022.
It reached an estimated 13,700 persons, despite Calgary’s high
unemployment rate relative to other Canadian cities.
As international immigration continues and Calgary’s job mar-
ket slowly improves relative to the rest of Canada, net migra-
tion is expected to average at 13,700 persons over the 2023-
2027 period. By 2027, Calgary’s population is forecast to reach
1,454,400 persons, growing by 110,900 persons compared to
2022. Of this growth over the next five years, 61.7 per cent is
expected to be attributable to net migration. Natural increase
(births minus deaths) accounts for the remaining 38.3 per cent
of population growth by 2027.
Calgary and Region Economic Outlook 2022-2027 | Spring 2022 15Forecast
Textbox 1. Why The City Population Estimate differs from the Federal Census
The 2021 Federal Census population count for Calgary to July 1, 2021) which allowed some people to work from
was released on February 9, 2022. In that census, Statistics other locations. Some subjective reports suggested that
Canada estimated the population of Calgary at 1,306,784 some people who have vacation properties relocated to
persons. This is approximately 20,000 persons less than we those locations and remoted into the office from there.
were expecting. Under usual circumstances the Federal Census would as-
sign people to their “ordinary residence”, but the Work From
Our expectations of the 2021 Federal Census came from Home orders were not usual circumstances. It is likely that
our calculations using previously available data. Using the some of these individuals slipped through the cracks as
2011 Federal census and data from Statistics Canada’s Al- this was an event that had never impacted a federal census
berta Components of Growth by Quarter, we projected before.
the 2016 Federal Census count at 1,235,900 which differed
by only 3,300 persons from the 2016 Calgary Municipal At the time of this writing (early April 2022) we anticipate
Census. With the same approach, we used the 2016 Fed- that when detailed population demographic information
eral Census data and Alberta Components of Growth by is released on April 27 by Statistics Canada it should show
Quarter data and estimated the 2021 Calgary population a decline in the population of 18–24-year-old residents
at 1,328,250. A difference of 21,500 from what was released of Calgary (post-secondary students) as well as a slight
in the 2021 Federal Census. decrease in individuals in the 45–55-year cohort (remote
workers more likely to own vacation properties). Although
The difference may come from the timing of the Federal that accurately represents the population of Calgary on
Census and the ongoing COVID-19 pandemic. Although May 11, the unusual events of the day represent a signifi-
the official reference date of the 2016 Federal Census was cant departure from previous federal and municipal census
in May, Albertans were polled in February and March, when counts.
post-secondary students were present for classes. During
the 2021 Federal Census, the official census date for Alberta We have prepared our estimate of Calgary’s population
was May 11, after post-secondary students had completed and this year’s population forecast based upon a reference
their winter semester and many had departed Calgary for date of April 1, 2021. This is consistent with previous mu-
summer employment or returned to their home towns. nicipal census dates and the 2016 Federal Census, when
post-secondary students were in session and mandatory
Additionally, during May 2021 the province of Alberta was Work From Home orders were not in place.
under mandatory Work From Home measures (May 4, 2021
16 Calgary and Region Economic Outlook 2022-2027 | Spring 2022Forecast
Residential Real Estate Market per cent in 2023, trending down to 2.6 per cent per year over
the 2024 to 2027 period.
Price Signals
Resale Market Activities
City of Calgary: MLS Resale Market Median Prices
(2000-2021) City of Calgary: MLS Resale Market Activities
(thousands of dollars) (2000-2021)
600 (thousands of units) (ratio)
All Types Detached Houses Apartment 50 1.0
All Types: Sales (L)
500 All Types: New Listings (L)
Sales to New-listing Ratio (R)
400 40 0.7
300
30 0.4
200
100
20 0.1
0
2000 2003 2006 2009 2012 2015 2018 2021
10 -0.2
Source: Calgary Real Estate Board (CREB), Corporate Economics. 2000 2003 2006 2009 2012 2015 2018 2021
Source: Calgary Real Estate Board (CREB), Corporate Economics.
After six years of underperformance since the oil price col-
lapse in 2014, the residential resale market in the city of Cal- The resale housing market in Calgary was red hot in 2021, fu-
gary strengthened in 2021. The MLS median price for all types eled by historically low mortgage rates and pent-up household
of resale homes in the city of Calgary increased by eight per demand caused by pandemic health-related restrictions. The
cent over a year, from $409,825 in 2020 to $440,628 in 2021. total MLS sales for all types of existing homes in the city jumped
The resale price appreciation last year was higher than the five dramatically, up by 71 per cent from 16,149 units in 2020 to
per cent annual average growth rate in the past twenty years. 27,685 units in 2021.
The median price for detached houses increased by 10 per cent, In response to the higher demand and higher prices, MLS new
from $468,933 in 2020 to $514,833 in 2021. The price apprecia- listings also increased. The total MLS new listings increased
tion in the detached housing market was well above the 6 per from 28,165 units in 2020 to 37,670 units in 2021, up by 34 per
cent average annual growth rate seen between 2001 and 2021. cent over a year. The faster sales than new listings resulted in a
The median price for apartments in Calgary declined continu- drawdown in the city’s already lower resale housing inventory.
ously for six years starting in 2014, with the accumulated price The MLS resale home inventory dropped to 5,297 units in 2021,
depreciation reaching 22 per cent between 2015 and 2020. It down by seven per cent from 5,720 units in 2020 or by 20 per
means an apartment unit sold at $285,960 in 2014 would have cent from 6,663 units in 2019.
sold at $224,121 in 2020. The weaker demand in the apartment Calgary’s housing market last year was a strong seller’s market,
market finally turned in 2021, as other types of houses were with the sales to new listing ratio up from 0.59 in 2020 to 0.78
becoming less affordable. The median price for apartments in in 2021. Bidding wars occurred more often, with selling prices
Calgary increased by three per cent, from $224,121 in 2020 to being greater than asking prices for resale properties.
$231,146 in 2021.
With the interest rates rising and home prices increasing, the
With the Bank of Canada expected to raise interest rates mul- housing market is expected to cool down over the forecast
tiple times this year, we expect the housing market in Calgary horizon.
may be likely to cool down in the next few years. Our model
forecasts the average MLS price for all types of resale homes in
Calgary to increase by as much as 10.2 per cent in 2022 and 5.0
Calgary and Region Economic Outlook 2022-2027 | Spring 2022 17Forecast
New Home Market Activities Building Permits
City of Calgary: Residential Construction Activities City of Calgary: Building Permit Value by Type
(2000-2021) (2000-2021)
(units) (billions of dollars)
18 8
Under Construction Housing Starts
Residential Non-Residential Single-Family Houses Only
Total Completions 7
15
6
12
5
9 4
6 3
2
3
1
0
2000 2003 2006 2009 2012 2015 2018 2021
0
2000 2003 2006 2009 2012 2015 2018 2021
Source: Canada Mortgage And Housing Corporation (CMHC),
Corporate Economics. Source: The City of Calgary, Corporate Economics.
2021 was a great year for Calgary’s residential construction in- The total value of building permits in the City of Calgary in-
dustry. Total housing starts in the city jumped from 7,939 units creased to $5.7 billion in 2021, up by 66 per cent from $3.4
in 2020 to 12,722 units in 2021, up by 60 per cent year over year. billion in 2020. The higher building permit value was driven
Single-family housing starts were up by 52 per cent, from 2,716 by higher construction intention in both the residential and
units in 2020 to 4,140 units in 2021. After a 40 per cent decline non-residential markets. The building permit value for residen-
in 2020, apartment housing starts increased by 88 per cent to tial construction was $3.7 billion in 2021, up by 59 per cent from
6,065 units in 2021, from 3,228 units in 2020. $2.3 billion in 2020. The building permit value for non-residen-
tial construction was $2.0 billion in 2021, up by 81 per cent from
While housing starts increased sharply in 2021, labour short- $1.1 billion in 2020.
ages in the construction industry caused less impressive com-
pletions in all types of residential construction. The total com- With rising interest rates and cost escalation for building ma-
pletions in the city only increased marginally at 1 per cent, terials, we forecast the total value of building permits should
while housing units under construction increased by 16 per increase by 6.6 per cent in 2022 and by 0.4 per cent in 2023.
cent between 2020 and 2021. The larger number of under-con- The total building permit values are expected to average $6.1
struction housing units should keep the home builders busy for billion per year over the 2024 to 2027 period. The increase in
2022, softening the impact of higher interest rates on the future building permit value this year will be driven by the non-res-
demand for the industry. idential sector, expected to grow by as much as 8.0 per cent.
In comparison, growth in the residential sector is estimated to
increase by 5.9 per cent.
18 Calgary and Region Economic Outlook 2022-2027 | Spring 2022(Seasonally Adjusted,
(Seasonally Jan 2005
Adjusted, vs. Feb
Jan 2005 2022)
vs. Feb 2022)
(millions of dollars)
(millions of dollars)
2.5 2.5
Forecast 2.0 2.0
Textbox 2. Is there a housing affordability problem on the horizon for the city?
A historical1.5supply-side
1.5 review
1.0
The Canadian real estate market has been red hot for more 1.0 the lowest benchmark prices in all housing categories. For
than a year since the country came out of COVID-19 lock- example, the benchmark price for single-family houses was
downs. With the pent-up demand contributing to higher $242,100 in Calgary, compared to $351,800 in Toronto and
0.5
prices, housing affordability is becoming an issue or even a 0.5 $552,500 in Vancouver. The benchmark price for apartment
crisis in many urban centers across Canada. It raises an im- units was $148,800 in Calgary, compared to $200,200 in To-
portant question for Calgary: is there a housing affordability ronto and $252,700 in Vancouver.
problem on the horizon for the city?
0.0 0.0 Seventeen years later, in February 2022, the benchmark price
Chart1.1.CREA
Chart CREABenchmark
BenchmarkPrices
Pricesby TypeAggregate
byType Aggregate GreaterGreater
Vancouver Vancouver CalgaryCalgary GreaterGr
for the composite housing category increased to $868,400
(SeasonallyAdjusted,
(Seasonally Adjusted,Jan
Jan2005
2005vs.
vs.Feb
Feb2022)
2022) for all Canadian cities, while it was $487,700 in Calgary,
(millionsofofdollars)
(millions dollars) $1,321,200 in Vancouver, and $1,333,000 in Toronto. While
2.5
2.5 the benchmark price for single-family houses more than dou-
Composite
Feb 2022 Composite
Jan Single-Family
2005 Single-Family
bled One-Storey
from $242,100 One-Storey
in January 2005 Two-Storey
Two-Storey
to $553,000 Townhous
Townhouse
in February
2.0
2.0 2022 in Calgary, it tripled in Vancouver to $2,068,800 and
quadrupled in Toronto to $1,584,100 over the same period.
1.5
1.5 Even an apartment unit would cost more than a half-million
1.0
1.0
in Vancouver and Toronto now, while the benchmark price
was $268,500 in Calgary (Chart 1).
0.5
0.5
Chart 2. MLS Home Price Index (HPI): Calgary vs.
0.0
0.0
Other Cities (January 2005 - February 2022)
Aggregate
Aggregate Greater
GreaterVancouver
Vancouver Calgary
Calgary Greater
GreaterToronto
Toronto
(index January 2005=100)
500
Composite
Composite Single-Family
Single-Family One-Storey
One-Storey Two-Storey
Two-Storey Townhouse
Townhouse Apartment
Apartment Aggregate Calgary Greater Toronto Greater Vancouver
Source: The City of Calgary, Corporate Economics.
400
A review of housing price history shows that Calgary has one
of the lowest housing prices across major Canadian cities, 300
and the price appreciation is also slower in the city. The Cana-
dian Real Estate Association (CREA) publishes monthly MLS
housing price index (HPI) data detailing benchmark prices by 200
various housing types for more than fifty Canadian cities.
100
In January 2005, the aggregate benchmark price for all cit-
Jun-06
Sep-10
May-16
Oct-17
Jan-05
Nov-07
Apr-09
Dec-14
Feb-12
Mar-19
Jan-22
Jul-13
Aug-20
ies was $245,100 for all dwelling types (composite)1,2, It was
$263,200 for single-family houses and $188,800 for apart-
ments. Compared to Vancouver and Toronto, Calgary had Source: CREA, Corporate Economics.
1 Aggregate Benchmark prices for areas in the base (reference) Between January 2005 and February 2022, the MLS hous-
period of January 2005 are based on the weighted contribution
of sales activity in constituent sub-areas for each Benchmark ing price appreciation was the lowest in Calgary, compared
category (1-storey single family, 2-storey single family, town- to all cities (aggregate), especially Vancouver and Toronto
house/row unit, and apartment unit). (Chart 2). Part of the reason was the oil price collapse in late
2014, which threw Calgary and Alberta into recession while
2 Composite category represents all homes used in estimate
models, including one- and two-story single-family homes, the rest of Canada enjoyed stable growth until the COVID-19
townhouses, and apartments. pandemic hit. However, in the past seventeen years, the pop-
Calgary and Region Economic Outlook 2022-2027 | Spring 2022 19You can also read