High-Resolution Reconstruction of Dissolved Oxygen Levels in the Baltic Sea With Bivalves - a Multi-Species Comparison Arctica islandica, Astarte ...
←
→
Page content transcription
If your browser does not render page correctly, please read the page content below
ORIGINAL RESEARCH
                                                                                                                                                  published: 05 April 2022
                                                                                                                                         doi: 10.3389/fmars.2022.820731

                                            High-Resolution Reconstruction of
                                            Dissolved Oxygen Levels in the Baltic
                                            Sea With Bivalves – a Multi-Species
                                            Comparison (Arctica islandica,
                                            Astarte borealis, Astarte elliptica)
                                            Bernd R. Schöne 1*, Xizhi Huang 1, Anne Jantschke 1, Regina Mertz-Kraus 1
                                            and Michael L. Zettler 2
                                            1 Institute of Geosciences, University of Mainz, Mainz, Germany, 2 Biological Oceanography, Leibniz Institute for Baltic Sea

                                            Research Warnemünde, Rostock, Germany
                         Edited by:
                       Dongyan Liu,
                                            An increasing area of shallow-marine benthic habitats, specifically in the Baltic Sea, is
  East China Normal University, China
                                            affected by seasonal oxygen depletion. To place the current spread of oxygen deficiency
                     Reviewed by:
                             Kefu Yu,       into context and quantify the contribution of anthropogenic ecosystem perturbation to this
            Guangxi University, China       development, high-resolution archives for the pre-instrumental era are needed. As
                        Yujue Wang,
  East China Normal University, China
                                            recently demonstrated, shells of the bivalve mollusk, Arctica islandica fulfil this task with
                  *Correspondence:
                                            molar Mn/Cashell ratios as proxies for dissolved oxygen (DO) levels in the water column.
                    Bernd R. Schöne         Since the ocean quahog is inhomogeneously distributed in the Baltic Sea and may not be
         bernd.schoene@uni-mainz.de
                                            present in museum collections or found throughout sedimentary sequences, the present
                   Specialty section:
                                            study evaluated whether two other common bivalves, Astarte elliptica and Astarte borealis
         This article was submitted to      can be used interchangeably or alternatively as proxy DO recorders. Once mathematically
          Marine Ecosystem Ecology,         resampled and corrected for shell growth rate-related kinetic effects and (some) vital
               a section of the journal
          Frontiers in Marine Science       effects, Mn/Cashell data of all three species (age ten onward in A. islandica) were
       Received: 23 November 2021           statistically significantly (p < 0.0001) linearly and inversely correlated to DO
          Accepted: 10 March 2022           concentration in the free water column above seafloor (r = –0.66 to –0.75,
           Published: 05 April 2022
                                            corresponding to 43 to 56% explained variability). A. elliptica may provide slightly more
                             Citation:
  Schöne BR, Huang X, Jantschke A,
                                            precise DO data (1s error of ±1.5 mL/L) than A. islandica or A. borealis ( ± 1.6 mL/L), but
 Mertz-Kraus R and Zettler ML (2022)        has a shorter lifespan. Both Astarte species show a stronger correlation with DO than A.
   High-Resolution Reconstruction of        islandica, because their biomineralization seems to be less severely hampered by oxygen
Dissolved Oxygen Levels in the Baltic
  Sea With Bivalves – a Multi-Species       and salinity stress. In turn, A. islandica grows faster resulting in less time-averaged data.
Comparison (Arctica islandica, Astarte      During youth, the ocean quahog typically incorporates a disproportionately large amount
            borealis, Astarte elliptica).
           Front. Mar. Sci. 9:820731.
                                            of manganese into its shell, possibly because food intake occurs directly at the sediment-
    doi: 10.3389/fmars.2022.820731          water interface where Mn-rich porewater diffuses out of the sediment. With increasing

Frontiers in Marine Science | www.frontiersin.org                                   1                                              April 2022 | Volume 9 | Article 820731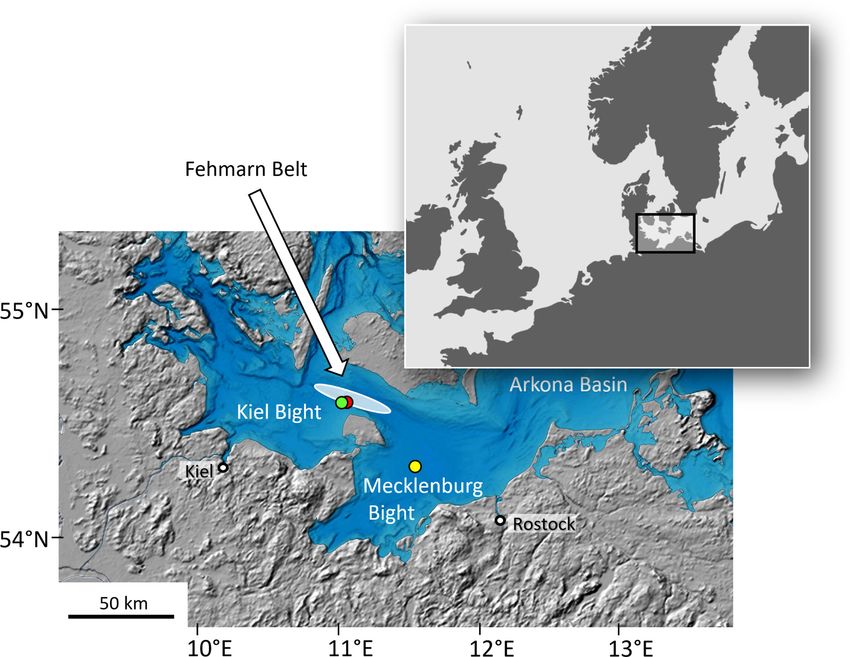
Schöne et al.                                                                                                   Bivalve Mn/Cashell Species Comparison

                                           age, however, A. islandica seems to generate a gradually stronger inhaling water current
                                           and takes in a larger proportion of water farther away from the fluffy layer. As
                                           demonstrated here, all three studied species can be used as DO archives, though
                                           species-specific limitations should be kept in mind.
                                           Keywords: sclerochronology, bivalve mollusk, shell, hypoxia, manganese, dissolved oxygen proxy,
                                           multispecies comparison

1 INTRODUCTION                                                               time-scales if Mn/Cashell data of live-caught specimens from
                                                                             museum collections were used and/or crossdated specimens
Severe oxygen deficiency endangers aquatic ecosystems                         were studied. For the latter purpose, annual increment width
potentially resulting in dead zones. When dissolved oxygen                   series of specimens with overlapping lifespan are combined
(DO) concentration falls below approx. 2.3 mg/L (≙ 1.6 mL/L                  based on similar growth patterns to form longer chronologies
or 72 µmol/L; Vaquer-Sunyer and Duarte, 2008; equivalent to                  that cover many generations of bivalves (Butler et al., 2013; Black
approx. 30% DO saturation; Rabalais et al., 2010) – the transition           et al., 2019). Its tolerance against severe oxygen depletion
from normoxic to hypoxic waters –, most invertebrates and fish                (Theede et al., 1969; Taylor, 1976; Oeschger, 1990; Oeschger
can no longer properly respire (Herreid, 1980). As a                         and Storey, 1993; Strahl et al., 2011) makes the ocean quahog an
consequence, diversity decreases, food webs collapse and                     ideal DO archive. However, its biogeographic distribution is not
biogeochemical cycles change, which in turn can further fuel                 uniform in the Baltic Sea (Zettler et al., 2001; Darr et al., 2014).
oxygen depletion (Österblom et al., 2007), eventually until all free         Therefore, it would be extremely useful if different bivalve species
oxygen is consumed, and anoxic conditions and dead                           could be used interchangeably or alternatively to reconstruct the
zones emerge.                                                                spatial and temporal development of DO.
    As indicated by abundant dark grey and black shale deposits,                 Here, we have studied if Astarte borealis and Astarte elliptica
widespread depletion or absence of DO near the seabed has been               record DO in a similar way as A. islandica and thus serve as
a common and recurring phenomenon during Earth history                       alternative DO archives. According to existing laboratory
(Tyson and Pearson, 1991; Arthur and Sageman, 1994) and                      experiments, Astarte spp. is slightly more tolerant against low
continues to do so. Since the beginning of the 20th century,                 DO than A. islandica (Theede, 1973; Dries and Theede, 1974) and
oxygen-deficiency has significantly expanded and now also                      more widely distributed in the Baltic Sea (Darr et al., 2014).
threatens nearshore coastal environments (Conley et al., 2009;               Specimens of all three species were recently collected alive in the
Carstensen et al., 2014; Fennel and Testa, 2019). Despite                    same region of the Fehmarn Belt, Baltic Sea. Data obtained herein
extensive research – predominantly in the Baltic Sea, one of                 on A. islandica (ontogenetic age range: 9 – 41 yrs; water depth:
the largest marine low-oxygen settings – the mechanisms and                  21 m; DO range: 2.8 – 9.4 mL/L; temporal coverage: 1983 – 2020)
ultimate causes of coastal hypoxia are still not well understood,            supplemented such of a previous study of the same species from
but likely include anthropogenic eutrophication that propelled               Mecklenburg Bight (7 – 19 yrs; 25 m; 1.8 – 8.9 mL/L; 1987 – 2001)
primary production and increased the flux of organic carbon to                (Table 1). Particular attention was paid to the relationship
the seafloor (Conley et al., 2007; Carstensen et al., 2014). This             between DO and Mn/Cashell, ontogenetic Mn/Cashell trends,
deficit of knowledge is largely attributed to incomplete                      lifespan, timing and rate of seasonal shell growth and clarity of
instrumental data and lack of suitable high-resolution archives.             growth patterns necessary to temporally align the chemical data
Whereas DO trends on time-scales of centuries and millennia                  measured in the shells. Results of this study will be of great
can be reconstructed from sediment cores (Jokinen et al., 2018),             relevance to reconstruct multiregional DO trends through time
annually and better resolved, temporally well-constrained                    in the Baltic Sea. Given the broad biogeographic distribution of A.
archives are still scarce. Besides fish otoliths (Limburg et al.,             elliptica (Abbott and Morris, 1995) and A. borealis (Zettler, 2001)
2011) and foraminifera (Groeneveld and Filipsson, 2013), shells              outside the Baltic Sea, similar studies on water oxygenation trends
of the marine bivalve mollusk, Arctica islandica have recently               can likely be conducted at many other localities.
been identified as interannually to seasonally resolved in-situ
archives of oxygen deficiency with manganese-to-calcium molar
ratios serving as a proxy for DO in the overlying water body (DO             2 MATERIALS AND METHODS
measured some decimeters away from the seafloor) (Schöne
et al., 2021).                                                               Five specimens of A. islandica and three specimens of each, A.
    Due to its long lifespan and presence of annual growth                   elliptica and A. borealis, were collected alive at Fehmarn Belt near
patterns (Jones, 1980; Butler et al., 2013; Schöne, 2013) the                the halocline on 29 June 2020 with van Veen grabs during cruise
ocean quahog, A. islandica can potentially serve as an                       EMB239 with the R/V Elisabeth Mann Borgese (Table 1;
accurately dated DO archive spanning several decades or                      Figure 1). A. islandica and A. elliptica co-occurred in 21 m
centuries. The DO history may be assessed on even longer                     (median grain size: 114 µm, organic content: 1.65 wt%), and A.

Frontiers in Marine Science | www.frontiersin.org                        2                                     April 2022 | Volume 9 | Article 820731
Schöne et al.                                                                                                                          Bivalve Mn/Cashell Species Comparison

TABLE 1 | List of bivalves from the Baltic Sea used in the present study along with basic environmental data (monthly temperature, T, salinity, S, dissolved oxygen
concentration, DO conc., and DO saturation, DO sat).

Specimen ID                           Taxon                     Ontogenetic age (yr)                 #d18O samples                  LA-ICP-MS:#spots, cal. yrs, ontog. yrs

Fehmarn Belt (FBR36): 54°18′59.50′′N, 011°33′00.00′′ E; 21m;
1983-2020: T: -0.4–14.6°C; S: 10.9–26.5; DO conc.: 3.0–9.4 mL/L; DO sat.: 32.1–77.9%
MLZ-FBR36-A4L                  Arctica islandica                    41                                                              480, 1983–2020, 4–41
MLZ-FBR36-A5R                  Arctica islandica                    38                                    79 (43)
MLZ-FBR36-A6L                  Arctica islandica                     9                                                              207,   2015–2020, 4–9
MLZ-FBR36-A7L                  Arctica islandica                    10                                                              202,   2012–2020, 3–10
MLZ-FBR36-A15L                 Arctica islandica                    10                                                              393,   2012–2020, 3–10
MLZ-FBR36-A16L                 Arctica islandica                    21                                                              441,   2005–2020, 6–21
MLZ-FBR36-A8L                  Astarte elliptica                    21                                   180 (70)                   170,   2004–2020, 5–20
MLZ-FBR36-A9L                  Astarte elliptica                    27                                                              134,   2003–2015, 10–21
MLZ-FBR36-A10L                 Astarte elliptica                    30                                                              197,   1997–2015, 7–24
Fehmarn Belt (FBR06): 54°37’01.20”N, 011°00’36.00”E; 18m;
1978-2019: T: -0.4–16.2°C; S: 10.9–26.8; DO conc.: 2.8–9.2 mL/L; DO sat.: 28.3–80.2%
MLZ-FBR06-A1L                  Astarte borealis                     50                                                              210, 1978–2019, 8–49
MLZ-FBR06-A2L                  Astarte borealis                     52                                                              163, 1981–2019, 13–51
MLZ-FBR06-A3L                  Astarte borealis                     47                                   175 (31)                   190, 1981–2018, 8–45
Mecklenburg Bight (St12): 54°18′59.50′′N, 011°33′00.00′′ E; 25 m;
T: -0.5–16.9°C; S: 14.9–28.9; DO conc.: 2.0–8.9 mL/L; DO sat.: 24.5–77.1%
MLZ-St12-A4R                   Arctica islandica                    19                                                              329,   1987–2001, 5–19
MLZ-St12-A5R                   Arctica islandica                    15                                                              326,   1991–2001, 5–15
MLZ-St12-A6R                   Arctica islandica                    14                                                              373,   1991–2001, 4–14
MLZ-St12-A7L                   Arctica islandica                     7                                                              183,   1997–2001, 3–7
MLZ-St12-A9R                   Arctica islandica                     8                                                              151,   1998–2001, 5–8

All specimens were collected alive (Fehmarn Belt: 29 June 2020; Mecklenburg Bight: 25 October 2001). Last character of ID denotes left (L) or right (R) valve. Isotope samples in
parentheses denote number of samples used to construct the seasonal age model. For details on the age model of specimens from Mecklenburg Bight, see Schöne et al. (2021).

borealis came from 18 m water depth (median grain size: 961 µm,                            water. Data obtained herein were combined with such of a
organic content: 2.43 wt%) (Figure 1 and Table 1). Immediately                             previous study on live-collected A. islandica specimens from
after collection, specimens were sacrificed in formalin and then                            Mecklenburg Bight (Figure 1; for details see Schöne et al., 2021).
preserved in 70 vol% ethanol. In the laboratory, soft parts were                           Relevant data of the bivalves and the physical environmental
removed with a knife and empty shells washed with soap and                                 parameters at both study regions are provided in Table 1.

 FIGURE 1 | Map showing sample localities in the Bay of Mecklenburg (yellow circle: St12, 54°18′59.50′′N, 011°33′00.00′′ E, 25 m water depth) and Fehmarn
 Belt (green circle: FBR36, 54°35’52.80”N, 010°51’28.80”E, 21 m; red circle: FBR06, 54°37’01.20”N, 011°00’36.00”E, 18 m). White oval denotes area where
 instrumental records came from. Map sources: inlet (upper right) modified after http://www.mygeo.info; bathymetry map modified after http://data.bshc.pro
 (Baltic Sea Bathymetry Database); last access: 27 Oct. 2021.

Frontiers in Marine Science | www.frontiersin.org                                      3                                               April 2022 | Volume 9 | Article 820731
Schöne et al.                                                                                              Bivalve Mn/Cashell Species Comparison

2.1 Sample Preparation                                                   rate of seasonal shell growth. Since A. islandica from the Baltic
Samples were prepared according to standard sclerochronological          Sea tends to be very thin-shelled compared to conspecific
techniques described recently in Schöne et al. (2021).                   specimens from well-oxygenated and fully marine sites (e.g.,
Briefly, covered with a protective layer of metal epoxy resin,            Arntz and Weber, 1970), and the growth patterns of A. elliptica
shells were cut along the axis of maximum growth with a low-             exhibit strong undulations, sampling in these two species was
speed saw at 175 to 225 rpm and a water-cooled 0.4 mm thick,             completed on the outer shell surface of specimens MLZ-FBR36-
diamond-coated saw blade (low diamond concentration blade,               A5 (A. islandica; N=79) and MLZ-FBR36-A8 (A. elliptica;
Buehler IsoMet 15LC). From that axis, two ca. 3 mm-thick slabs           N=72). In A. borealis (MLZ-FBR06-A3), aragonite powder
were cut, which were affixed (with metal epoxy) to glass slides           samples (N=173) were micromilled from cross-sections (for a
with the cutting surfaces facing upward. These surfaces were then        graphic representation of the sampling methods see Peharda
ground on F800 and F1200 grit SiC powder and highly polished             et al., 2019). Prior to sampling, the periostracum (and adhering
with 1 µm Al2O3 suspension on a Buhler Microfloc cloth. After             manganese oxides) and the outermost portion of the external
each step, samples were ultrasonically rinsed with tap water and         shell surface were physically removed with grinding paper (P320
then air-dried.                                                          to P800) and/or a glass fiber brush. Aragonite powder samples
                                                                         were obtained by hand from the outer shell surface using a
2.2 Growth Pattern Analysis                                              conical SiC drill bit operated in a milling device that was firmly
For shell growth pattern analysis, one polished section of each          attached to a binocular microscope. In case of surface milling,
specimen was immersed in Mutvei’s solution for 17 min under              approx. 1 cm long sample swaths (approx. 100 µm wide and 20
constant stirring at 37 to 40°C, then gently rinsed in deionized         µm deep) were taken at nearly equidistant intervals parallel to the
water and air-dried under the fume hood for ca. six hours                growth patterns.
(Schöne et al., 2005a). Mutvei-stained sections were viewed                  Each milling step yielded approx. 30 to 70 µg of aragonite
under a binocular microscope equipped with sectoral (= one-              powder. Samples were reacted with water-free phosphoric acid for
quarter) darkfield ring-light illumination (Schott VisiLED                two hours in He-flushed 12 mL borosilicate exetainers at 72°C.
MC1000) and photographed with a Canon EOS 600D digital                   CO2 gas in the headspace was measured in a Thermo Fisher MAT
camera (Figure 2A upper panel + B). In addition, the other,              253 continuous flow – isotope ratio mass spectrometer coupled to
unstained polished slab was studied under brightfield                     a GasBench II. Stable isotope ratios were calibrated against an
illumination (Figure 2A lower panel + C) as well as under a              NBS-19 calibrated Carrara Marble (d18O = −1.91 ‰) distributed
stereomicroscope (Zeiss Axio Imager.A1m) with circular                   by IVA Analysentechnik GmbH & Co. KG. Results are given in
polarized reflected light in conjunction with a differential              per mil (‰) relative to the Vienna Pee Dee Belemnite isotope
interference contrast prism (“C-DIC method”; Danz and                    scale. The 1s long-term accuracy based on blindly measured NBS-
Gretscher, 2004) (Supplements). The C-DIC method was                     19 samples (N = 421) is better than 0.04 ‰ for d18O. Differences in
particularly useful to cross-verify annual growth patterns in            acid fractionation factors of the reference material (calcite) and
Astarte spp.                                                             shells (aragonite) remained unconsidered, because the data were
    Growth pattern analyses fulfilled two tasks. They were used to        used in conjunction with the paleothermometry equation by
determine the ontogenetic ages of the studies specimens                  Grossman and Ku (1986) which likewise did not consider these
(Table 1) and to assign calendar years to annual increments              acid fractionation factors (for more detailed explanation see
(= portions between annual growth lines). Annual increment               Materials and Methods section in Füllenbach et al., 2015: section
widths (Supplements) were measured to the nearest approx. 10             Relationship Between Mn/Cashell Data and DO Concentration).
µm using the in-house software package Panopea (© Peinl and
Schöne). These data were compared to weighted element-to-Ca              2.4 In-Situ Chemical Analysis: LA-ICP-MS
averages (i.e., regression analyses were conducted) to reveal            The chemical composition of the shells was measured in the
potential growth rate-related kinetic effects. In A. elliptica           remaining polished slabs by means of laser ablation – inductively
intra-annual growth patterns were visible after immersion in             coupled plasma – mass spectrometry (LA-ICP-MS) in spot
Mutvei’s solution (Figure 2B). The changing widths of intra-             mode. In this paper, the focus was placed on manganese (Mn),
annual growth increments agreed at large with changing seasonal          and reference was given to barium (Ba) and magnesium (Mg)
growth rates inferred from the oxygen isotope alignment                  values. For some additional elements (Li, B, Na, K, Sr), the reader
approach (see below). Mutvei-stained sections also facilitated           is referred to Supplements. Analyses were completed with a 193
the study of the geometry of internal shell growth patterns (e.g.,       nm ArF Excimer laser (ESI NWR193) coupled to an Agilent
Figure 2B) which is crucial to understand time-averaging of              7500ce quadrupole ICP-MS. Spots with a diameter of 55 mm and
samples taken from the shells and to construct more precise              a midpoint spacing of 85 mm were placed along the ventral
seasonally resolved chemical chronologies.                               margins of the shells, within the inner portion of the outer shell
                                                                         layer. Laser repetition rate was 10 Hz. The laser energy on the
2.3 Shell Oxygen Isotope Analysis                                        samples attained approx. 3 J/cm2. Each analysis consisted of 15 s
As described above, shell oxygen isotope data were used to               of background, 30 s of ablation, and 20 s of washout time.
temporally contextualize the growth record, determine the                Accuracy and precision of the data were assessed through
timing of growth line formation, and ascertain the changing              comparison with reference materials USGS MACS-3 and BCR-

Frontiers in Marine Science | www.frontiersin.org                    4                                     April 2022 | Volume 9 | Article 820731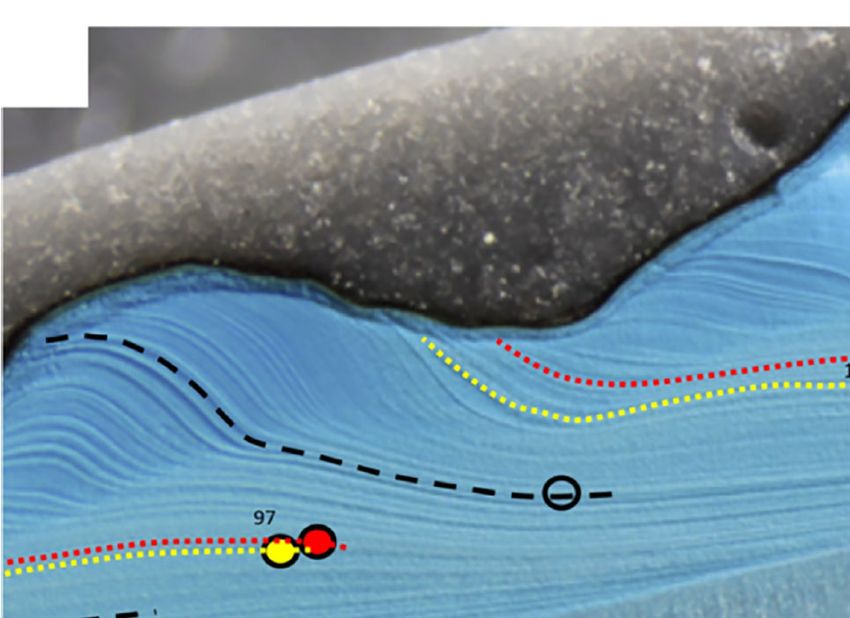
Schöne et al. Bivalve Mn/Cashell Species Comparison
A
B
C
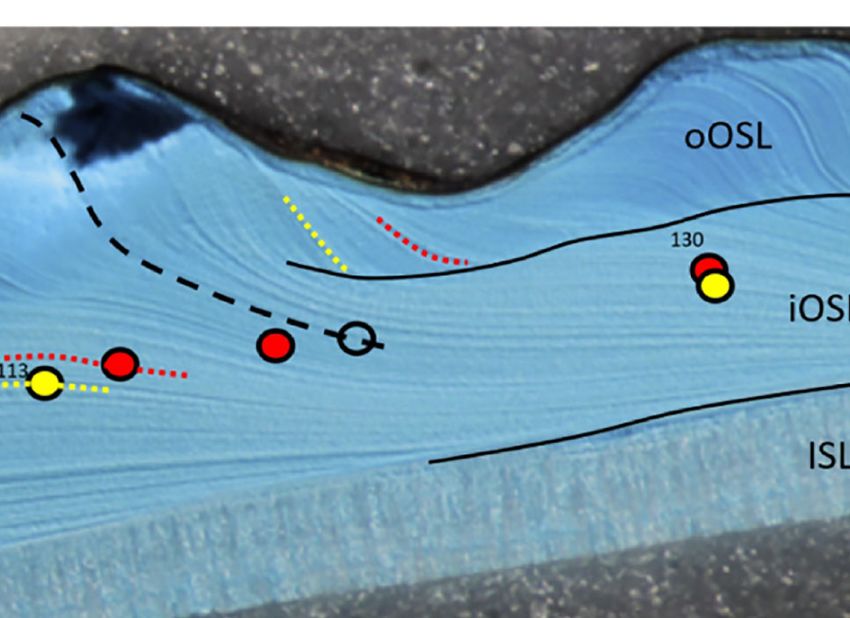
FIGURE 2 | Growth patterns in shells of Arctica islandica (A, specimen MLZ-FBR36-A4L), Astarte elliptica (B, MLZ-FBR36-A9L) and Astarte borealis (C, MLZ-
FBR06-A1L). (A, upper panel + B) = sectoral darkfield illumination; (A, lower panel and C) = brightfield illumination (with partly numbered LA-ICP-MS spots). Yellow
circles and yellow dotted lines indicate seasonal magnesium peaks, red circles (LA-ICP-MS spots) and lines stand for manganese peaks, and black open circles in
Astarte spp. denote Mn minima. Bold numbers in A = calendar years (e.g., “97” = 1997). In A. islandica, only one annual growth line is developed which forms in late
fall and is associated with the seasonal Mg peak. In Mutvei-stained sections (A upper panel), the annual growth lines were often difficult distinguish from disturbance
lines. In such cases, comparison with polished cross-sections (A lower panel) was a great help, because distinct brown annual bands were occasionally developed
with the Mg maxima occurring in their center. In Astarte spp., two annual growth lines can be distinguished which delimit a dark band (dark blue after immersion in
Mutvei’s solution, B, and grey in polished sections, C), i.e., a faint, Mg-rich line at the beginning and a distinct Mg-depleted line at the end. The dark band consisted
of a series of very narrow intra-annual growth lines indicating slow winter growth. Intra-annual growth lines approached the outer shell surface at an increasingly
steep angle toward the end of the growth band. With the beginning of the new growing season (lighter blue or grey in B, C, respectively), the angle became much
shallower indicating fast shell growth. Faint black lines were used show the boundary between the different shell layers, i.e., the outer and inner portions of the outer
shell layer (oOSL, iOSL) and inner shell layer (ISL). Note that the ISL in A. islandica is almost completely dissolved (A), whereas both astartids show thick inner shell
layers. In A. elliptica, the spiral rides of the outer shell sculpture (approx. one per year) are mirrored in the wavy boundary between the two sublayers of the OSL (B),
whereas the boundary between the oOSL and iOSL in A. borealis is much less wavy (C).
2G as well as JCt-1 as quality control materials (QCMs) (http://georem.mpch-mainz.gwdg.de/, application version 30;
(Supplements). NIST SRM 610 and 612 were used as last access: 15 May 2021; Jochum et al., 2005; Jochum et al.,
calibration materials. Preferred values for calibration and 2011). 43Ca was used as the internal standard. The time-resolved
reference materials were taken from the GeoReM database signals were processed using LAtools (Branson et al., 2019). To
Frontiers in Marine Science | www.frontiersin.org 5 April 2022 | Volume 9 | Article 820731
Schöne et al.                                                                                                   Bivalve Mn/Cashell Species Comparison

compute molar element-to-Ca ratios, a Ca concentration of                   normalized. Then, the seasonal growth curves of several years
380,000 mg/g was assumed following Marali et al. (2017a).                   for which at least eight samples were available (A. islandica MLZ-
    To compare the shell element chemical data of different                 FBR36-A5: 4 seasonal growth curves; A. elliptica MLZ-
specimens or species with each other, or compare the shell                  FBSCR36-A8: 7 curves; A. borealis MLZ-FBR06-A3: 4 curves;
element chemistry with environmental data, a set of                         full data set given in Supplements) were arithmetically averaged
mathematical transformations is required, which are described               to obtain species-specific seasonal growth models (Figure 3).
in the following two sections. Firstly, it needs to be ensured that         Cumulative (normalized) growth curves formed the basis to add
each data point represents the same amount of time and that a               a time axis to the LA-ICP-MS data. Based on the relative position
calendar axis is added to the data (section Seasonal Shell Growth           of a LA-ICP-MS spot within the annual growth increment
Models and Mathematical Resampling). Secondly, trends related               (center of the annual growth line = zero), the cumulative
to ontogenetic age or growth rate as well as vital effects                  growth curve provided the corresponding calendar date.
controlling the incorporation of elements into the shell need to
be mathematically eliminated as effectively as possible (section
Detrending of Mn/Cashell Data).
                                                                            2.6 Detrending of Mn/Cashell Data
                                                                            For calibration and comparison with environmental data,
2.5 Seasonal Shell Growth Models and                                        ontogenetic age-related trends (Figure 5) were mathematically
                                                                            removed from each Mn/Cashell series. For this purpose, the
Mathematical Resampling
                                                                            monthly Mn/Cashell data of each specimen were first plotted
The timing and rate of shell growth typically varies through
                                                                            against ontogenetic age and the decline through life estimated
ontogeny as well as between specimens, species and localities.
                                                                            with exponential functions. Following our previous study
Equally sized samples taken from the shells thus represent
                                                                            (Schöne et al., 2021), instead of producing dimensionless Mn/
different amounts of time. Likewise, the time interval between
                                                                            Cashell data, the Mn/Cashell level at the intercept (age zero) was set
consecutive samples differs, even if sampling was completed at
                                                                            as an anchor point, and the monthly Mn/Cashell values of later
the same spacing. To enable a direct comparison of the chemical
                                                                            stages of life increased by the difference (offset) between this
data, mathematical resampling is crucially required (Schöne,
                                                                            anchor point and the predicted Mn/Cashell value at the respective
2008; Hallmann et al., 2011). It will adjust the data to a
                                                                            stage of life. Note, that we also tested a species-specific
common temporal resolution. The first step is to properly align
                                                                            detrending approach as in Schöne et al. (2021), by which the
the growth record based on the species-specific seasonal age
                                                                            average ontogenetic Mn/Cashell trend computed from all
model. Once the precise date of the center of each sample (e.g.,
                                                                            conspecific specimens was used to detrend the individual
LA spot) is known, missing data between samples can be
                                                                            chronologies, but the resulting Mn/Cashell data were linked less
obtained by linear interpolation. The resulting curve is then
                                                                            strongly to DO than by employing the age trend of each
resampled to obtain an uninterrupted artificial time-series with
                                                                            individual specimen.
daily resolution, which can be used, for instance, to compute
                                                                               To account for growth rate-related effects, annual (= growing
monthly or annual averages.
                                                                            season averages) Mn/Cashell data were plotted against annual
    Here, the species-specific and locality-specific timing and rate of
                                                                            increment widths. From such cross plots, species-specific linear
seasonal shell growth was determined with the stable oxygen
                                                                            regression models were computed. As in the detrending
isotope method described by Schöne et al. (2007). For this
                                                                            technique described earlier, an anchor point was selected (for
purpose, measured d18Oshell values were arranged in consecutive
                                                                            each species), here, the broadest increment, and the difference
order until the best fit was achieved with the shape of the predicted
                                                                            between this anchor point and the predicted Mn/Cashell value for
shell oxygen isotope curve (pseudo-d18Oshell curve). The latter was
                                                                            the respective annual increment added to its monthly Mn/Cashell
computed from instrumental temperature, T, and d18Owater values
                                                                            values. Note that through this treatment, the Mn/Cashell of slower
using the paleothermometry equation by Grossman and Ku (1986;
                                                                            growing shell portions were artificially lifted to higher levels as if
with a PDB-SMOW scale correction of –0.27 ‰ following
                                                                            no Mn/Cashell decline had occurred in later, slower growing
Gonfiantini et al., 1995) solved for predicted d18Oshell:
                                                                            stages of life. In case of A. islandica, new data from Fehmarn Belt
                                                                            were combined with such from our previous study at
                Predicted d 18 Oshell
                                                                            Mecklenburg Bight (Schöne et al., 2021). We refrained from
                                                                           adjusting the monthly data to monthly growth rate differences,
                20:60 + 4:34  d 18 Owater − 0:27 − T
                   =                                        (1)             because intra-annual increment curves were not available and
                                 4:34
                                                                            the seasonal growth models were not deemed precise enough for
In the absence of direct measurements of d18Owater, respective              this purpose.
values were estimated from instrumental salinity data, S, using                To consider both Mg/Cashell and growth rate-related effects
the local freshwater mixing line (Schöne et al., 2005b):                    on shell manganese content, raw Mn/Cashell data were first
                                                                            plotted against Mg/Cashell values. The relationship between the
                       d 18 Owater = 0:30  S − 10:36            (2)        two elements was estimated with species-specific exponential
   Based on the known distances and time intervals between the              equations. The Mn/Cashell value at the lowest Mg/Cashell value (of
isotope samples, daily growth curves were computed. For                     each species) was chosen as the anchor point and the offset from
comparison with each other, the growth curves were                          the anchor point to the predicted value added to the Mn/Cashell

Frontiers in Marine Science | www.frontiersin.org                       6                                      April 2022 | Volume 9 | Article 820731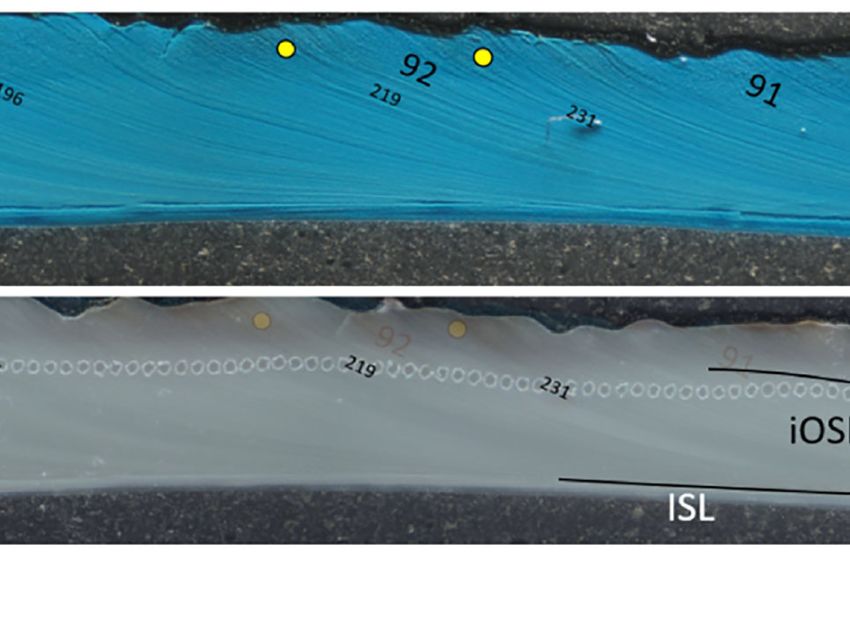
Schöne et al.                                                                                                                  Bivalve Mn/Cashell Species Comparison

                                 A

                                 B

 FIGURE 3 | Monthly Ba/Cashell chronologies validate the proper temporal alignment of the shell data. Chronologies show a strong running similarity between
 specimens of the same species (example from A. elliptica) (A) as well as across species boundaries (B). Chronologies in (B) represent the average of five specimens
 of A. islandica and three specimens of A. elliptica, respectively.

value. Subsequently, the data were corrected for growth rate-                        values of the water likely differed from such directly at the
related trends following the description above.                                      sediment-water interface where the bivalves lived, but co-
    As in our previous study at the Bay of Mecklenburg (Schöne                       varied with such. This piece of information needs to be kept in
et al., 2021), only the seasonal Mn/Cashell extremes (this time:                     mind during data interpretation. Since the environmental data
species averages) were compared to respective seasonal DO                            were temporally incomplete, linear interpolation was applied to
minima and maxima. This approach predominantly accounts                              fill gaps. The resulting curves were then resampled at daily
for the incompleteness of instrumental data, in particular DO.                       resolution. From these values, monthly and annual averages
Research cruises (during which respective measurements were                          were computed for comparison with the chemical data of the
completed) were often conducted during times of the occurrence                       shells. To construct the seasonal shell growth model, long-term
of seasonal hypoxia or close to the time of the year where highest                   daily averages were computed. Due to insufficient instrumental
oxygenation occurred. Therefore, the seasonal DO extremes were                       temperature and salinity data required to compute DO
most reliably recorded. The complete dataset (monthly pairs of                       saturation data from DO concentration values (Benson and
Mn/Cashell vs. DO) is provided in the Supplements.                                   Krause, 1984), the latter were reported instead. As
                                                                                     demonstrated in Schöne et al. (2021), DO concentration and
2.7 Instrumental Data                                                                DO saturation curves are largely similar in this region of the
Instrumental data (temperature, salinity, DO concentration)                          Baltic Sea justifying the comparison of Mn/Ca shell with
were obtained from the Leibniz Institute for Baltic Sea                              DO concentration.
Research Warnemünde, IOW, from their website at https://
odin2.io-warnemuende.de/as well as the Baltic Nest Institute
from their website at http://nest.su.se/(last access: 25 March                       3 RESULTS
2021) for stations and water depths in the vicinity of the shell
collection sites (Figure 1). It needs to be pointed out that the                     3.1 Lifespan and Annual Shell Growth
instrumental measurements were not conducted at the seafloor                          In all three studied species, annual growth lines were discernable
where the bivalves dwelled and inhaled water, but some                               with sectoral darkfield illumination after immersion in Mutvei’s
decimeters away from the seafloor. Here, the Mn/Ca and DO                             solution (Figure 2). The old-grown A. islandica specimen MLZ-

Frontiers in Marine Science | www.frontiersin.org                                7                                            April 2022 | Volume 9 | Article 820731
Schöne et al.                                                                                              Bivalve Mn/Cashell Species Comparison

FBR-A4 also showed distinct brown annual bands and lines in              October and mid-November (Figures 2A, 4A), i.e., ca. two
the polished ventral margin when viewed with brightfield                  months after the seasonal temperature maximum, which is
illumination (Figure 2A, lower panel). Specifically in younger            largely in agreement with previous observations (Schöne, 2013).
ocean quahogs, the annual growth patterns were often more                For comparison, the seasonal growth model from Mecklenburg
clearly developed in the hinge portions (condensed growth                Bight is also depicted in Figure 4A (pale blue) demonstrating that
record) than the ventral margin, and used to validate the                the growth line formation occurred several weeks earlier than at
ventral margin growth record. The occurrence of disturbance              Fehmarn Belt. In A. elliptica and A. borealis, a Mg-rich growth
lines (reflecting non-periodic interruptions or slow-down of shell        line (compare Figures 2B, C) formed nearly contemporaneously
growth) in the ocean quahogs made the recognition of annual              with that in the ocean quahog, i.e., between mid-October and end
growth lines a challenging task. As long as the cutting axis was         of November (Figures 4B, C). A second growth line (compare
exactly perpendicular to the growth lines, the C-DIC method              Figures 2B, C) was associated with the seasonal Mg minimum
provided an alternative means to detect annual growth lines in           and laid down in January/February, i.e., near the end of a slow
polished sections (Supplements). The annual nature of the                growth period (Figures 4B, C). The latter was visually expressed
growth patterns was confirmed by periodic Mg/Cashell and                  as a dark grey (or dark blue-stained) growth band (compare
d18Oshell oscillations which were also reported from numerous            Figures 2B, C). Previous studies likewise concluded the dark
other bivalve species (Jones and Quitmyer, 1996; Kubota et al.,          growth band in these two astartids formed during the cold season
2017; Hausmann et al., 2019) including A. islandica (Schöne,             (Trutschler and Samtleben, 1988; Moss et al., 2021). The
2013; Shirai et al., 2014). The presence and proper recognition of       cumulative growth curves of the studied species were not
annual growth patterns was further evidenced by coherent Ba/             particularly sinusoidally shaped (Figure 4), reflecting that shell
Cashell chronologies, both among conspecific specimens and                growth rates did not vary a lot throughout the year. Accordingly,
across species boundaries (Figure 3). Ba/Cashell typically agrees        weighted monthly (annual) averages of trace element data do not
well among specimens from the same site (Gillikin et al., 2006)          deviate significantly from arithmetic averages.
and thus serves as a crossdating tool (Marali et al., 2017b),                A. elliptica was the only species that revealed intra-annual
although the environmental drivers of Ba/Cashell change in A.            growth patterns clearly enough to be studied (Figure 2B). The
islandica remain largely unknown.                                        d18Oshell-based reconstruction of the seasonal growth curve
    In contrast to A. islandica, which formed just one annual            (Figure 4B) of this species compared well to the changing
growth line per year (Figure 2A), after immersion in Mutvei’s            width of the intra-annual growth increments (Figure 2B).
solution, both Astarte species showed two growth lines per year          Narrowest intra-annual increments occurred between the Mg-
delimiting a dark blue-stained growth band (Figures 2B, C). The          rich and the Mg-poor growth lines, i.e., within the dark blue-
first, faint line occurred at the beginning of this growth band and       stained growth band. The growth lines in this shell portion
was associated with the seasonal Mg/Cashell maximum, whereas a           approached the outer shell surface at a very steep angle.
second, stronger growth line was observed at the end of the dark         Thereafter, the shells were stained lighter blue by Mutvei’s
blue band and associated with the seasonal Mg/Cashell minimum.           solution (= less organics, relatively more CaCO3), the intra-
According to annual growth pattern analysis, the ontogenetic             annual increments broadened and the angle between intra-
ages ranged between 9 and 52 years (Table 1; respective annual           annual growth lines and the shell surface decreased reflecting
counts were done in the ventral margins supported by data of the         faster shell growth (compare Figure 2B). Since the time
hinges). A. borealis attained the longest lifespan, followed by A.       represented by intra-annual growth increments remains
islandica (maximum of 41 years) and A. elliptica (27 years).             unresolved and the intra-annual growth lines could not always
    Compared to their sizes, the shells of A. islandica were             be unequivocally identified, the intra-annual increment widths
notably thin. For example, specimen MLZ-FBR36-A4                         were not measured. Noteworthy, the striking sculpture of the
measured 6 cm in height, but the shell was barely 1 mm thick             outer shell surface of A. elliptica (compare Figure 2B) provided
(measured half way between the hinge and the ventral margin;             an approximate estimate of the ontogenetic age of the specimens.
Figure 2A). As shown in Figure 2A, the inner shell layer was             In many instances, one spiral ridge formed per year (but see
extremely thin and showed signs of erosion. Relative to their            Trutschler and Samtleben, 1988).
overall size, both Astarte species, however, had thicker shells
(MLZ-FBR36-A9L: 2.1 cm height; 1.2 mm thickness measured                 3.3 Mn/Cashell Chronologies
half way between the hinge and ventral margin; Figures 2B, C).           In all three studied species, Mn/Cashell values showed a non-
                                                                         linear decrease during ontogeny (Figure 5). In A. islandica this
3.2 Timing and Rate of Seasonal                                          decrease was associated with a distinct decline in seasonal
Shell Growth                                                             variability (Figure 5A). For example, this species attained
As revealed by the stable oxygen isotope alignment technique, the        monthly averages of up to approx. 220 µmol/mol and seasonal
timing and rate of seasonal shell growth at Fehmarn Belt differed        ranges of nearly 200 µmol/mol between age three and six
slightly among the three studied species (Figure 4). A. islandica        (months 36 and 72) and lowest values of 1 µmol/mol and
mainly grew shell between December and August of the following           seasonal ranges of less than 5 µmol/mol at age 36 (month 432)
year. Growth was retarded during the remainder of the growing            (Figure 5A). In A. elliptica, monthly maxima and seasonal
season. The annual growth line (Mg-rich) formed between mid-             swings during youth (age six to nine, month 72 to 108)

Frontiers in Marine Science | www.frontiersin.org                    8                                    April 2022 | Volume 9 | Article 820731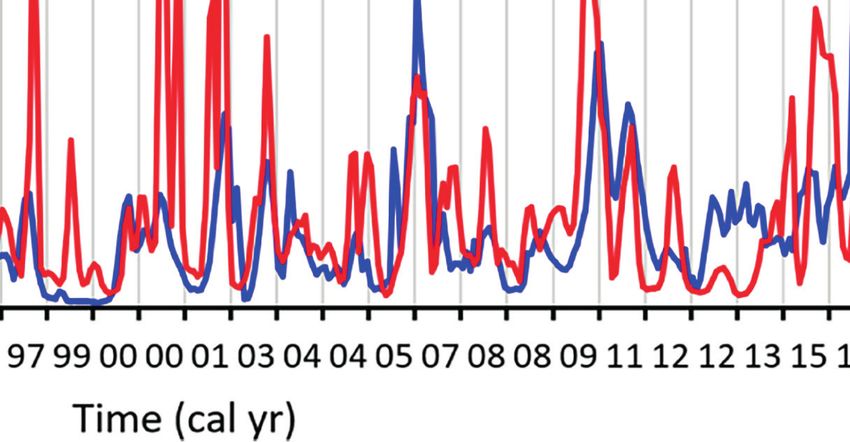
Schöne et al.                                                                                                                  Bivalve Mn/Cashell Species Comparison

                             A

                             B

                             C

 FIGURE 4 | Seasonal growth models of the three studied species based on the oxygen isotope alignment technique. Left panel: daily growth rates, right panel:
 cumulative growth curves. (A) A. islandica, station FBR36 (Fehmarn Belt) is brilliant blue, St12 (Mecklenburg Bight) in pale blue; (B) A. elliptica, FBR36;
 (C) A. borealis, FBR06 (Fehmarn Belt). Vertical bars represent annual growth lines. Red, yellow = Mg-rich line at Fehmarn Belt and Mecklenburg Bight, respectively;
 blue = Mg-depleted growth line. In Astarte spp., the red and blue lines delimit a grey (or Mutvei blue-stained) growth band. Data from Mecklenburg Bight taken from
 Schöne et al. (2021).

remained well below that of the ocean quahog and equaled 120                          agreement, specifically during 2004 and 2011, while specimen A8
µmol/mol and up to approx. 80 µmol/mol, respectively, and all-                        showed, on average, approx. 20 µmol/mol higher values than the
time minima of 5 µmol/mol were reached at age 23 (month 276)                          other two individuals and more than two to three times larger
(Figure 5A). Similar values were measured in coeval A. islandica                      seasonal amplitudes (Figure 7B). In some years (mid 1990s),
specimens. A. borealis reached highest Mn/Cashell values of 114                       monthly Mn/Cashell values of different A. borealis specimens
µmol/mol at the age of eight (month 96), ca. 40 µmol/mol at age                       deviated by nearly 750% (40 µmol/mol), while specimens MLZ-
23 (month 276), and a minimum of 6 µmol/mol at age 35 (month                          FBR06-A1 and A3 were much closer together (Figure 7C).
420). Highest seasonal amplitudes during youth barely exceeded                            Aside from ontogenetic age, Mn/Cashell data were also
45 µmol/mol (Figure 5A). In contrast to Mn/Cashell values, Mg/                        statistically significantly (p < 0.0001) linearly correlated to
Cashell values increased non-linearly through lifetime (Figure 6).                    annual growth rate (Figures 8A–C) as well as other trace
For greater clarity, only one of the longest chronologies of each                     impurities (Supplements) which are governed by vital effects
species is depicted in Figure 6. Note strong seasonal oscillations                    in A. islandica and numerous other species (e.g., Lorens and
(in sufficiently resolved years) as in Mn/Cashell chronologies.                        Bender, 1980; Palacios et al., 1994; Wanamaker et al., 2008;
    When this ontogenetic age-related trend was mathematically                        Wanamaker and Gillikin, 2019). The covariation between trace
removed (and the data plotted against calendar year), the                             impurities suggests similar physiological effects have controlled
detrended Mn/Cashell curves not only revealed significant                              the incorporation of these elements into the shell carbonate. In a
differences in level and seasonal variance between conspecific                         first step, we targeted the correlation with growth rate. The
specimens as well as between species, but also some degree of                         strongest relationship between growth rate and Mn/Cashell was
running similarity (Figure 7). For example, in the 2010s, A.                          found in A. borealis (r = 0.83; p < 0.0001, also for all subsequently
islandica specimen A4 barely exceeded 29 µmol/mol, whereas                            given r-values of linear regression analyses unless otherwise
specimen A16 fluctuated between 43 and 131 µmol/mol                                    stated) and some weaker covariation in A. islandica (r = 0.60)
(Figure 7A). The three remaining specimens from Fehmarn                               and A. elliptica (r = 0.58). Once these growth rate-related kinetic
Belt were in closer agreement with each other and ranged                              effects were mathematically eliminated, the Mn/Ca shell
between 37 and 280 µmol/mol (Figure 7A). Similar                                      chronologies were in much closer agreement (Figure 9).
discrepancies in level were observed in the two Astarte species                           Mg/Ca shell molar ratios were chosen for the second
(Figures 7B, C). A. elliptica specimens A9 and A10 were in close                      detrending step, because they showed the strongest correlation

Frontiers in Marine Science | www.frontiersin.org                                 9                                            April 2022 | Volume 9 | Article 820731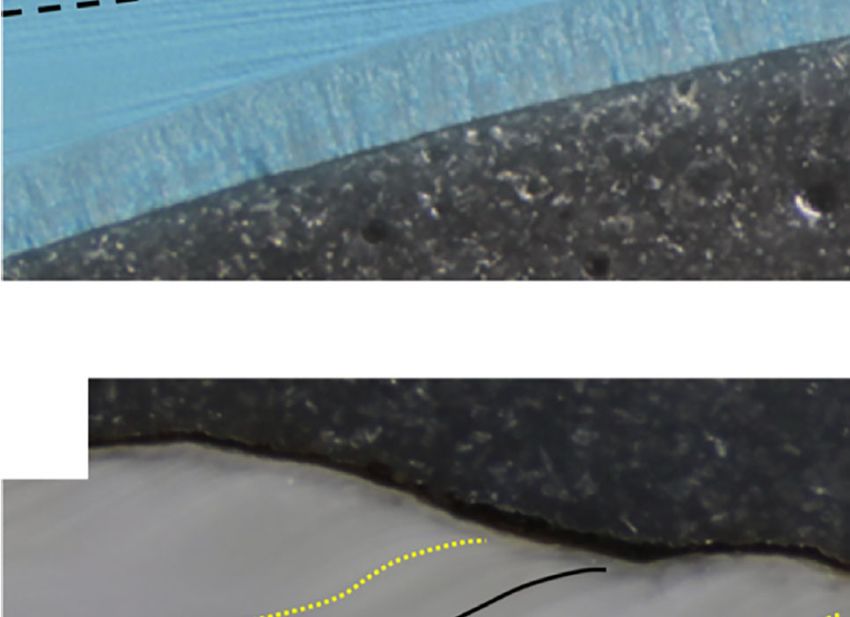
Schöne et al.                                                                                                                        Bivalve Mn/Cashell Species Comparison

                                  A

                                  B

                                   C

 FIGURE 5 | Mn/Cashell chronologies (monthly resolution) reveal striking ontogenetic trends to lower values. (A) A. islandica; (B) A. elliptica; (C) A. borealis.

with growth rate-detrended Mn/Cashell among all measured                                  Mn/Ca vs. Mg/Ca in fish otoliths (Limburg et al., 2011) as well as
element-to-Ca ratios (Figures 8D–F). This approach followed                               Li/Ca vs. Sr/Ca or Mg/Ca in foraminifera, cold-water corals and
previous successful attempts to remove vital effects from a                               bivalves (Bryan and Marchitto, 2008; Case et al., 2010;
desired element-to-Ca ratio by normalization with another                                 Füllenbach et al., 2015; Rollion-Bard and Blamart, 2015). The
biologically controlled element-to-Ca value. Examples include                             double detrending approach (annual growth rate and Mg/Cashell)

Frontiers in Marine Science | www.frontiersin.org                                    10                                              April 2022 | Volume 9 | Article 820731
Schöne et al. Bivalve Mn/Cashell Species Comparison
FIGURE 6 | Mg/Cashell chronologies (monthly resolution) of long-lived specimens of A. islandica (MLZ-FBR36-A4), A. elliptica (MLZ-FBR36-A9) and A. borealis (MLZ-
FBR06-A3) reveal distinct seasonal oscillations and a gradual increase through lifetime.
further constrained the similarity between the Mn/Cashell curves age of ten, Mn/Cashell data of all A. islandica were strongly
and shifted them slightly closer together; Supplements) and linearly correlated to DO (R2adj = 0.56; p < 0.0001) (Figure 11B).
more importantly, increased the agreement between Mn/Cashell More importantly, the regression lines of the three species
and DO, as outlined in the following. showed more similar slopes if data from the first nine years of
life of the ocean quahog were omitted (A. islandica: –39 instead
3.4 Relationship Between Mn/Cashell Data of –71, A. elliptica: –57, and A. borealis: –40 µmol/mol Mn/Cashell
and DO Concentration per mL/L DO) (Figure 11B). When the data of all three species
To evaluate the effect of the different detrending methods, Mn/ were combined in a single linear regression model, the adjusted
Cashell data of bivalves dwelling at the seafloor were compared R2 value equaled 0.27, whereas a combination of A. islandica and
with DO concentration measured some decimeters above A. elliptica provided a much higher adjusted R2 value of 0.53. The
seafloor (Figure 10). Ontogenetic age-detrended Mn/Cashell p-values of all linear regression analyses were smaller than 0.0001
data revealed only moderate linear correlations with seasonal unless otherwise stated (Supplements).
DO extremes (R2adj range between 0.20 and 0.33), and the Tentative predictive models for the three studied species are
relationships varied notably between species, i.e., both the depicted in Figure 12. As above, for A. islandica only data from
slopes and intercept deviated notably from each other age ten onward were considered. According to these models,
(Figure 10A). Annual growth rate-detrending brought the Mn/Cashell data of A. elliptica can provide the most precise DO
species-specific regression lines much closer together, estimates, i.e., ± 1.5 mL/L. Slightly larger 1s uncertainties are
specifically that of A. islandica and A. elliptica, and also involved when A. islandica or A. borealis are used (both: ± 1.6
resulted in more coherent relationships between Mn/Cashell mL/L DO). A combination of data from A. elliptica and A.
and DO concentration (R2adj range between 0.31 and 0.53) islandica is associated with an uncertainty of ±1.5 mL/L DO, and
(Figure 10B). The double-detrending approach further a mix of all studied specimens comes with an uncertainty of ±1.7
substantiated the correlations (R2adj of A. islandica = 0.38, A. mL/L DO (Supplements). Following these transfer functions, in
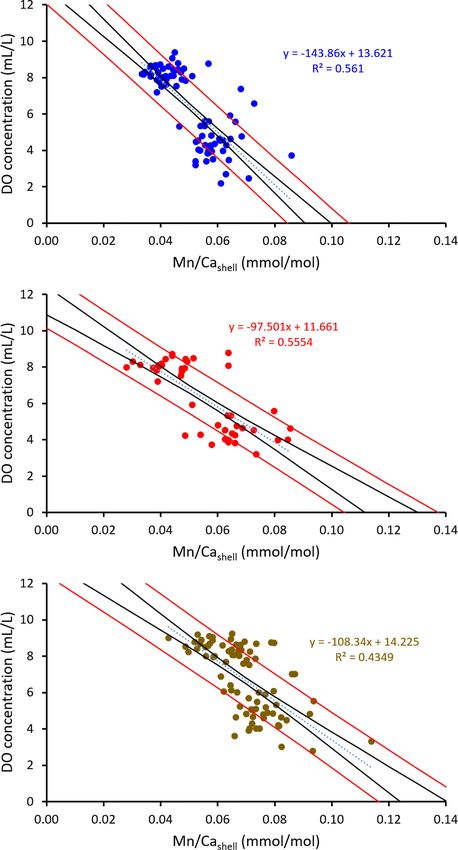
elliptica = 0.56, and A. borealis = 0.43) (Figure 10C). A. islandica, A. elliptica and A. borealis, an increase by 10 µmol/
Despite double-detrending, however, the cross-plot of DO vs. mol Mn/Cashell reflects a decrease in DO by 1.44, 0.98, and 1.08
Mn/Cashell of A. islandica still exhibited a relatively large scatter mL/L, respectively.
which accounted for the relatively low R2 values (Figure 10C).
This largely resulted from a strong non-linear (here: exponential)
relationship of Mn/Cashell with DO in the younger shell portions 4 DISCUSSION
of specimens MLZ-FBR36-A6, A7, A15 and A16 (Figure 11A).
However, data of specimen MLZ-FBR-A4 plotted near the data The present study adds further support to the hypothesis that
of all specimens from Mecklenburg Bight (St12), i.e., individual molar Mn/Ca data of bivalve shells can provide temporally well-
differences rather than locality-specific differences prevailed constrained records of DO in the free water column (Zhao et al.,
(Figure 11A). A linear regression was performed on the DO 2017a; Schöne et al., 2021). Like other redox-sensitive elements,
concentrations and the logarithm-transformed Mn/Cashell data manganese becomes dissolved (as Mn 2+ ) under reducing
to explore their potential significant relationship provided by p- conditions (Hem, 1963; Balzer, 1982; Rue et al., 1997) and –
values (see Supplements). For all except two specimens (FBR36- against thermodynamic expectations – can remain for a while in
A16 and St12-A7), p was better than 0.05. In contrast, after the this bioavailable form even under the presence of oxygen (Tebo,
Frontiers in Marine Science | www.frontiersin.org 11 April 2022 | Volume 9 | Article 820731Schöne et al. Bivalve Mn/Cashell Species Comparison
A
B
C
FIGURE 7 | After removal of ontogenetic age-related trends (compare Figure 5), Mn/Cashell chronologies (monthly resolution) reveal distinct differences between
conspecific specimens during the same calendar year. (A) A. islandica; (B) A. elliptica; (C) A. borealis.
1991), possibly mediated by organic substances (Kremling and As shown here, besides A. islandica two other species, i.e., A.
Petersen, 1978). Relative to permanently well-oxygenated elliptica and A. borealis can likewise serve as proxy archives for
settings in the North Atlantic, manganese was significantly dissolved oxygen levels in the water column. Once corrected for
enriched in studied bivalve shells from the Baltic Sea (this shell growth rate-related kinetic effects and (some) vital effects,
study and Schöne et al., 2021). For example, shells of A. Mn/Cashell data (age ten onward in A. islandica) of bivalves living
islandica from nearshore coastal sites in NE Iceland contained, at the seafloor are statistically significantly (p < 0.0001)
on average, only 2 µmol/mol Mn/Cashell and extremes barely correlated to DO concentration measured some decimeters
reached 5 µmol/mol (Marali et al., 2017a). In contrast, respective above the sediment surface (r = –0.66 to –0.75, corresponding
values in conspecific specimens from the Fehmarn Belt and to 43 to 56% explained variability) (Figure 12). According to the
Mecklenburg Bight were, on average, 21 times higher (approx. tentative models developed here, A. elliptica can provide slightly
42 µmol/mol), and peaks (undetrended monthly data) can attain more precise DO data ( ± 1.5 mL/L) than A. islandica or A.
more than 300 µmol/mol Mn/Cashell (Schöne et al., 2021). borealis ( ± 1.6 mL/L).
Frontiers in Marine Science | www.frontiersin.org 12 April 2022 | Volume 9 | Article 820731Schöne et al. Bivalve Mn/Cashell Species Comparison
A D
B E
C F
FIGURE 8 | Linear relationship between monthly Mn/Cashell and annual growth rate before (A-C) and after detrending with Mg/Cashell data (D-F). (A, D) A. islandica,
station FBR36; (B, E) A. elliptica, FBR36; (C, F) A. borealis, FBR06. All correlations were highly significant at p < 0.0001.
4.1 Advantages and Disadvantages fragile shells, the bivalve is less well protected against predators
of the Three Studied Species for and possibly prone to damage by bottom-trawling (Rumohr and
DO Reconstructions Krost, 1991) and may thus not attain the extraordinary lifespan
The prediction interval (Figure 12) certainly is a relevant reported from well-oxygenated sites in the North Atlantic, i.e., up
criterion to determine which species might be the most to 500 years (Schöne, 2013; Butler et al., 2013). At least, the
suitable archive to reconstruct DO, but no major differences ontogenetic age of the oldest and largest specimen (Table 1),
were observed between the three species (uncertainties of ±1.5 to arbitrarily selected for the present study, remained well beyond
1.6 mL/L DO). Several other aspects should be considered as well the longevity for which A. islandica is renowned. Studied A.
including longevity, continued shell production under low DO borealis attained higher ages than A. islandica (Table 1).
levels and fluctuating salinity, distinctness of annual growth While all three studied species can survive hypoxic, anoxic
lines, growth pattern geometry and temporal resolution. and even euxinic conditions for several months (Theede et al.,
Shells of the ocean quahog in the Baltic Sea were considerably 1969; Weigelt & Rumohr, 1986; Oeschger, 1990; Oeschger and
thinner than at most other sites. For example, the oldest Storey, 1993) and resist large salinity swings (von Oertzen and
specimen hardly measured more than one millimeter in Schlungbaum, 1972; von Oertzen, 1973), biomineralization rates
thickness (Figure 2A). Predominantly, this resulted from a of A. islandica were more severely affected by adverse
very thin, severely eroded or even missing inner shell layer environmental conditions than such of Astarte spp. Annual
(Figure 2A; see also Schöne, 2013). Like the two Astarte growth patterns of A. islandica were much more difficult to
species, to survive under hostile environmental conditions, the identify than typically at well-oxygenated, fully marine sites and
ocean quahog switches into an anaerobic metabolism during less distinct than in the two Astartidae. In the ventral margin, the
which acidic metabolites are generated which are subsequently annual growth lines were only faintly developed and could hardly
neutralized by the dissolution of inner shell surfaces (Crenshaw, be distinguished from disturbance lines (Figure 2A). It thus took
1980; Oeschger, 1990; Oeschger and Storey, 1993). However, A. considerable efforts to temporally contextualize the shell portions
islandica can also undergo self-induced anaerobiosis without a of the ocean quahog in this region. Besides disturbance lines,
clear external trigger (Taylor, 1976; Oeschger, 1990). Perhaps, several other findings suggested A. islandica experienced
the ocean quahog thus spent more time in anaerobiosis than the physiological stress as outlined in the following. With a
other two species, and consequently, its shell experienced maximum shell size increase of 6 mm per year it grew four to
stronger dissolution of inner shell surfaces. With thinner, more five times faster than Astarte spp., but annual growth rates
Frontiers in Marine Science | www.frontiersin.org 13 April 2022 | Volume 9 | Article 820731Schöne et al. Bivalve Mn/Cashell Species Comparison
A
B
C
FIGURE 9 | After removal of annual growth rate-related trends (compare Figures 8A–C), Mn/Cashell chronologies (monthly resolution; agd, annual growth rate
detrended) plotted closer together and revealed a larger degree of running similarity. (A) A. islandica; (B) A. elliptica; (C) A. borealis.
remained approx. two to four times below that observed in this energy is available for growth and reproduction. Furthermore,
species at well-oxygenated, stenohaline sites in the North the physiological resistance of A. islandica against oxygen
Atlantic (e.g., up to 20 mm per year around the coasts of the deficiency and hydrogen sulfide is significantly lower than that
British Isles; personal observation, BRS). While food supply was of the Astarte spp. (von Oertzen and Schlungbaum, 1972; von
certainly not a limiting growth factor, because the Baltic Sea is Oertzen, 1973; Theede, 1973; Dries and Theede, 1974).
heavily eutrophicated (Conley et al., 2007), variable salinity and Therefore, it appears likely that salinity fluctuations, low
low-oxygen stress (Table 1) could have adversely affected shell oxygen levels and more frequent anaerobiosis resulted in lower
production rates. The ocean quahog survives salinity stress better biomineralization rates in the ocean quahog and eventually the
than Astarte (von Oertzen and Schlungbaum, 1972; von Oertzen, formation of numerous disturbance lines.
1973), but likely on the expense of a reduced biomineralization Both Astarte species seem to have coped better with the
rate. If more energy needs to be devoted to osmoregulation, less hostile environmental conditions, at least the biomineralization
Frontiers in Marine Science | www.frontiersin.org 14 April 2022 | Volume 9 | Article 820731Schöne et al. Bivalve Mn/Cashell Species Comparison
A
B
C
FIGURE 10 | Effect of different detrending techniques on the linear relationship between Mn/Cashell of bivalves dwelling at seafloor and DO concentration measured
some decimeters above seafloor. All correlations were highly significant at p < 0.0001. (A) Ontogenetic age trends removed; (B) Annual growth rate-detrended and
(C) double detrended data, i.e., correlation between Mn/Cashell with annual growth rate and Mg/Cashell mathematically eliminated. Blue = A. islandica; red = A.
elliptica; brown = A. borealis.
Frontiers in Marine Science | www.frontiersin.org 15 April 2022 | Volume 9 | Article 820731Schöne et al. Bivalve Mn/Cashell Species Comparison
A
B
FIGURE 11 | (A) During early ontogeny (below age 10), Mn/Cashell revealed non-linear relationships (here exponential fits used), even after double-detrending (=
correlation between Mn/Cashell with both annual growth rate and Mg/Cashell mathematically eliminated). Significance levels were determined on the basis of linear
regression models. Accordingly, except for specimens FBR36-A16 and St12-A7, all correlations were highly significant at p < 0.05. Trends varied between
specimens, not localities. St12 = Mecklenburg Bight, FBR36 = Fehmarn Belt. (B) If the data from shell portions formed prior to age 10 were omitted, the relationship
between Mn/Cashell of A. islandica and DO concentration measured some decimeters above seafloor became much stronger. All correlations were highly significant
at p < 0.0001. (Compare Figure 10C).
processes did not seem to have been impacted as much. The the coldest or warmest season suggesting that Mg and Sr were
shells were thick (see also Oeschger, 1990; Rumohr and Krost, not primarily governed by temperature.
1991) and the inner shell layers fully developed without signs of While A. elliptica can provide slightly more precise DO
significant dissolution. Judging from fewer disturbance lines, the estimates than the other two species (Figure 12), the
biomineralization process was also less frequently interrupted. disadvantage is its relatively short lifespan of only twenty years
Thus, their shells may provide a more reliable and more or so (Table 1). Furthermore, strong undulations of the outer
complete record of the ocean oxygenation than the ocean shell layer that mirrored spiral ridges of the outer shell surface
quahog. The recognition of annual growth lines was much (Figure 2B), made sampling a challenging task and often
easier in the astartids, specifically in A. elliptica. Besides the resulted in strongly time-averaged chemical data. Such
presence of blue-stained annual bands and lines after immersion difficulties were not encountered in A. borealis (Figure 2C).
in Mutvei’s solution, sharp Mg/Cashell peaks and troughs aided in This species only showed a weak wavy sculpture that barely
the identification of the annual growth lines in this species. Note affected the geometry of growth patterns in the outer shell layer.
that these Mg (as well as Sr) enrichments did not coincide with A. borealis attained the longest lifespan of the studied species
Frontiers in Marine Science | www.frontiersin.org 16 April 2022 | Volume 9 | Article 820731You can also read