U.S. Solar Photovoltaic System and Energy Storage Cost Benchmark: Q1 2020 - David Feldman, Vignesh Ramasamy, Ran Fu, Ashwin Ramdas, Jal Desai, and ...
←
→
Page content transcription
If your browser does not render page correctly, please read the page content below
U.S. Solar Photovoltaic System
and Energy Storage Cost
Benchmark: Q1 2020

David Feldman, Vignesh Ramasamy,
Ran Fu, Ashwin Ramdas, Jal Desai, and
Robert Margolis

January 2021
Contents Introduction

 • Introduction and Key Definitions
 • Overall Model Outputs
 • Market Study and Model Inputs
 • Model Output: Residential PV
 • Model Output: Commercial PV
 • Model Output: Utility-Scale PV
 • Residential PV-Plus-Storage
 • Commercial PV-Plus-Storage
 • Utility-Scale PV-Plus-Storage
 • Conclusions
 NREL | 2
Introduction
 NREL has been modeling U.S. solar photovoltaic (PV) system costs since 2009.
 This year, our report benchmarks costs of U.S. PV for residential, commercial,
 and utility-scale systems, with and without storage, built in the first quarter of
 2020 (Q1 2020).

 Our benchmarking method includes bottom-up accounting for all necessary system and project-
 development costs incurred when installing residential, commercial, and utility-scale systems, and it
 models the Q1 2019 and Q1 2020 costs for such systems, excluding any previous supply
 agreements or contracts. In general, we attempt to model the typical installation techniques and
 business operations from an installed-cost perspective, and our benchmarks are national averages.
 The residential PV-only benchmark and the commercial rooftop PV-only benchmark average costs
 by inverter type (string inverters, string inverters with direct current [DC] optimizers, and
 microinverters), weighted by inverter market share. The residential PV-only benchmark is further
 averaged across small installer and national integrator business models, weighted by market share.
 All benchmarks include variations—accounting for the differences in size, equipment, and
 operational use (particularly for storage)—that are currently available in the marketplace. All
 benchmarks assume nonunionized construction labor; residential and commercial PV systems
 predominantly use nonunionized labor, and the type of labor required for utility-scale PV systems
 depends heavily on the development process. All benchmarks assume the use of monofacial
 monocrystalline silicon PV modules. Benchmarks using cadmium telluride (CdTe) or bifacial modules
 could result in significantly different results. The data in this annual benchmark report inform the
 formulation of and track progress toward the U.S. Department of Energy (DOE) Solar Energy
 Technologies Office’s (SETO’s) Government Performance and Reporting Act (GPRA) cost targets.

 NREL | 3
Introduction
 The benchmark report builds on several previous publications from NREL and Lawrence
 Berkeley National Laboratory:

 • Barbose, Galen and Naïm Darghouth. 2019. Tracking the Sun: Pricing and Design Trends for Distributed
 Photovoltaic Systems in the United States 2019 Edition. Berkeley, CA: Lawrence Berkeley National Laboratory.
 November 2019. https://eta-publications.lbl.gov/sites/default/files/tracking_the_sun_2019_report.pdf.

 • Bolinger, Mark, Joachim Seel, and Dana Robson. 2019. Utility-Scale Solar: Empirical Trends in Project
 Technology, Cost, Performance, and PPA Pricing in the United States: 2019 Edition. Berkeley, CA: Lawrence
 Berkeley National Laboratory. https://emp.lbl.gov/publications/utility-scale-solar-empirical-trends.

 • Fu, Ran, David Feldman, and Robert Margolis. 2018. U.S. Solar Photovoltaic System Cost Benchmark:
 Q1 2018. NREL/TP-6A20-72399. Golden, CO: National Renewable Energy Laboratory.
 https://www.nrel.gov/docs/fy19osti/72399.pdf.

 • Fu, Ran, Timothy Remo, and Robert Margolis. 2018. 2018 U.S. Utility-Scale Photovoltaics-Plus-Energy Storage
 System Costs Benchmark. NREL/TP-6A20-71714. Golden, CO: National Renewable Energy Laboratory.
 https://www.nrel.gov/docs/fy19osti/71714.pdf.

 • Ardani, Kristen, Eric O’Shaughnessy, Ran Fu, Chris McClurg, Joshua Huneycutt, and Robert Margolis. 2017.
 Installed Cost Benchmarks and Deployment Barriers for Residential Solar Photovoltaics with Energy Storage:
 Q1 2016. Golden, CO: National Renewable Energy Laboratory. NREL/TP-7A20- 67474.
 https://www.nrel.gov/docs/fy17osti/67474.pdf.

 • Feldman, David, Galen Barbose, Robert Margolis, Mark Bolinger, Donald Chung, Ran Fu, Joachim Seel,
 Carolyn Davidson, Naïm Darghouth, and Ryan Wiser. 2015. Photovoltaic System Pricing Trends, Historical,
 Recent, and Near-Term Projections. Golden, CO: National Renewable Energy Laboratory. NREL/PR-6A20-
 64898. https://www.nrel.gov/docs/fy15osti/64898.pdf.
 NREL | 4
Introduction
 Download the full technical report and the data file:

 • Full report: https://www.nrel.gov/docs/fy21osti/77324.pdf
 • Data file: https://doi.org/10.7799/1762492

 Acronyms are defined at the end of this publication.

 NREL | 5
Key Definitions

 Unit Description
 Value 2019 U.S. dollar (USD)
 System Size PV systems are quoted in direct current (DC) terms; inverter prices are converted by
 DC-to-alternating current (AC) ratios; storage systems are quoted in terms of kilowatt-
 hours or megawatt-hours (kWh or MWh) of storage or the number of hours of storage
 at peak capacity.
 Sector Category Description Size Range
 Residential PV Residential rooftop systems 4 kW–7 kW
 Commercial PV Commercial rooftop systems, ballasted racking 100 kW–2 MW
 Utility-Scale PV Ground-mounted systems, fixed-tilt and one-axis tracker 5 MW–100 MW

 NREL | 6
Key Changes from Previous Reports

 • Values are inflation-adjusted using the CPI (2019). Thus, historical values from our models are
 adjusted and presented as real USD instead of nominal USD.
 • Our Q1 2019 and Q1 2020 benchmarks use monocrystalline PV modules, whereas all historical
 benchmarks used multicrystalline PV modules. This switch reflects the overall trend occurring in the
 U.S. market.
 • In the Q1 2020 residential benchmark analysis, we expand our modeling of customer acquisition,
 engineering, PII, and overhead. In addition to providing finer cost granularity, we include additional
 costs borne by many U.S. installers that were not captured in previous editions; therefore, our
 benchmarked soft costs in this report are higher than those in previous reports.
 • For previous editions of this report, we assumed a land acquisition cost of $0.03/W. Based on Wiser et
 al. (2020), which stated that most utility-scale PV projects do not own the land on which PV systems
 are placed, we have reclassified land costs from an up-front capital expenditure (land acquisition) to
 an operating expenditure (lease payments) for 2019 and 2020.
 • The current versions of our cost models make a few significant changes from the versions used in our
 Q1 2018 benchmark report (Fu, Feldman, and Margolis 2018). To better distinguish the historical cost
 trends over time from the changes to our cost models, we also calculate Q1 2019 and Q1 2020 PV
 benchmarks using the Q1 2018 versions of the residential, commercial, and utility-scale PV models.

 NREL | 7
Contents

 • Introduction and Key Definitions
 • Overall Model Outputs
 • Market Study and Model Inputs
 • Model Output: Residential PV
 • Model Output: Commercial PV
 • Model Output: Utility-Scale PV
 • Residential PV-Plus-Storage
 • Commercial PV-Plus-Storage
 • Utility-Scale PV-Plus-Storage
 • Conclusions
 NREL | 8
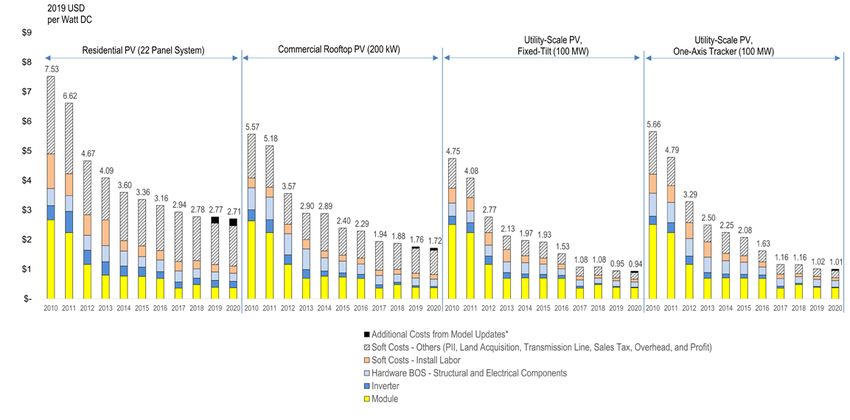
Overall Stand-Alone PV Model Results (Total Installed Cost)

1. Values are inflation adjusted using the CPI (2019). Thus, historical values from our models are adjusted and presented as real USD instead of nominal USD.
2. Cost categories are aggregated for comparison purposes. “Soft Costs – Others” represent PII; land acquisition; sales tax; and EPC/developer overhead and
 net profit.
3. The current versions of our cost models make a few significant changes from the versions used in our Q1 2018 benchmark report (Fu, Feldman, and
 Margolis 2018) and incorporate costs that had previously not been benchmarked in as much detail. To better distinguish the historical cost trends from the
 changes to our cost models, we also calculate Q1 2019 and Q1 2020 PV benchmarks using the Q1 2018 versions of the residential, commercial, and utility-
 scale PV models. The “Additional Costs from Model Updates” category represents the difference between modeled results.
 NREL | 9
Overall Stand-Alone PV Model Results (Q1 2019 vs. Q1 2020)

 Sector Residential PV Commercial PV Utility-Scale PV, One Axis Tracking

 Q1 2019 benchmarks
 $2.77 $1.76 $1.02
 in 2019 USD/WDC

 Q1 2020 benchmarks
 $2.71 $1.72 $1.01
 in 2019 USD/WDC
 • Higher module efficiency
 • Lower material and equipment
 • Higher module efficiency • Higher module efficiency
 costs in some categories
 Drivers of (from 19.2% to 19.5%) • Lower material and
 • Movement of land acquisition
 Cost Decrease • Decrease in BOS hardware equipment costs in some
 cost from upfront capital
 and supply chain costs categories
 expenditures into operation
 and maintenance

 • Higher labor wages • Higher labor wages
 Drivers of • Higher module costs • Higher labor wages • Higher steel prices
 Cost Increase • Higher module costs • Higher module and inverter
 costs

 NREL | 10
Overall Stand-Alone PV Model Results (Soft Cost)

 1. A “soft cost” in the benchmark report is defined as a nonhardware cost—i.e., “Soft Cost” = Total Cost - Hardware Cost
 (module, inverter, and structural and electrical BOS).
 2. The residential and commercial sectors have larger soft cost percentages than the utility-scale sector.
 3. Soft costs and hardware costs interact with each other. For instance, module efficiency improvements have reduced the
 number of modules required to construct a system of a given size, thus reducing hardware costs, and this trend has also
 reduced soft costs from direct labor and related installation overhead.
 4. An increasing soft cost proportion in this figure indicates that soft costs declined more slowly than hardware costs; it does
 not indicate that soft costs increased on an absolute basis. NREL | 11
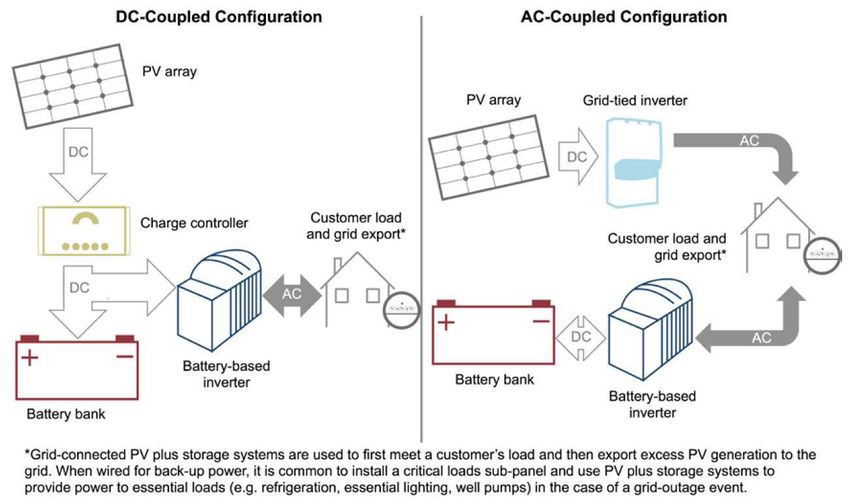
Overall Stand-Alone PV Model Results (LCOE)

 The reductions in total capital cost, along with improvements in operation, system design, and technology have resulted in significant
 reductions in the cost of electricity. U.S. residential and commercial PV systems are 93% and 97% toward achieving SETO’s 2020
 electricity price targets, and U.S. utility-scale PV systems have achieved their 2020 SETO target three years early.
 Note that we use fixed-tilt systems for LCOE benchmarks from 2010 to 2015 and then switch to one-axis tracking systems from 2016
 to 2020 to reflect the market share change in the utility-scale PV sector. All detailed LCOE values can be found in the appendix. NREL | 12
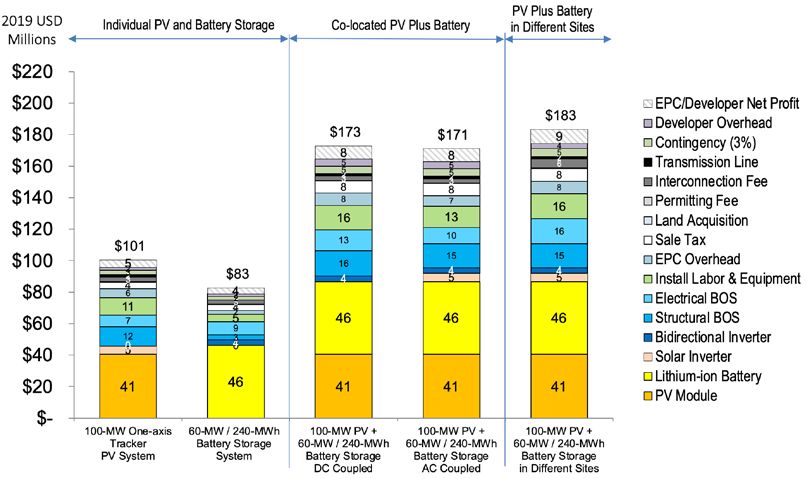
Utility-Scale PV-Plus-Storage Model Results (Total Installed Cost)

 1. There were 9% and 8% reductions in utility-scale PV-plus-storage benchmarks between 2018 and 2020
 for DC-coupled and AC-coupled systems respectively.
 2. Approximately 28%–30% of total cost reductions can be attributed to lithium-ion battery and
 bidirectional inverter cost reductions.
 3. Although there are some configuration differences between AC-coupled and DC-coupled systems (e.g.,
 the inverter, structural BOS, and electrical BOS), the total cost difference between them is only 1%.

 NREL | 13
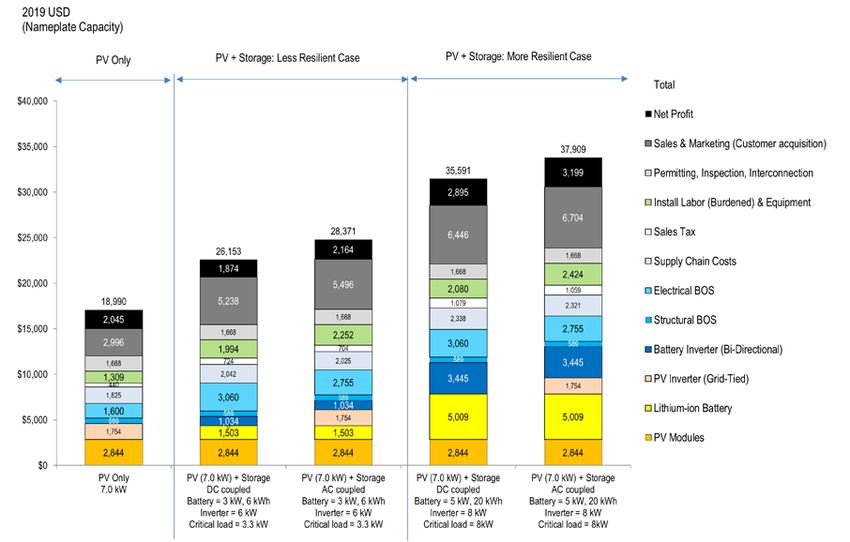
Residential PV-Plus-Storage Model Results (Total Installed Cost)

 1. There were 11% and 25% reductions in residential PV-plus-storage benchmarks between 2016 and 2020 for
 AC-coupled less-resilient and more-resilient cases respectively.
 2. Most of these reductions can be attributed to reductions in the cost of PV modules and AC-coupled batteries.
 3. The cost reductions occurred despite the rated capacity of the 22-module system increasing from 5.6 kW to
 7.0 kW between 2016 and 2020.

 NREL | 14
Overall PV-Plus-Storage Model Results (LCOSS)

 For the Q1 2020 benchmark report, we derive a formula for the levelized cost of solar-plus-storage (LCOSS) to better
 demonstrate the total cost of operating a PV-plus-storage plant, on a per-megawatt-hour basis. The above figure shows the
 resulting LCOSS for colocated AC-coupled PV-plus-storage systems for each market segment, as well as the LCOE of stand-
 alone PV systems.

 For residential PV-plus-storage, LCOSS is calculated to be $201/MWh without the federal ITC and $124/MWh with the 30% ITC.
 For commercial PV-plus-storage, it is $113/MWh without the ITC and $73/MWh with the 30% ITC. For utility-scale PV-plus-
 storage, it is $83/MWh without the ITC and $57/MWh with the 30% ITC.
 NREL | 15
Contents

 • Introduction and Key Definitions
 • Overall Model Outputs
 • Market Study and Model Inputs
 • Model Output: Residential PV
 • Model Output: Commercial PV
 • Model Output: Utility-Scale PV
 • Residential PV-Plus-Storage
 • Commercial PV-Plus-Storage
 • Utility-Scale PV-Plus-Storage
 • Conclusions
 NREL | 16
Module Efficiency Trends

 Since 2010, efficiencies for monocrystalline and multicrystalline modules have steadily improved, with the capacity-
 weighted average multicrystalline module efficiency for 60- and 72-cell modules increasing 0.3%–0.4% each year in
 absolute terms, on average. CA NEM values line up very closely with the national averages reported in Tracking the
 Sun. CA NEM reports a Q1 2020 capacity-weighted average monocrystalline module efficiency of 19.5%. Because
 module selection may vary by region and sector, the capacity-weighted average module efficiencies (and module
 prices) may be different in some regions and sectors.

 NREL | 17
PV Installations by Technology

 In the Q1 2020 benchmark report, we model systems using monocrystalline PV modules rather than the
 multicrystalline modules we modeled previously, because of the overall shift in the United States to using more
 monocrystalline modules since 2016.

 NREL | 18
PV System Size Trend

 This figure displays average system sizes from the Tracking the Sun data set. As in previous years,
 we assume a 22-module design for our residential PV system benchmark, which results in a system
 size of 7.0 kW, based on the assumed Q1 2020 average monocrystalline module efficiency.

 Commercial system sizes have varied more, which likely reflects the wide range of users (e.g., office
 buildings, malls, and retail stores). We use 200 kW and 500 kW as the baseline cases in our
 commercial rooftop and ground-mounted PV models respectively.

 NREL | 19
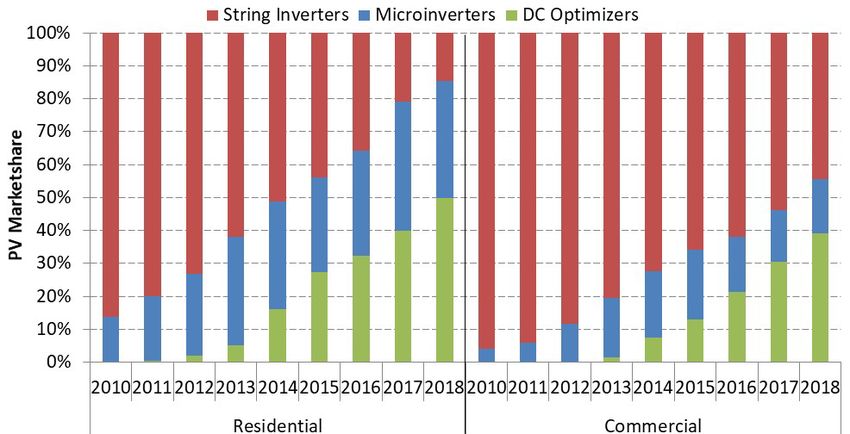
U.S. Residential and Commercial Inverter Market

 Market uptake of MLPE has been growing rapidly since 2010 in California’s residential sector. This increasing market growth may
 be driven by decreasing MLPE costs and by the “rapid shutdown” of PV output from buildings required by Article 690.12 of the
 National Electric Code (NEC) since 2014—MLPE inherently meet rapid-shutdown requirements without the need to install additional
 electrical equipment.
 For residential system costs, we model the string inverter, power optimizer, and microinverter options separately, and we use their
 market shares (14.6%, 49.8%, and 35.6%) in our Q1 2020 model for the weighted-average case.
 In past years, we only assumed string inverters for the commercial PV benchmark, rather than weighting by MLPE share; this year,
 we also weight the commercial rooftop PV benchmark by MLPE share (45% for three-phase string inverters, 39% for power
 optimizers, and 16% for microinverters), because of changes to the NEC. NREL | 20
Inverter Price

 We source inverter prices from Wood Mackenzie (2014a, 2014b, 2019a, 2020) and Wood Mackenzie and SEIA
 (2020). Data are also supplemented, in 2010 and 2011, using revenue per-watt shipped data from Enphase (2019)
 for microinverters.

 NREL | 21
Inverter Price and DC-to-AC ratios
 Inverter Type Sector $ per WattAC DC-to-AC Ratio $ per WattDC

 Single-phase string inverter Residential PV (non-MLPE) 0.15 1.11 0.14

 Residential and commercial
 Microinverter 0.34 1.16 0.29
 PV (MLPE)

 DC power optimizer, single-
 Residential PV (MLPE) 0.30 1.16 0.26
 phase string inverter

 Three-phase string inverter Commercial PV (non-MLPE) 0.08 1.11 0.07

 DC power optimizer, three-
 Commercial PV (MLPE) 0.14 1.16 0.12
 phase string inverter

 Central inverter Utility-scale PV (fixed-tilt) 0.07 1.37 0.05

 Utility-scale PV (1-axis
 Central inverter 0.07 1.34 0.05
 tracker)

 All inverter prices include the cost of monitoring equipment.
 We convert the USD/W AC inverter prices from previous inverter price figures to USD per WattDC (W DC) using different DC-to-AC
 ratios (table above). In our benchmark, we use USD/W DC for all costs, including inverter prices. Note that we updated the central
 inverter DC-to-AC ratios using Lawrence Berkeley National Laboratory data (Bolinger, Seel, and Robson 2019; Barbose and
 Darghouth 2019).
 NREL | 22
Module Price (U.S. vs. Global)

 We assume an ex-factory gate (spot or first-buyer) price of
 $0.41/WDC for Tier 1 monocrystalline-silicon PV modules in Q1
 2020. U.S. spot prices rose in 2017 as global spot prices
 continued to decline. Several factors, including U.S. policy on
 imported modules, may have contributed to the divergence
 between U.S. and global spot prices. In early 2018, U.S. spot
 prices began to drop again; in Q1 2020, U.S. module prices
 continued to fall, dropping close to their lowest recorded levels,
 but monocrystalline modules were still trading at a significant
 premium over the global module average selling price (ASP).

 In the past few years, the U.S. market has had such an
 increasing demand for monocrystalline modules that by 2020
 there was not enough demand for multicrystalline modules to
 give an “apples-to-apples” comparison of U.S. spot pricing in Q1
 2020; therefore, when comparing the two technologies, we
 model Q1 2019 costs. In Q1 2019, we assume an ex-factory
 gate price of $0.40/WDC for Tier 1 monocrystalline modules and
 $0.33/WDC for Tier 1 multicrystalline modules, based on Wood
 Mackenzie and SEIA (2020).

 NREL | 23
Module Price Inputs: Q1 2020
 Although commercial and utility-scale PV developers typically can procure modules at or near the spot price, residential
 integrators and installers incur additional supply chain costs (see below). Historical inventory price can create a price lag
 (approximately 6 months) for the market module price in the residential sector when the modules from previous procurement
 are installed in today’s systems. In our Q1 2020 residential PV benchmark, this supply chain cost equates to a $0.02/W (6%)
 premium. We assume small installers and national integrators are both subject to a 15% ($0.06/W) premium on the spot price
 for module shipping and handling, consistent with Q1 2018 residential PV benchmark. Small installers are subject to an
 additional 20% ($0.09/W) premium owing to small-scale procurement (Bloomberg 2018). Both types of companies are also
 subject to 5% sales tax (weighted national average), bringing the small installer module cost to $0.61/W and the national
 integrator cost to $0.52/W.

 NREL | 24
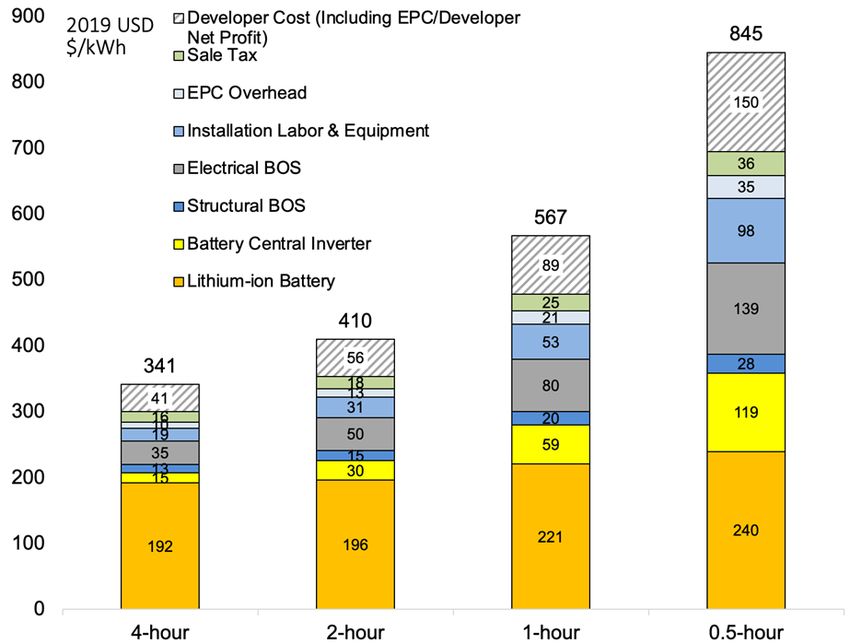
Li-ion Battery Price by Product

 Lithium-ion battery spot prices declined substantially (87%) between 2010 and 2019. From 2018 to 2019 alone, prices dropped 13%.
 The Li-ion battery pack price from Bloomberg New Energy Finance (BNEF) refers to the volume-weighted average of automotive
 and stationary storage. In previous years, we used the volume-weighted average (i.e., the “Li-ion battery pack” price) because of a
 lack of data for stationary storage with different durations. In the Q1 2020 benchmark report, we use BNEF (2019b) stationary
 storage cost data, differentiated by market segment and hours of storage. Although not referenced in this benchmark report, BNEF
 also provides commercial and utility battery rack data for 30-minute and 2-hour storage products.

 NREL | 25
Operation and Maintenance

In Fiscal Year 2018, a PV operation and maintenance (O&M) working group that was convened under the sponsorship of DOE’s SETO developed a model to
calculate the cost associated with PV system O&M (Walker et al. 2020). A total of 133 measures in the cost model are sorted into 9 O&M cost categories:
inverter replacement, operations administration, module replacement, components parts replacement, system inspection and monitoring, module cleaning
and/or vegetation and pest management, land lease, property tax, and insurance, asset management, and security. The current benchmarks are
$28.94/kWDC/yr (residential), $18.55/kWDC/yr (commercial; roof-mounted), $18.71/kW DC/yr (commercial; ground-mounted), $16.32/kWDC/yr (utility-scale, fixed-
tilt), and $17.46/kWDC/yr (utility-scale, single-axis tracking). NREL | 26
Contents

 • Introduction and Key Definitions
 • Overall Model Outputs
 • Market Study and Model Inputs
 • Model Output: Residential PV
 • Model Output: Commercial PV
 • Model Output: Utility-Scale PV
 • Residential PV-Plus-Storage
 • Commercial PV-Plus-Storage
 • Utility-Scale PV-Plus-Storage
 • Conclusions
 NREL | 27
Residential PV: Model Structure
 CORE COST MODEL COST
 INPUTS OUTPUTS
 DRIVERS CATEGORIES

 System Design System Hardware System Hardware
 • Available roof area • Module • Equipment costs
 Total Equipment
 • Module efficiency • Inverter • and quantities
 Costs
 • System • Structural BOS • Supply chain costs
 architecture • Electrical BOS • Sales tax

 Direct Labor
 • Electrical
 • Mechanical
 Direct/Indirect Labor
 • General
 • Wage rates by labor
 construction
 class and geography Total Direct and
 System Location
 • Person-hours per Indirect Labor Costs
 Indirect Labor
 task by labor class
 • Engineering design
 • Construction
 • Wage burden rates Total
 permit Capital
 administration Cost
 Permit, Inspection,
 and Interconnection PII Costs Total PII Costs
 (PII) Costs

 Overhead
 (General and
 administrative) Total Overhead Costs
 Company Structure Total Overhead Costs
 Sales and Marketing by Category
 (Customer
 acquisition)
 NREL | 28
Residential PV: Modeling Inputs and Assumptions
Category Modeled Value Description Sources
 Barbose and Darghouth 2019;
System size 7.0 kW Average installed size per system
 CA NEM 2020
Module efficiency 19.5% Average module efficiency CA NEM 2020
Module price $0.41/W DC Ex-factory gate (first buyer) price, Tier 1 monocrystalline modules Wood Mackenzie and SEIA 2020
 Single-phase string inverter: $0.14/W DC
 Wood Mackenzie 2020; Wood
Inverter price DC power optimizer single-phase string inverter: $0.26/W DC Ex-factory gate (first buyer) prices, Tier 1 inverters
 Mackenzie and SEIA 2020
 Microinverter: $0.29/W DC
Structural BOS (racking) $0.08/W DC Includes flashing for roof penetrations and all rails and clamps NREL 2020
 $0.18–$0.28/W DC Conductors, switches, combiners and transition boxes, as well as conduit, grounding equipment,
Electrical BOS Model assumptions, NREL 2020
 monitoring system or production meters, fuses, and breakers
 Varies by inverter option

 15% costs and fees associated with shipping and handling of equipment

Supply chain costs Additional 6% cost for historical inventory
 BLS 2019; NREL 2020;
(percentage of equipment Varies by installer type and location Additional 20% small-scale procurement for module-related supply chain costs for small installers model assumptions
costs)
 Additional 20% for inverter-related supply chain costs for small installers and 10% for national
 integrators

Sales tax National average: 5.1% Sales tax on the equipment RSMeans 2017

 Electrician: $27.47 per hour
Direct installation labor Laborer: $18.17 per hour Modeled national average labor rates BLS 2019; NREL 2020
 Hours vary by inverter option

Burden rates (percentage of Workers compensation, federal and state unemployment insurance, Federal Insurance Contributions
 Total nationwide average: 18% RSMeans 2017
direct labor) Act (FICA), builder’s risk, and public liability

 $0.23/W DC for small installers
PII $0.25/W DC for national integrators Completed and submitted applications, fees, design changes, and field inspection NREL 2020
 Varies by location

 $0.38/W DC (small installer)
Sales and marketing Initial and final drawing plans, advertising, lead generation, sales pitch, contract negotiation, and
 $0.50/W DC (national integrator) NREL 2020
(customer acquisition) customer interfacing
 Varies by location

 $0.27/W DC (small installer)
Overhead (general and Rent, building, equipment, staff expenses not directly tied to PII, customer acquisition, or direct
 $0.28/W DC (national integrator) NREL 2020
administrative) installation labor
 Varies by location

 Fixed percentage margin applied to all direct costs including hardware, installation labor, direct sales
Profit (%) 17% Fu et al. 2017
 and marketing, design, installation, and permitting fees
 NREL | 29
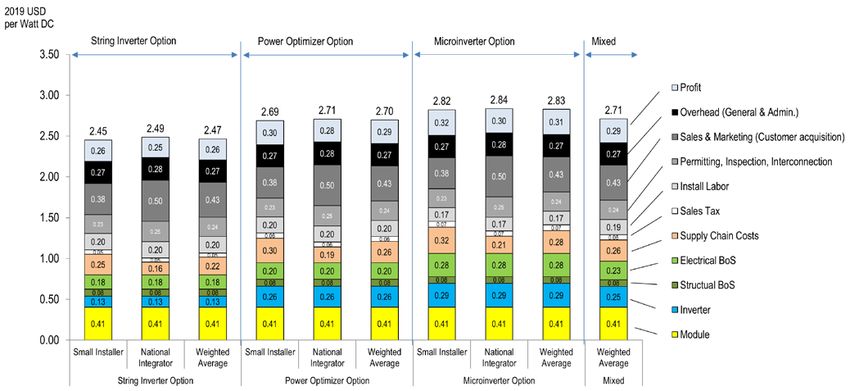
Residential PV: Model Outputs

 Q1 2020 U.S. benchmark: 7.0-kW residential system cost (2019 USD/WDC)

 This figure presents the U.S. national benchmark from our residential model. Market shares of 62% for installers and 38% for
 integrators are used to compute the national weighted average. String inverter, power optimizer, and microinverter options
 are each modeled individually, and the “mixed” case applies their market shares (14.6%, 49.8%, and 35.6%) as weightings.

 NREL | 30
Residential PV: Model Outputs

 Sensitivity analysis for Q1 2020 benchmark: Mixed 7.0-kW residential system cost (2019 USD/WDC)

 This figure presents a sensitivity analysis of the benchmark for the mixed case, with cost categories that vary by location
 and hardware specification. Inverter type has the largest impact on installed system cost, with the use of string inverters
 resulting in $2.47/WDC and the use of microinverters resulting in $2.83/WDC.

 NREL | 31
Residential PV: Model Outputs

 Q1 2020 NREL modeled cost benchmark (2019 USD/WDC) vs. Q1 2020 company-reported costs

Our bottom-up modeling approach yields a cost structure that is different than those reported by public solar integrators in their corporate filings (Sunrun 2020;
Vivint Solar 2020). Because integrators sell and lease PV systems, they practice a different method of reporting costs than do businesses that only sell goods.
Many of the costs for leased systems are reported over the life of the lease rather than the period in which the system is sold; therefore, it is difficult to
determine the actual costs at the time of the sale. Although the corporate filings from Sunrun and Vivint Solar report system costs on a quarterly basis, the lack
of transparency in the public filings makes it difficult to determine the underlying costs as well as the timing of those costs. Part of the difference in installation
costs could come from preexisting contracts or older inventory that national integrators used in systems installed in Q1 2020. NREL | 32
Residential PV: Model Outputs

 Standard residential PV installation costs versus cost for systems with necessary additions

Our benchmarking method includes bottom-up accounting for all necessary system and project-development costs incurred when installing U.S. residential PV
systems. This year, we calculate additional hardware, installation labor, and roofing costs that are often incurred for many PV systems. Because of the
requirements of some authorities having jurisdiction, or for a particular building, additional hardware and installation labor costs must be incurred. Not all U.S.
projects must incur these costs, so the average additional contribution to total PV system cost for each step is calculated by multiplying the average cost per
occurrence (either material costs or hourly wage multiplied by the number of hours) by the estimated percentage of national sales that use this step, divided by
the average conversion from this step to an installed system. The extra cost categories can add 10% to the benchmark system cost.
 NREL | 33
Residential PV: Model Outputs

 Q1 2019 cost for a residential multicrystalline PV system and Q1 2019 and Q1 2020 costs
 for a residential monocrystalline PV system

 In the Q1 2020 benchmark report, we model systems using monocrystalline PV modules, unlike previous
 editions of this report (Fu et al. 2018), for which we modeled multicrystalline PV modules. In the past few years,
 the U.S. market has had an increasing demand for monocrystalline modules. As shown above, in Q1 2019, there
 was a $0.06/W system price premium from using multicrystalline modules over monocrystalline modules for
 residential PV systems. The total system cost reductions achieved by increasing efficiency with monocrystalline
 modules outweighed the premium in monocrystalline module price. Residential PV systems using
 monocrystalline modules achieved a $0.06/W (2%) reduction in price from Q1 2019 to Q1 2020.
 NREL | 34
Residential PV: Capital Cost Benchmark Historical Trends

 From 2010 to 2020, there was a 64% reduction in the residential PV system cost benchmark. Approximately 57% of that reduction can be attributed to total
 hardware costs (module, inverter, and hardware BOS), as module prices dropped 85% over that period. An additional 20% can be attributed to labor, which
 dropped 84% over the period, and the final 22% is attributed to other soft costs, including PII, sales tax, overhead, and net profit.
 Looking at this past year, from 2019 to 2020, there was a 2% reduction in the residential PV system cost benchmark.
* The current version of our cost model makes a few significant changes from the version used in our Q1 2018 benchmark report (Fu, Feldman, and Margolis 2018), and it incorporates costs that
had previously not been benchmarked in as much detail. To better distinguish the historical cost trends from the changes to our cost models, we calculate Q1 2019 and Q1 2020 PV benchmarks
using the Q1 2018 version of the residential PV model. The “Additional Costs from Model Updates” category represents the difference between modeled results. Using the previous cost model, the
Q1 2019 and Q1 2020 benchmarks are calculated to be $2.56/W DC and $2.47/W DC respectively. NREL | 35
Residential PV: LCOE Assumptions
 2010 2011 2012 2013 2014 2015 2016 2017 2018 2019 2020
Benchmark Report
 Installed cost ($/W) 7.53 6.62 4.67 4.09 3.60 3.36 3.16 2.94 2.78 2.77 2.71
 Inverter loading ratio 1.10 1.11 1.12 1.13 1.13 1.14 1.15 1.15 1.15 1.15 1.15
Ongoing NREL Benchmarking
 Annual degradation (%) 1.00 0.95 0.90 0.85 0.80 0.75 0.75 0.75 0.70 0.70 0.70
 O&M expenses ($/kW-yr) 56 49 42 36 31 26 25 25 22 27 29
 Preinverter derate (%) 90.0 90.1 90.2 90.3 90.4 90.5 90.5 90.5 90.5 90.5 90.5
 Inverter efficiency (%) 94.0 94.8 95.6 96.4 97.2 98.0 98.0 98.0 98.0 98.0 98.0
 Inflation rate (%) 2.5 2.5 2.5 2.5 2.5 2.5 2.5 2.5 2.5 2.5 2.5
Market Case
 Equity discount rate (real) (%) 9.0 8.6 8.3 7.9 7.6 7.3 6.9 6.9 6.9 6.1 6.1
 Debt interest rate (%) 5.5 5.4 5.3 5.2 5.0 4.9 4.8 4.8 4.8 4.0 4.0
 Debt fraction (%) 34.2 35.2 36.1 37.1 38.1 39.0 40.0 40.0 40.0 53.7 53.7
Steady-State Financing (No ITC)
 Equity discount rate (real) (%) — — — — — — — — — — 6.1
 Debt interest rate (%) — — — — — — — —— — — 5.0
 Debt fraction (%) — — — — — — — — — — 71.8

 All 2010–2018 data are from Fu, Feldman, and Margolis (2018), and they are adjusted for inflation. Residential PV system LCOE
 assumes: (1) system lifetime of 30 years; (2) federal tax rate of 21%; (3) state tax rate of 6%; (4) Modified Accelerated Cost
 Recovery System (MACRS) depreciation schedule; (5) no state or local subsidies; (6) a working capital and debt service reserve
 account for 6 months of operating costs and debt payments (earning an interest rate of 1.75%); (7) three-month construction loan,
 with an interest rate of 4% and a fee of 1% of the cost of the system; (8) module tilt angle of 25 degrees, and an azimuth of 180
 degrees; (9) debt with a term of 18 years; (10) $1.1 million of up-front financial transaction costs for a $100 million TPO transaction
 of a pool of residential projects; (11) 2019 and 2020 financial assumptions from Feldman, Bolinger, and Schwabe (2020).

 NREL | 36
Residential PV: LCOE Benchmark Historical Trends

 From 2010 to 2020, there was a 74% reduction in the residential PV system electricity cost benchmark (a 1% reduction was
 achieved from 2019 to 2020), bringing the unsubsidized LCOE between $0.11/kWh to $0.16/kWh ($0.07/kWh to $0.09/kWh when
 including the federal ITC). This reduction is 93% toward achieving SETO’s 2020 residential LCOE goal, which is 10.6 cents/kWh
 in 2019 USD. We also calculate PV LCOE without the ITC using steady-state financing assumptions. Under these assumptions,
 unsubsidized residential PV LCOE ranges from $0.10/kWh to $0.14/kWh in Q1 2020.
 NREL | 37
Contents

 • Introduction and Key Definitions
 • Overall Model Outputs
 • Market Study and Model Inputs
 • Model Output: Residential PV
 • Model Output: Commercial PV
 • Model Output: Utility-Scale PV
 • Residential PV-Plus-Storage
 • Commercial PV-Plus-Storage
 • Utility-Scale PV-Plus-Storage
 • Conclusions
 NREL | 38
Commercial PV: Model Structure

 NREL | 39
Commercial PV: Modeling Inputs and Assumptions
Category Modeled Value Description Sources
System size 200 kW (rooftop) and 500 kW (ground-mounted); Average installed size per system Barbose and Darghouth 2019
 range (100 kW–2 MW)
Module efficiency 19.5% Average monocrystalline module efficiency CA NEM 2020
Module price $0.41/WDC Ex-factory gate (first buyer) ASP, Tier 1 monocrystalline modules Wood Mackenzie and SEIA 2020
Inverter price Three-phase string inverter: $0.07/WDC Ex-factory gate prices (first buyer) ASP, Tier 1 inverters Wood Mackenzie 2020; Wood
 Mackenzie and SEIA 2020
 DC power optimizer three-phase string inverter:
 $0.12/WDC (rooftop only)
 Microinverter: $0.29/WDC (rooftop only)
Structural components $0.11–$0.17/WDC; assumes national average wind and Ex-factory gate prices; flat-roof ballasted racking system or fixed-tilt MEPS 2019; model assumptions;
(racking) snow loadinga; varies by racking type (ground-mounted ground-mounted racking system NREL 2019
 versus rooftop-ballasted)
Electrical components $0.13–$0.24/WDC Conductors, conduit and fittings, transition boxes, switchgear, panel Model assumptions; NREL 2020;
 boards, and other parts RSMeans 2017
EPC overhead (percentage 13% Costs and fees associated with EPC overhead, inventory, shipping, and NREL 2020
of equipment costs) handling
Sales tax National average: 5% Sales tax on equipment costs RSMeans 2017
Direct installation labor Electrician: $27.47 per hour Modeled labor rate assumes national average nonunionized labor rates BLS 2019; NREL 2020
 Laborer: $18.17 per hour
Burden rates (percentage Total nationwide average: 18% Workers compensation, federal and state unemployment insurance, FICA, RSMeans 2017
of direct labor) builders’ risk, public liability
PII $0.11/WDC For construction permits fee, interconnection study fees for existing NREL 2020
 substation, testing, and commissioning
Developer overhead $0.30–$0.36/W Includes overhead expenses such as payroll, facilities, travel, legal fees, Model assumptions; NREL 2020
 administrative, business development, finance, and other corporate
 Varies by system size (30% developer overhead) functions
Contingency 4% Estimated as markup on EPC cost; value represents actual cost overruns NREL 2020
 above estimated cost
Profit 7% Applies a fixed percentage margin to all costs, including hardware, NREL 2020
 installation labor, EPC overhead, and developer overhead

 a Racking companies currently meet the national standard, so there is not as much differentiation by state in the market within rooftop systems. The ground-mount racking system

 requires more material, equipment, and labor compared than the ballasted racking system. However, installation of ground-mount PV systems at utility scale helps reduce the BOS NREL | 40
 cost of these systems owing to economies of scale.
Commercial PV: Rooftop Model Outputs

 Q1 2020 U.S. benchmark: Commercial rooftop PV system cost (2019 USD/WDC)

 We model different system sizes because of the wide scope of the “commercial” sector, which comprises a diverse customer base
 occupying a variety of building sizes. Also, economies of scale—driven by hardware, labor, and related markups—are evident
 here. That is, as system sizes increase, the per-watt cost to build them decreases. Owing to the adoption of the 2017 and 2020
 NEC in many states, three-phase string inverter, power optimizer, and microinverter options are each modeled individually for the
 commercial rooftop model, and the “mixed” case applies their market shares (45%, 39%, and 16% respectively) as weightings. NREL | 41
Commercial PV: Rooftop Model Outputs

 Q1 2020 benchmark by location: 200-kW commercial rooftop system cost (2019 USD/WDC)

 This figure presents a sensitivity analysis of the benchmark for the mixed case, with cost
 categories that vary by location and hardware specification. Inverter type has the largest impact
 on installed system cost, with use of string inverters resulting in $1.61/WDC and use of
 microinverters resulting in $1.92/WDC.

 NREL | 42
Commercial Rooftop PV: Model Outputs

 Q1 2019 cost for a commercial rooftop multicrystalline PV system and Q1 2019 and Q1 2020 costs
 for a commercial rooftop monocrystalline PV system

 In the Q1 2020 benchmark report, we model systems using monocrystalline PV modules, unlike previous editions of this report
 (Fu et al. 2018), for which we modeled multicrystalline PV modules. In the past few years, the U.S. market has had an increasing
 demand for monocrystalline modules. As shown above, in Q1 2019 there was a $0.06/W system price premium from using
 monocrystalline modules over multicrystalline modules for commercial rooftop PV systems. The system cost reductions achieved
 by increased monocrystalline module efficiency were counterbalanced by the higher module price. Commercial rooftop PV
 systems using monocrystalline modules achieved a $0.04/W (2.4%) reduction in price from Q1 2019 to Q1 2020.

 NREL | 43
Commercial PV: Ground-Mounted Model Outputs

 Q1 2020 U.S. benchmark: Commercial ground-mounted PV system cost (2019 USD/WDC)
We model different system sizes because of the wide scope of the “commercial” sector, which comprises a diverse customer base occupying a variety of
building sizes. Also, economies of scale—driven by hardware, labor, and related markups—are evident here. That is, as system sizes increase, the per-watt cost
to build them decreases. Compared with rooftop systems, ground-mounted applications have higher material, equipment, and labor costs associated with pile-
driven mounting. As PV system size increases, the per-watt cost of pile-driven mounting is significantly reduced through economies of scale. Ground-mounted
commercial PV systems also benefit from lower inverter costs owing to the rapid shutdown requirements for commercial rooftop systems. NREL | 44
Commercial PV: Ground-Mounted Rooftop Model Outputs

 Q1 2020 benchmark by location: 500-kW commercial ground-mounted system cost (2019 USD/WDC)

 This figure presents a sensitivity analysis of the benchmark for the mixed case, with cost categories that vary by location and
 hardware specification. Material location factor has the largest impact on installed system cost, with the lowest cost state
 resulting in $1.67/WDC and the highest cost state resulting in $1.85/WDC.

 NREL | 45
Commercial Rooftop PV: Capital Cost Benchmark Historical Trends

 From 2010 to 2020, there was a 69% reduction in the commercial PV system cost benchmark. Approximately 78% of that reduction can be attributed to total
 hardware costs (module, inverter, and hardware BOS), as module prices dropped 85% over that period. The final 22% is attributable to labor and soft costs,
 including PII, sales tax, overhead, and net profit.
 Looking at this past year, from 2019 to 2020 there was a 2.4% reduction in the commercial PV system cost benchmark that was largely driven by reductions in
 inverter and BOS hardware costs.

* The current version of our cost model makes a few significant changes from the version used in our Q1 2018 benchmark report (Fu, Feldman, and Margolis 2018), and it incorporates costs that had previously
not been benchmarked in as much detail. To better distinguish the historical cost trends from the changes to our cost models, we calculate Q1 2019 and Q1 2020 PV benchmarks using the Q1 2018 version of the
commercial rooftop PV model. The “Additional Costs from Model Updates” category represents the difference between modeled results. Using the previous costs model, the Q1 2019 and Q1 2020 benchmarks
are calculated to be $1.71/WDC and $1.64/WDC respectively. NREL | 46
Commercial PV: LCOE Assumptions
 2010 2011 2012 2013 2014 2015 2016 2017 2018 2019 2020
 Rooftop (200 kW)
 Installed cost ($/W) 5.57 5.18 3.57 2.90 2.89 2.40 2.29 1.94 1.77 1.76 1.72
 Inverter loading ratio 1.10 1.11 1.12 1.13 1.13 1.14 1.15 1.15 1.15 1.15 1.15
 Annual degradation (%) 1.00 0.95 0.90 0.85 0.80 0.75 0.75 0.75 0.70 0.70 0.70
 O&M expenses ($/kW-yr) 35 32 29 26 23 20 19 19 18 19 19
 Preinverter derate (%) 90.5 90.5 90.5 90.5 90.5 90.5 90.5 90.5 90.5 90.5 90.5
 Inverter efficiency (%) 95.0 95.6 96.2 96.8 97.4 98.0 98.0 98.0 98.0 98.0 98.0
 Ground-Mounted (500 kW)
 Installed cost ($/W) — — — — — — — — — — 1.72
 Inverter loading ratio — — — — — — — — — — 1.11
 Annual degradation (%) — — — — — — — — — — 0.70
 O&M expenses ($/kw-yr) — — — — — — — — — — 18.71
 Preinverter derate (%) — — — — — — — — — — 90.5
 Inverter efficiency (%) — — — — — — — — — — 98.0
 Financing Assumptions
 Inflation rate (%) 2.5 2.5 2.5 2.5 2.5 2.5 2.5 2.5 2.5 2.5 2.5
 Market Case
 Equity discount rate (real) (%) 9.0 8.6 8.3 7.9 7.6 7.3 6.9 6.9 6.9 6.1 6.1
 Debt interest rate (%) 5.5 5.4 5.3 5.2 5.0 4.9 4.8 4.8 4.8 4.0 4.0
 Debt fraction (%) 34.2 35.2 36.1 37.1 38.1 39.0 40.0 40.0 40.0 53.8 53.8
 Steady-State financing
 Equity discount rate (real) (%) — — — — — — — — — — 6.1
 Debt interest rate (%) — — — — — — — — — — 5.0
 Debt fraction (%) — — — — — — — — — — 71.8

 All 2010–2018 data are from Fu, Feldman, and Margolis (2018), and they are adjusted for inflation. Commercial PV system LCOE
 assumes: (1) System lifetime of 30 years; (2) Federal tax rate of 21%; (3) Sate tax rate of 6%; (4) MACRS depreciation schedule; (5)
 No state or local subsidies; (6) A working capital and debt service reserve account for 6 months of operating costs and debt payments
 (earning an interest rate of 1.75%); (7) Six-month construction loan, with an interest rate of 4% and a fee of 1% of the cost of the
 system; (8) Module tilt angle of 10 degrees and an azimuth of 180 degrees; (9) Debt with a term of 18 years; (10) $1.1 million of up-
 front financial transaction costs for a $100 million TPO transaction of a pool of commercial projects; (11) 2019 and 2020 financial
 assumptions from Feldman, Bolinger, and Schwabe (2020).
 NREL | 47
Commercial PV: LCOE Benchmark Historical Trends

From 2010 to 2020, there was a 77% reduction in the commercial PV system electricity cost benchmark (a 3% reduction was achieved from 2019 to 2020),
bringing the unsubsidized LCOE between $0.08/kWh to $0.10/kWh ($0.05/kWh to $0.07/kWh when including the federal ITC). This reduction is 97% toward
achieving SETO’s 2020 commercial PV LCOE goal, which is 8.2 cents/kWh in 2019 USD.
Commercial ground-mounted PV systems, which we began benchmarking this year, are calculated to have a 2020 unsubsidized LCOE of $0.07–$0.09/kWh
($0.05–$0.06/kWh when including the federal ITC). We also calculate PV LCOE without the ITC using steady-state financing assumptions. Under these
assumptions, the commercial rooftop PV LCOE ranges from $0.07 kWh to $0.10/kWh, and the commercial ground-mounted PV LCOE ranges from $0.07/kWh NREL | 48
to $0.10/kWh in Q1 2020.
Contents

 • Introduction and Key Definitions
 • Overall Model Outputs
 • Market Study and Model Inputs
 • Model Output: Residential PV
 • Model Output: Commercial PV
 • Model Output: Utility-Scale PV
 • Residential PV-Plus-Storage
 • Commercial PV-Plus-Storage
 • Utility-Scale PV-Plus-Storage
 • Conclusions
 NREL | 49
Utility-Scale PV: Model Structure

 NREL | 50
Utility-Scale PV: Modeling Inputs and Assumptions
Category Modeled Value Description Sources
System size 100 MW; range: 5 MW–100 MW A large utility-scale system capacity Model assumption
Module efficiency 19.5% Average monocrystalline module efficiency CA NEM 2020
Module price $0.41/WDC Ex-factory gate (first buyer) price, Tier 1 monocrystalline modules Wood Mackenzie and SEIA 2020;
 NREL 2020
Inverter price $0.05/WDC (fixed-tilt)$0.05/WDC (one-axis tracker) Ex-factory gate (first buyer) price, Tier 1 inverters Wood Mackenzie and SEIA 2020;
 Bolinger, Seel, and Robson 2019
 DC-to-AC ratio = 1.37 for fixed-tilt and 1.34 for one-axis tracker
Structural components $0.12/WDC for a 100-MW system Fixed-tilt racking or one-axis tracking system MEPS 2019; model assumptions;
(racking) NREL 2020

Electrical components $0.07–$0.13/WDC Varies by system size Model was upgraded to a 1,500-VDC system that includes conductors, conduit Model assumptions; NREL 2020;
 and fittings, transition boxes, switchgear, panel boards, onsite transmission, RSMeans 2017
 and other electrical connections
EPC overhead (percentage of 8.67%–13% for equipment and material (except for Costs associated with EPC SG&A, warehousing, shipping, and logistics NREL 2020
equipment costs) transmission line costs); 23%–69% for labor costs; varies
 by system size and labor activity

Sales tax National average: 5% Sales tax on equipment costs RSMeans 2017
Direct installation labor Electrician: $27.47 per hour Modeled labor rate assumes national average nonunionized labor BLS 2019; NREL 2020
 Laborer: $18.17 per hour
Burden rates (percentage of Total nationwide average: 18% Workers compensation, federal and state unemployment insurance, FICA, RSMeans 2017
direct labor) builders’ risk, public liability
PII $0.03–$0.07/WDC For construction permits fee, interconnection, testing, and commissioning NREL 2020
 Varies by system size
Transmission line $0.00–$0.02/WDC System size < 10 MW uses 0 miles for gen-tie line Model assumptions; NREL 2020
(gen-tie line) Varies by system size System size > 200 MW uses five miles for gen-tie line
 System size = 10–200 MW uses linear interpolation
Developer overhead 2%–12% Includes overhead expenses such as payroll, facilities, travel, legal fees, Model assumptions; NREL 2020
 administrative, business development, finance, and other corporate functions
 Varies by system size (100 MW uses 2%; 5 MW uses 12%)

Contingency 3% Estimated as markup on EPC cost NREL 2020
Profit 5%–8% Applies a percentage margin to all costs including hardware, installation labor, NREL 2020
 EPC overhead, and developer overhead
 Varies by system size (100 MW uses 5%; 5 MW uses 8%)
 NREL | 51
Utility-Scale PV: U.S. Fixed-Tilt vs. Tracking Systems

 Percentage of U.S. utility-scale PV systems using tracking systems, 2010–2019 (EIA 2020)

 This figure shows the percentage of U.S. utility-scale PV systems using tracking systems for 2010–2019. Although the
 data include one-axis and dual-axis tracking systems in the same “tracking” category, there are many more one-axis
 trackers than dual-axis trackers (EIA 2020). Cumulative tracking system installation reached 65% by 2019.

 NREL | 52
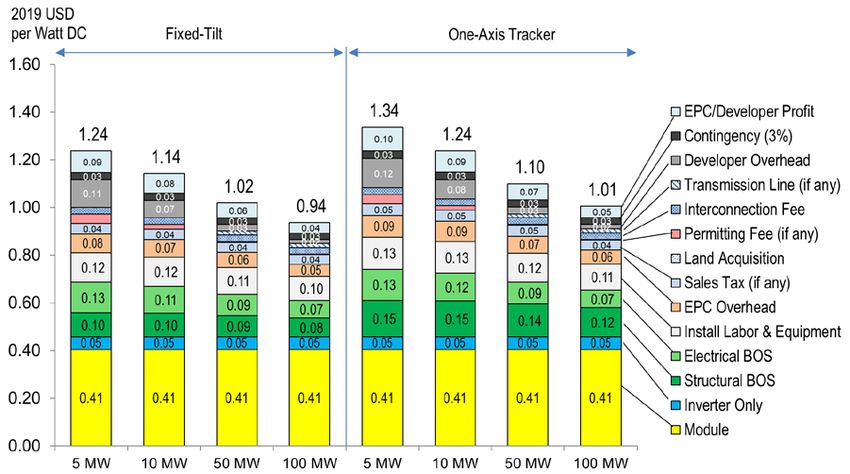
Utility-Scale PV: Model Outputs

 Q1 2020 U.S. benchmark: Utility-scale PV total cost (EPC + developer) 2019 USD/WDC

 (1) Nonunion labor is used.
 (2) Economies of scale—driven by BOS, labor, related markups, and development cost—are demonstrated.

 NREL | 53
Utility-Scale PV: Model Outputs

 Q1 2020 benchmark by location: 100-MW one-axis utility-scale PV system cost (2019 USD/WDC)

 This figure presents a sensitivity analysis of the benchmark for the mixed case, with cost categories that vary by location and
 hardware specification. Equipment location factor has the largest impact on installed system cost, with the lowest cost state
 resulting in $0.96/WDC and the highest cost state resulting in $1.08/WDC.

 NREL | 54
Utility-Scale PV: Model Outputs

 Q1 2019 cost for a utility-scale PV multicrystalline PV system and Q1 2019 and Q1 2020 costs for a utility-scale PV monocrystalline PV system

In the Q1 2020 benchmark report, we model systems using monocrystalline PV modules, unlike previous editions of this report (Fu et al. 2018), for which we
modeled multicrystalline PV modules. In the past few years, the U.S. market has had an increasing demand for monocrystalline modules. As shown above, in
Q1 2019 there was a $0.05/WDC system price premium for using monocrystalline PV modules over multicrystalline PV modules in utility-scale PV systems. The
system cost reductions achieved by increased monocrystalline module efficiency were counterbalanced by the higher module price. The price of utility-scale
PV systems using monocrystalline modules decreased by $0.01/W DC from Q1 2019 to Q1 2020.
 NREL | 55
Utility-Scale PV: Capital Cost Benchmark Historical Trends

 From 2010 to 2020, there was an 80% reduction in the utility-scale (fixed-tilt) PV system cost benchmark, and an 82% reduction in the utility-scale (one-axis)
 PV system cost benchmark. Approximately 70% and 64 of that reduction can be attributed to total hardware costs (for fixed-tilt and one-axis systems
 respectively), as module prices dropped 85% over that period. An additional 11% (fixed-tilt) to 12% (one-axis tracking) reduction can be attributed to labor,
 which dropped over that period. For previous editions of this report, we assumed a land acquisition cost of $0.03/W. Based on Wiser et al. (2020), which stated
 that most utility-scale PV projects do not own the land on which the PV system is placed, we have reclassified land costs from an up-front capital expenditure
 (land acquisition) to an operating expenditure (lease payments) for 2019 and 2020. Therefore, approximately 1% of the reduction in cost is attributed to the
 reclassification of land costs. The final 20% (fixed-tilt) and 25% (one-axis tracker) is attributable to other soft costs, including PII, sales tax, overhead, and net
 profit. From 2019 to 2020, overall, there was a 1% reduction in the cost benchmarks for both utility-scale PV systems (fixed-tilt and one-axis tracking).

* The current version of our cost model makes a few significant changes from the version used in our Q1 2018 benchmark report (Fu, Feldman, and Margolis 2018) and incorporates costs that had previously not
been benchmarked in as much detail. To better distinguish the historical cost trends from the changes to our cost models, we calculate Q1 2019 and Q1 2020 PV benchmarks using the Q1 2018 versions of the
utility-scale PV model. The “Additional Costs from Model Updates” category represents the difference between modeled results. Using the previous costs model, the Q1 2019 and Q1 2020 benchmarks are | 56
 NREL
calculated to be $0.94/WDC and $0.89/WDC (fixed-tilt) as well as $1.01/WDC and $0.96/WDC (one-axis) respectively.
Utility-Scale PV: LCOE Assumptions
 2010 2011 2012 2013 2014 2015 2016 2017 2018 2019 2020
 One-Axis Tracker
 Installed cost ($/W) 5.66 4.79 3.29 2.50 2.25 2.08 1.63 1.16 1.16 1.02 1.01
 Annual degradation (%) 1.00 0.95 0.90 0.85 0.80 0.75 0.75 0.75 0.70 0.70 0.70
 O&M expenses ($/kW-yr) 29 28 26 25 24 22 22 21 15 17 17
 Preinverter derate (%) 90.5 90.5 90.5 90.5 90.5 90.5 90.5 90.5 90.5 90.5 90.5
 Inverter efficiency (%) 96.0 96.4 96.8 97.2 97.6 98.0 98.0 98.0 98.0 98.0 98.0
 Inverter loading ratio 1.10 1.12 1.13 1.15 1.17 1.18 1.20 1.30 1.30 1.34 1.34
 Fixed-Tilt
 Installed cost ($/W) 4.75 4.08 2.77 2.13 1.97 1.93 1.53 1.08 1.08 0.95 0.94
 Annual degradation (%) 1.00 0.95 0.90 0.85 0.80 0.75 0.75 0.75 0.70 0.70 0.70
 O&M expenses ($/kW-yr) 29 27 25 23 21 19 19 18 13 16 16
 Preinverter derate (%) 90.5 90.5 90.5 90.5 90.5 90.5 90.5 90.5 90.5 90.5 90.5
 Inverter efficiency (%) 96.0 96.4 96.8 97.2 97.6 98.0 98.0 98.0 98.0 98.0 98.0
 Inverter loading ratio 1.10 1.15 1.20 1.25 1.30 1.35 1.40 1.30 1.36 1.37 1.37
 Financing Assumptions
 Inflation rate (%) 2.5 2.5 2.5 2.5 2.5 2.5 2.5 2.5 2.5 2.5 2.5
 Market Case
 Equity discount rate (real) (%) 7.4 7.2 7.0 6.9 6.7 6.5 6.3 6.3 6.3 5.1 5.1
 Debt interest rate (%) 5.5 5.3 5.2 5.0 4.8 4.7 4.5 4.5 4.5 4.0 4.0
 Debt fraction (%) 34.2 35.2 36.1 37.1 38.1 39.0 40.0 40.0 40.0 51.9 51.9
 Steady-State Financing
 Equity discount rate (real) (%) — — — — — — — — — — 5.1
 Debt interest rate (%) — — — — — — — — — — 5.0
 Debt fraction (%) — — — — — — — — — — 71.8

 All 2010–2018 data are from Fu, Feldman, and Margolis (2018), and they are adjusted for inflation. Utility-scale PV system
 LCOEs assume: (1) system lifetime of 30 years; (2) federal tax rate of 21%; (3) state tax rate of 6%; (4) MACRS depreciation
 schedule; (5) no state or local subsidies; (6) a working capital and debt service reserve account for 6 months of operating
 costs and debt payments (earning interest of 1.75%); (7) six-month construction loan with an interest rate of 4% and a fee of
 1% of the cost of the system; (8) system size of 100 MW; (9) debt with a term of 18 years; (10) $1.1 million of up-front
 financial transaction costs; (11) 2019 and 2020 financial assumptions from Feldman, Bolinger, and Schwabe (2020).
 NREL | 57
Utility-Scale PV: LCOE Benchmark Historical Trends

 We use the fixed-tilt systems for LCOE benchmarks from 2010 to 2015 and then switch to one-axis tracking systems from 2016 to
 2020 to reflect the market share change in the utility-scale PV sector. All detailed LCOE values can be found in the appendix.

 From 2010 to 2020, utility-scale PV LCOE declined 83% (0% from 2019 to 2020), resulting in an unsubsidized LCOE of $0.04–
 $0.05/kWh ($0.025–$0.035/kWh when including the federal ITC). This reduction signifies the achievement of SETO’s 2020 utility-
 scale PV goal. We also calculate PV LCOE without the ITC using steady-state financing assumptions. Under these assumptions,
 utility-scale (one-axis and fixed-tilt) PV LCOE ranges from $0.04 kWh to $0.05/kWh in Q1 2020. NREL | 58
Contents

 • Introduction and Key Definitions
 • Overall Model Outputs
 • Market Study and Model Inputs
 • Model Output: Residential PV
 • Model Output: Commercial PV
 • Model Output: Utility-Scale PV
 • Residential PV-Plus-Storage
 • Commercial PV-Plus-Storage
 • Utility-Scale PV-Plus-Storage
 • Conclusions
 NREL | 59
Residential PV-Plus-Storage: System Configurations

 NREL | 60
Residential Storage-Only: Modeling Inputs and Assumptions
Category Modeled Value Description
System size 3-kW/6-kWh storage Less-resilient system
 5-kW/20-kWh storage
 More-resilient system
Battery pack cost $253/kWh Battery pack only
Battery-based inverter cost $174/kWh 6-kW, 48-V bidirectional inverter (less resilient)

 8-kW, 48-V bidirectional inverter (more resilient)
Electrical BOS cost $1,830 (DC-coupled) Revenue-grade meter, communications device, AC main panel, DC disconnect,
 $1,520 (AC-coupled) maximum power point tracking, charge controller, subpanel (breaker box) for
 critical load, conduit, wiring, DC cable
 Assumes higher electrical BOS costs for DC-coupled systems that are due to
 the need for a charge controller
Supply-chain costs 5% of cost of equipment Includes costs of inventory, shipping, and handling of equipment
Sales tax 5.1% (national average) Sales tax on the equipment
Installation labor cost Electrician: $27.47 per hour Assumes national average pricing
 Laborer: $18.17 per hour
 AC systems require more hours of work to integrate with an existing
 inverter and monitoring system
Engineering fee $99 Engineering design and professional engineer-stamped calculations and
 drawings
PII $297 permit fee 20–32 hours (DC-coupled/AC-coupled) of commissioning and interconnection
 $594–$951 in labor labor, and permit fee
Sales and marketing (customer $0.61/WDC 20 hours more time for DC system, and 32 hours more for AC system, per
acquisition) closed sale, associated with selling a storage systems versus selling a PV system
Overhead (general and $0.28/WDC Rent, building, equipment, staff expenses not directly tied to PII, customer
administrative) acquisition, or direct installation labor
Profit (%) 17% Fixed percentage margin applied to all direct costs including hardware,
 installation labor, direct sales and marketing, design, installation, and
 permitting fees

 NREL | 61
You can also read