Troubleshooting Spark Applications - PART 2: FIVE TYPES OF SOLUTIONS - Unravel Data
←
→
Page content transcription
If your browser does not render page correctly, please read the page content below

Troubleshooting
Spark Applications
PART 2: FIVE TYPES OF SOLUTIONS

Note: This guide applies to running Spark jobs on any
                                                                     What’s the Problem(s)?
platform, including Cloudera platforms; cloud vendor-specific
platforms – Amazon EMR, Microsoft HDInsight, Microsoft               The problems we mentioned in Part 1 of this series have many
Synapse, Google DataProc; Databricks, which is on all                potential solutions. The methods people usually use to try to
three major public cloud providers; and Apache Spark on              solve them often derive from that person’s role on the data
Kubernetes, which runs on nearly all platforms, including            team. The person who gets called when a Spark job crashes,
on-premises and cloud.                                               such as the job’s developer, is likely to look at the Spark job.
                                                                     The person who is responsible for making sure the cluster is

Introduction                                                         healthy will look at that level. And so on.

                                                                     The following chart, from Part 1, shows the most common
Spark is known for being extremely difficult to debug. But this
                                                                     job-level and cluster-level challenges that data teams face in
is not all Spark’s fault. Problems in running a Spark job can be
                                                                     successfully running Spark jobs.
the result of problems with the infrastructure Spark is running
on, inappropriate configuration of Spark, Spark issues, the
                                                                      Job-Level Challenges              Cluster-Level Challenges
currently running Spark job, other Spark jobs running at the
                                                                      1. Executor and core allocation   6. Resource allocation
same time - or interactions among these layers. But Spark jobs
are very important to the success of the business; when a job         2. Memory allocation              7. Observability
crashes, or runs slowly, or contributes to a big increase in the      3. Data skew/small files          8. Data partitioning vs. SQL
                                                                                                           queries/inefficiency
bill from your cloud provider, you have no choice but to fix          4. Pipeline optimization
the problem.                                                                                            9. Use of auto-scaling
                                                                      5. Finding out whether a job
                                                                         is optimized                   10. Troubleshooting
Widely used tools generally focus on part of the environment
                                                                       Impacts: Resources for a given job (at the cluster level) or
– the Spark job, infrastructure, the network layer, etc. These
                                                                       across clusters tend to be significantly under-allocated (causes
tools don’t present a holistic view. But that’s just what you
                                                                       crashes, hurting business results) or over-allocated (wastes
need to truly solve problems. (You also need the holistic view
                                                                       resources and can cause other jobs to crash, both of which
when you’re creating the Spark job, and as a check before you          hurt business results).
start running it, to help you avoid having problems in the first
place. But that’s another story.)
                                                                     In this guide, we highlight five types of solutions that
                                                                     people use – often in various combination – to solve problems
In this guide, Part 2 in a series, we’ll show ten major tools that
                                                                     with Spark jobs
people use for Spark troubleshooting. We’ll show what they do
well, and where they fall short. In Part 3, the final piece, we’ll   1. Spark UI
introduce Unravel Data, which makes solving many of these
                                                                     2. Spark logs
problems easier.
                                                                     3. Platform-level tools such as Cloudera Manager, the
                                                                        Amazon EMR UI, Cloudwatch, the Databricks UI,
                                                                        and Ganglia

                                                                     4. APM tools such as Cisco AppDynamics, Datadog,
                                                                        and Dynatrace

                                                                     5. DataOps platforms such as Unravel Data

                                                                     As an example of solving problems of this type, let’s look at the
                                                                     problem of an application that’s running too slowly – a very
                                                                     common Spark problem, that may be caused by one or more
                                                                     of the issues listed in the chart. Here. we’ll look at how existing
                                                                     tools might be used to try to solve it.

                                                                     Note: Many of the observations and images in this guide
                                                                     originated in the July 2021 presentation, Beyond Observability:
Life as a Spark developer
                                                                     Accelerate Performance on Databricks, by Patrick Mawyer,
                                                                     Systems Engineer at Unravel Data. We recommend this
                                                                     webinar to anyone interested in Spark troubleshooting and
                                                                     Spark performance management, whether on Databricks or on
                                                                     other platforms.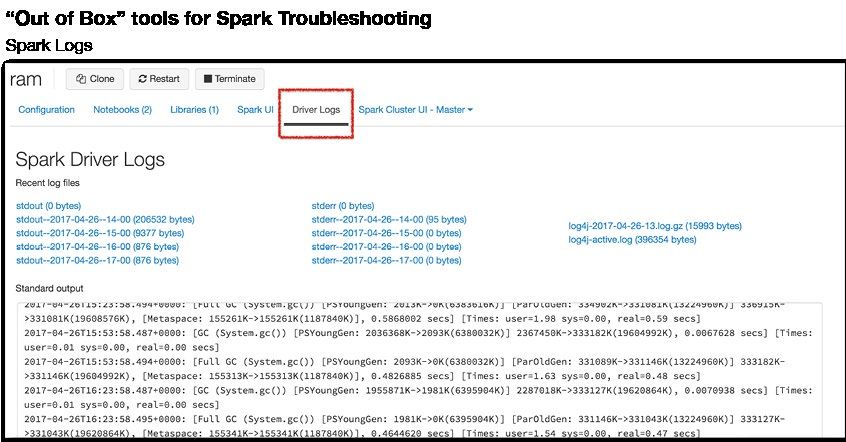
Solving Problems Using Spark UI                                         • Increase the parallelism of the job. For a Spark
                                                                          Cassandra Connector job, for example, you can change spark.
Spark UI is the first tool most data team members use when                cassandra.input.split.size to a smaller value. (It’s a different
there’s a problem with a Spark job. It shows a snapshot of                variable for other RDD types.) Increasing parallelism
currently running jobs, the stages jobs are in, storage usage,            decreases the data set size for each worker, requiring
and more. It does a good job, but is seen as having some faults.          less memory per worker. But more workers means more
It can be hard to use, with a low signal-to-noise ratio and a             resources used; in a fixed resources environment, this takes
long learning curve. It doesn’t tell you things like which jobs           resources away from other jobs; in a dynamic environment,
are taking up more or less of a cluster’s resources, nor deliver          such as Databricks job clusters, it directly runs up your bill.
critical observations such as CPU, memory, and I/O usage.
                                                                        The point here is that everything you might do has a certain
In the case of a slow Spark application, Spark UI will show you         amount of guesswork to it, because you don’t have complete
what the current status of that job is. You can also use Spark          information. And, whichever approach you choose, you are
UI for past jobs, if the logs for those jobs still exist, and if they   putting the job in line for other, different problems, including
were configured to log events properly. Also, the Spark history         later failure, failure for other reasons, or increased cost.
server tends to crash. When this is all working, it can help you        Alternatively, your job may be fine, but at the expense of
find out how long an application took to run in the past – you          other jobs that then fail, and those failures will also be hard to
need to do this kind of investigative work just to determine            troubleshoot.
what “slow” is.

The following screenshot is for a Spark 1.4.1 job with a two-
node cluster. It shows a Spark Streaming job that steadily uses
more memory over time, which might cause the job to slow
down. And the job eventually – over a matter of days – runs
out of memory.

                                                                        Spark UI, showing metrics for completed tasks.
                                                                        (Source: Unravel Data)

A Spark streaming job that uses progressively more
                                                                        Here’s a look at the Stages section of Spark UI. It gives you a
memory over time. (Source: Stack Overflow)
                                                                        list of metrics across executors. However, there’s no overview
                                                                        or big picture view to help guide you in finding problems. And
To solve this problem, you might do several things. Here’s a
                                                                        the tool doesn’t make recommendations to help you solve
brief list of possible solutions, and the problems they might
                                                                        problems, or avoid them in the first place.
cause elsewhere:
                                                                        Spark UI is limited to Spark – and Spark job for example may
• Increase available memory for each worker. You can
                                                                        have data coming in from Kafka, and run alongside other tools.
  increase the value of the spark.executor.memory variable
                                                                        Each of those has its own monitoring and management tools,
  to increase the memory for each worker. This will not
                                                                        or does without; Spark UI doesn’t work with them. It also lacks
  necessarily speed the job up, but will defer the eventual
                                                                        pro-active alerting, automatic actions, and AI-driven insights,
  crash. However, you are either taking memory away
                                                                        all found in Unravel.
  from other jobs in your cluster or, if you’re in the cloud,
  potentially running up the cost of the job.                           Spark UI is very useful for what it does, but its limitations -
• Increase the storage fraction. You can change the value               and the limitations of the other tool types described here - lead
  of spark.storage.memoryFraction, which varies from 0 to 1,            many organizations to build homegrown tools or toolsets, often
  to a higher fraction. Since the Java virtual machine (JVM)            built on Grafana. These solutions are resource-intensive, hard
  uses memory for caching RDDs and for shuffle memory,                  to extend, hard to support, and hard to keep up-to-date.
  you are increasing caching memory at the expense of shuffle
  memory. This will cause a different failure if, at some point,        A few individuals and organizations even offer their
  the job needs shuffle memory that you allocated away at               homegrown tools as open source software for other
  this step.                                                            organizations to use, but of course support, documentation,
                                                                        and updates are limited. Several such tools, such as Sparklint
                                                                        and DrElephant, do not support recent versions of Spark. At
                                                                        this writing, they have not had many, if any, fresh commits in
                                                                        recent months or even years.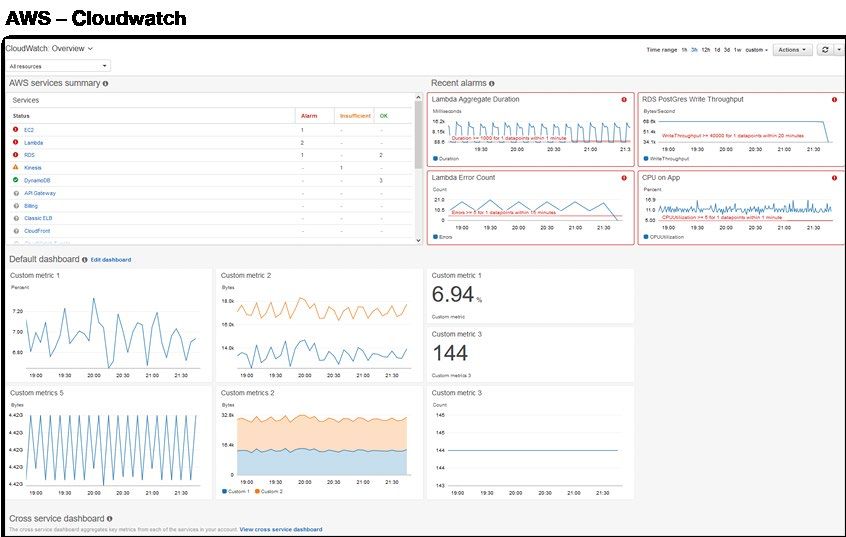
Spark Logs                                                          • Missing files. Governance rules and data storage
                                                                      considerations take files away, as files are moved to
Spark logs are the underlying resource for troubleshooting            archival media or simply lost to deletion. More than one
Spark jobs. Spark UI can even use Spark logs, if available, to        large organization deletes files every 90 days, which makes
rebuild a view of the Spark environment on an historical basis.       quarterly summaries very difficult, and comparisons to, say,
You can use the logs related to the job’s driver and executors to     the previous year’s holiday season or tax season impossible.
retrospectively find out what happened to a given job, and even     • Only Spark-specific information. Spark logs are just that
some information about what was going on with other jobs at           - logs from Spark. They don’t include much information about
the time.                                                             the infrastructure available, resource allocation, configuration
                                                                      specifics, etc. Yet this information is vital to solving a great
If you have a slow app, for instance, you can painstakingly
                                                                      many of the problems that hamper Spark jobs.
assemble a picture to tell you if the slowness was in one task
versus the other by scanning through multiple log files. But        Because Spark logs don’t cover infrastructure and related
answering why and finding the root cause is hard. These logs        information, it’s up to the operations person to find as much
don’t have complete information about resource usage, data          information they can on those other important areas, then try
partitioning, correct configuration setting and many other          to integrate it all and determine the source of the problem.
factors than can affect the performance. ere are also many          (Which may be the result of a complex interaction among
potential issues that don’t show up in Spark logs, such as          different factors, with multiple changes needed to fix it.)
“noisy neighbor” or networking issues that reduce resource
availability within your Spark environment.                         Platform-Level Solutions
                                                                    There are platform-level solutions that work on a given Spark
                                                                    platform, such as Cloudera Manager, the Amazon EMR UI, and
                                                                    Databricks UI. In general, these interfaces allow you to work
                                                                    at the cluster level. They tell you information about resource
                                                                    usage and the status of various services.

                                                                    If you have a slow app, for example, these tools will give you
                                                                    part of the picture you need to put together to determine
                                                                    the actual problem, or problems. But these tools do not
                                                                    have the detail-level information in the tools above, nor do
Source: Unravel Data                                                they even have all the environmental information you need.
                                                                    So again, it’s up to you to decide how much time to spend
Spark logs are a tremendous resource, and are always a go-to        researching, to pull all the information together, and to try
for solving problems with Spark jobs. However, if you depend        to determine a solution. A quick fix might take a few hours; a
on logs as a major component of your troubleshooting toolkit,       comprehensive, long-term solution may take days of research
several problems come up, including:                                and experimentation.

• Access and governance difficulties. In highly secure              This screenshot shows Databricks UI. It gives you a solid
  environments, it can take time to get permission to access        overview of jobs and shows you status, cluster type, and so on.
  logs, or you may need to ask someone with the proper              Like other platform-level solutions, it doesn’t help you much
  permissions to access the file for you. In some highly            with historical runs, nor in working at the pipeline level, across
  regulated companies, such as financial institutions, it can       the multiple jobs that make up the pipeline.
  take hours per log to get access.

• Multiple files. You may need to look at the logs for a
  driver and several executors, for instance, to solve job-level
  problems. And your brain is the comparison and integration
  engine that pulls the information together, makes sense of it,
  and develops insights into possible causes and solutions.

• Voluminous files. The file for one component of a job
  can be very large, and all the files for all the components of
  a job can be huge - especially for long-running jobs. Again,
  you are the one who has to find and retain each part of
                                                                    Source: Unravel Data
  the information needed, develop a complete picture of the
  problem, and try different solutions until one works.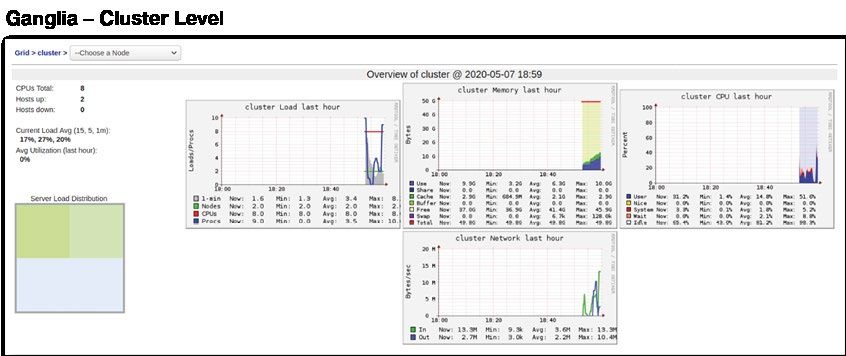
Another monitoring tool for Spark, which is included as               Platform-level solutions can be useful for solving the root
open source within Databricks, is called Ganglia. It’s largely        causes of problems such as out-of-memory errors. However,
complementary to Databricks UI, though it also works at the           they don’t go down to the job level, leaving that to resources
cluster and, in particular, at the node level. You can see host-      such as Spark logs and tools such as Spark UI. Therefore, to
level metrics such as CPU consumption, memory consumption,            solve a problem, you are often using platform-level solutions
disk usage, network-level IO – all host-level factors that can        in combination with job-level tools – and again, it’s your brain
affect the stability and performance of your job.                     that has to do the comparisons and data integration needed to
                                                                      get a complete picture and solve the problem.
This can allow you to see if your nodes are configured
appropriately, to institute manual scaling or auto-scaling, or to     Like job-level tools, these solutions are not comprehensive,
change instance types. (Though someone trying to fix a specific       nor integrated. They offer snapshots, but not history, and
job is not inclined to take on issues that affect other jobs, other   they don’t make proactive recommendations. And, to solve
users, resource availability, and cost.) Ganglia does not have        a problem on Databricks, for example, you may be using
job-specific insights, nor work with pipelines. And there are no      Spark logs, Spark UI, Databricks UI, and Ganglia, along with
good output options; you might be reduced to taking a screen          Cloudwatch on AWS, or Azure Log Monitoring and Analytics.
snapshot to get a JPEG or PNG image of the current status.            None of these tools integrate with the others.

                                                                      APM Tools
                                                                      There is a wide range of monitoring tools, generally known
                                                                      as Application Performance Management (APM) tools. Many
                                                                      organizations have adopted one or more tools from this
                                                                      category, though they can be expensive, and provide very
                                                                      limited metrics on Spark and other modern data technologies.
                                                                      Leading tools in this category include Datadog, Dynatrace, and
                                                                      Cisco AppDynamics.
Source: Unravel Data

Support from the open-source community is starting to shift
toward more modern observability platforms like Prometheus,
which works well with Kubernetes. And cloud providers
offer their own solutions – AWS Cloudwatch, for example,
and Azure Log Monitoring and Analytics. These tools are all
oriented toward web applications, not the backend apps used
for analytics, AI, machine learning, and other use cases that         Source: Unravel Data
are usually considered part of the big data world. They lack big
data application and pipeline information which is essential to       For a slow app, for instance, an APM tool might tell you if the
understand what’s happening to your job and how your job is           system as a whole is busy, slowing your app, or if there were
affecting things on the cluster or workspace.                         networking issues, slowing down all the jobs. While helpful,
                                                                      they’re oriented toward monitoring and observability for Web
                                                                      applications and middleware, not data-intensive operations
                                                                      such as Spark jobs. They tend to lack information about
                                                                      pipelines, specific jobs, data usage, configuration setting,
                                                                      and much more, as they are not designed to deal with the
                                                                      complexity of modern data applications.

Source: Unravel Data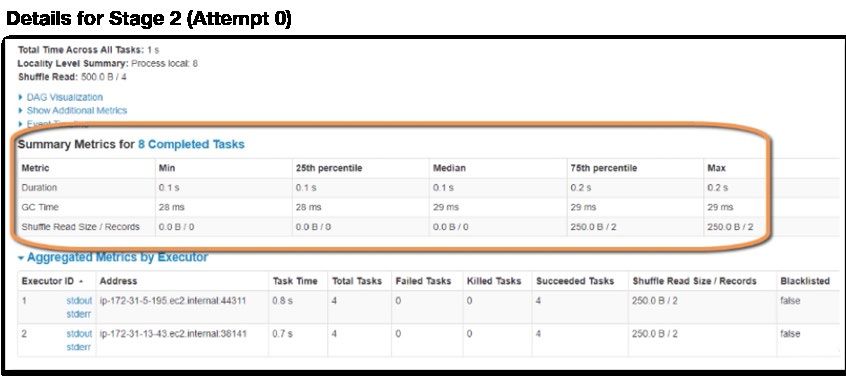
DataOps Platforms                                                   The situation is much worse in the kind of hybrid data
                                                                    clouds that organizations use today. To troubleshoot on each
To sum up, there are several types of existing tools:               platform, you need expertise in the toolset for that platform,
                                                                    and all the others. (Since jobs often have cross-platform
• DIY with Spark logs. Spark keeps a variety of logs, and           interdependencies, and the same team has to support multiple
  you can parse them, in a do it yourself (DIY) fashion, to         platforms.) In addition, when you find a solution for a problem
  help solve problems. But this lacks critical infrastructure,      on one platform, you should apply what you’ve learned on all
  container, and other metrics.                                     platforms, taking into account their differences. In addition,
• Open source tools. Spark UI comes with Spark itself,              you have issues that are inherently multi-platform, such as
  and there are other Spark tools from the open source              moving jobs from one platform to a platform that is better,
  community. But these lack infrastructure, configuration and       faster, or cheaper for a given job. Taking on all this with the
  other information. They also do not help connect together a       current, fragmented, and incomplete toolsets available is a
  full pipeline view, as you need if you are using technologies     mind-numbing prospect.
  such as Kafka to bring data in.
                                                                    The biggest need is for a platform that integrates the
• Platform-specific tools. The platforms that Spark                 capabilities from several existing tools, performing a five-step
  runs on - notably Cloudera platforms, Amazon EMR, and             process:
  Databricks - each have platform-specific tools that help
  with Spark troubleshooting. But these lack application-level      1. Ingest all of the data used by the tools above, plus
  information and are best used for troubleshooting platform           additional, application-specific and pipeline data.
  services.
                                                                    2. Integrate all of this data into an internal model of the
• Application performance monitoring (APM) tools.                      current environment, including pipelines.
  APM tools monitor the interactions of applications with
                                                                    3. Provide live access to the model.
  their environment, and can help with troubleshooting and
  even with preventing problems. But the applications these         4. Continually store model data in an internally maintained
  APM tools are built for are technologies such as .NET, Java,         history.
  and Ruby, not technologies that work with data-intensive          5. Correlate information across the ingested data sets, the
  applications such as Spark.                                          current, “live” model, and the stored historical background,
• DataOps platforms. DataOps – applying Agile principles               to derive insights and make recommendations to the user.
  to both writing and running Spark, and other big data jobs        This tool must also provide the user with the ability to put
  – is catching on, and new platforms are emerging to embody        “triggers” onto current processes that can trigger either alerts
  these principles.                                                 or automatic actions. In essence, the tool’s inbuilt intelligence
                                                                    and the user are then working together to make the right
Each tool in this plethora of tools takes in and processes
                                                                    things happen at the right time.
different, but overlapping, data sets. No one tool provides full
visibility, and even if you use one or more tools of each type,     A simple example of how such a platform can help is by
full visibility is still lacking.                                   keeping information per pipeline, not just per job - then
                                                                    spotting, and automatically letting you know, when the
You need expertise in each tool to get the most out of that tool.
                                                                    pipeline suddenly starts running slower than it had previously.
But the most important work takes place in the expert user’s
                                                                    The platform will also make recommendations as to how you
head: spotting a clue in one tool, which sends you looking at
                                                                    can solve the problem. All this lets you take any needed action
specific log entries and firing up other tools, to come up with
                                                                    before the job is delayed
a hypothesis as to the problem. You then have to try out the
potential solution, often through several iterations of trial
and error, before arriving at a “good enough” answer to the
problem.

Or, you might pursue two tried and trusted, but ineffective,
“solutions”: ratcheting up resources and retrying the job until
it works, either due to the increased resources or by luck; or
simply giving up, which our customers tell us they often had to
do before they started using Unravel Data.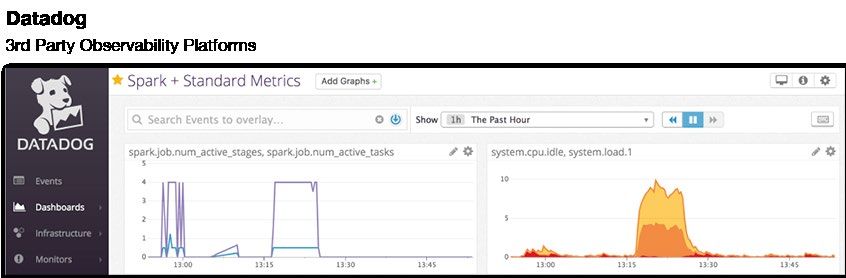
Conclusion
In this Part 2 guide, we’ve taken a whirlwind tour of tools
used to troubleshoot Spark applications. Most tools provide
one or more pieces of the puzzle, but none of them – nor any
combination of them – is a holistic solution.

As mentioned in Part 1 of this guide, Unravel customers can
easily spot and fix over-allocation and inefficiencies, using
job-level insights. Developers can check a job for stability and
efficiency even before putting it into production.

Unravel Data, the solution our company offers, is the
leading platform for DataOps. In Troubleshooting Spark
Applications, Part 3: Solutions, we will describe in detail
how Unravel Data compares to the tools described here. We
will show how it helps you prevent and repair issues at the job,
pipeline, and cluster levels, while also helping with additional
challenges such as cost optimization, SLA adherence, and
cloud migration.

You may be fine with the tools you already have, along with any
custom work you have done in-house. But if you think there’s
room for improvement in how you troubleshoot Spark jobs,
and manage Spark and related technologies, you may want to
check out Part 3.

We hope you have enjoyed, and learned from, reading this
guide. If you would like to know more about Unravel Data now,
you can download a free trial or contact Unravel.

                    unraveldata.com | hello@unraveldata.com        © Unravel. All rights reserved. Unravel and the Unravel logo are registered trademarks
                                                                   of Unravel. All other trademarks are the property of their respective owners.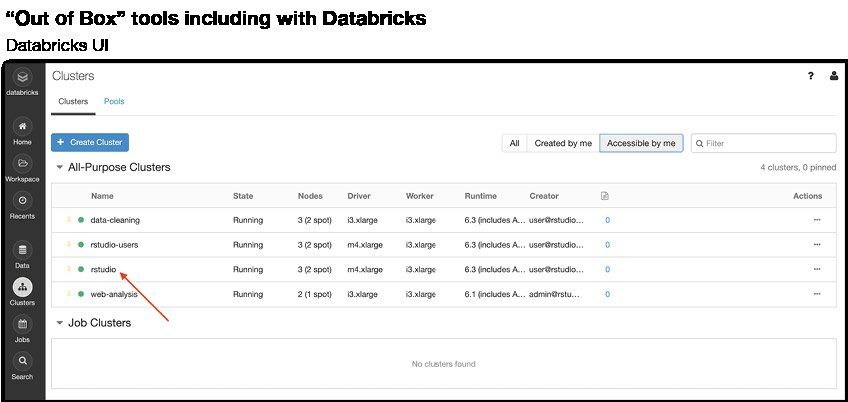
You can also read