Travel Plan Preston Campus 2019 - 2024 'Supporting Sustainable & Active Travel' - UCLan
←
→
Page content transcription
If your browser does not render page correctly, please read the page content below
Travel Plan
Preston Campus
2019 – 2024
‘Supporting Sustainable
& Active Travel’
Contents
		                                            Page

1.    Introduction and Purpose                3

2.    Objectives and Benefits                 3

3.    Travel Plan progress to date            4

4.    Development of the Travel Plan          5

5.    Scope of the Travel Plan                6

6.    Implementation and Management           6

7.    Supporting Strategies                   7

8.    Commuter Travel                         8&9

9.    Campus Map                              10

10. Car Parking Space and Demand Management   10 & 11

11. Travel Survey Results                     12 & 13

12. Modal Split Targets 2019-2024             14

13. Monitoring and Review                     15

14. Business Travel                           16

15. Fleet Management                          17

16. Visitor Travel                            16
                                                        OHS 702841   EMS 707432

2 Travel Plan 2019 – 2024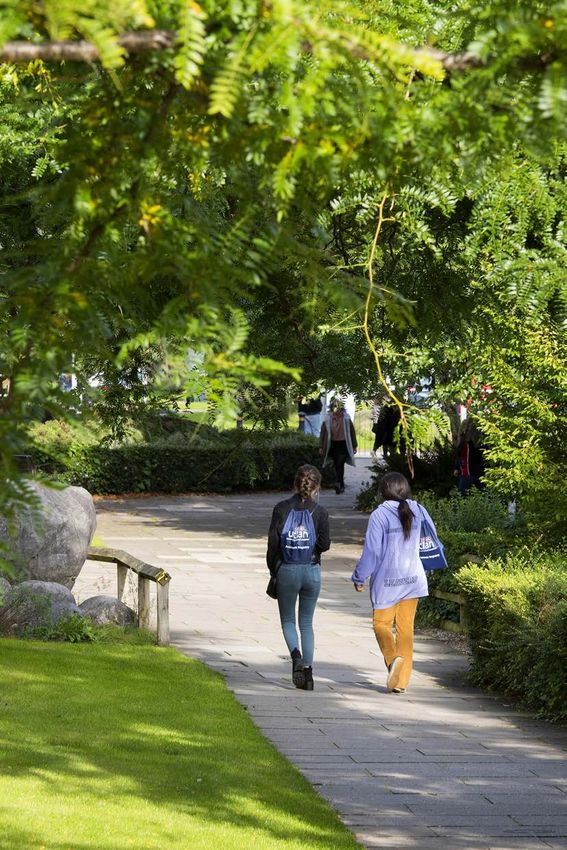
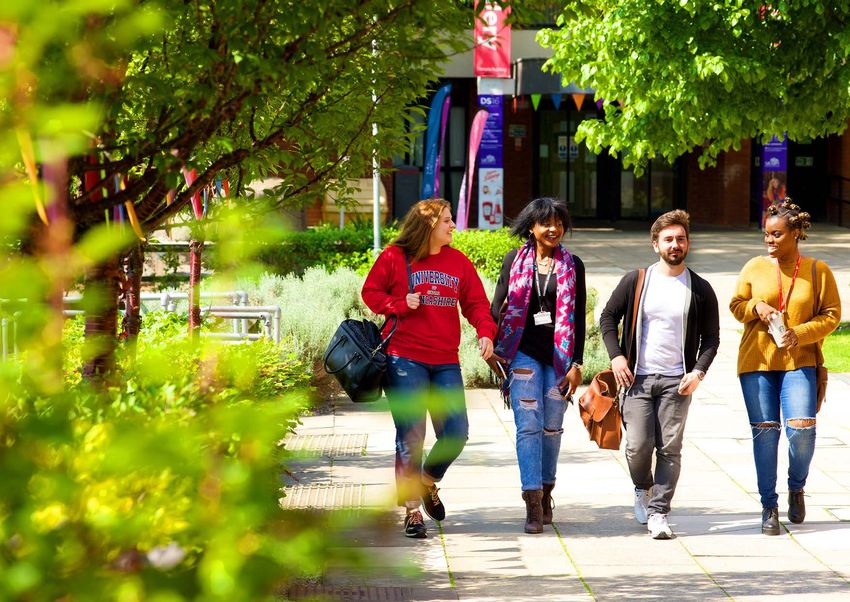
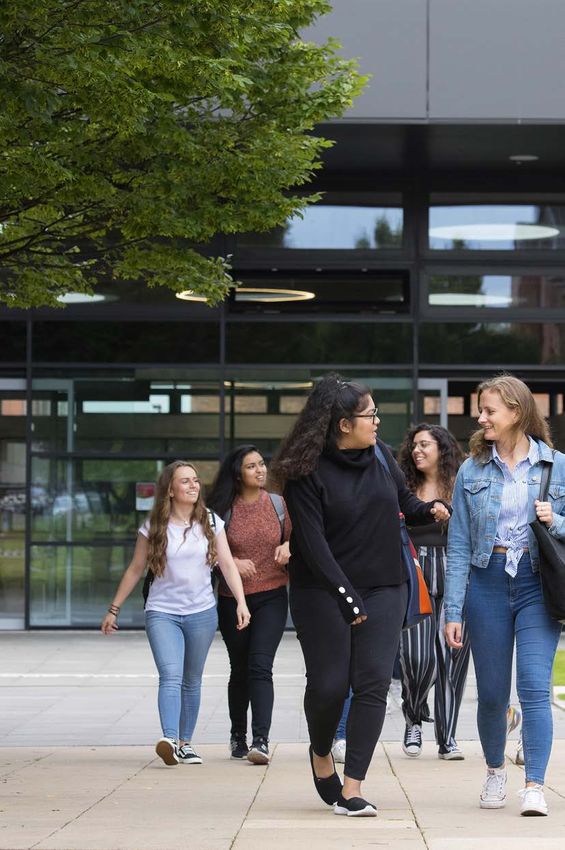
1. Introduction and Purpose
The University of Central Lancashire, Preston Campus lies immediately to the north of the centre of
Preston and covers an area of approximately 18 hectares with 70 buildings. With a student and staff
community approaching 38,000, UCLan is the fifth largest employee in the North West of England.
This inevitably has an impact on the local environment and contributes significantly to our carbon
footprint. The Travel Plan aims to manage and mitigate our environmental impact whilst improving
conditions for staff, students and visitors as well as our local community.
We have dedicated resources for the delivery of the Travel Plan in recognition of our responsibility to address our
travel needs within the City of Preston and local region. The University employs a Sustainable Travel Coordinator to
implement and develop the Travel Plan which encompasses the whole of Preston City Campus.

2. Objectives and Benefits
The University continues to stand by the objectives of the 2013 - 2018 Travel Plan to:
• To reduce the number of single occupancy cars arriving at the University
• To reduce the environmental impact of the University’s travel demands
• To reduce the need to travel, manage car use and promote more sustainable modes of transport
• To improve the choice of transport options available
• Promote healthier and more active lifestyles for staff and students

The anticipated benefits of the Travel Plan are numerous and include:
• By promoting and improving sustainable methods of transport such as public transport, walking, cycling
  and car sharing, we can reduce its carbon footprint.
• Through a reduction in the amount of carbon produced, which contributes to climate change, we are
  benefitting the global environment.
• The local environment also benefits from improved air quality through reduced pollution levels and noise
  reduction.
• Reduced congestion around campus and ease of access and car parking means that commuters, visitors,
  deliveries and local residents can all benefit from shifts in travel modes.
• By changing from an often stressful and expensive solo car journey to more sustainable modes,
  commuters can take advantage of individual costs savings and health benefits

3 Travel Plan 2019 – 2024
3. Travel Plan progress to date                                                                               Key Outcomes

Achievements                                                                                                  • Significant decrease in staff car
                                                                                                                commuting journeys (car solo
• Over 350 bikes purchased by staff through the Tax-Free Bikes for Work Scheme
• Over 650 cycle parking spaces recorded on Preston Campus; including 4 cycle compounds and 70 individual
                                                                                                                and car share combined)
  bike lockers
                                                                                                              • Increase in cycling rates due to
• 5% increase in staff and student cycling rates
• In-house cycle training delivered by National Standard Cycle trained instructors
                                                                                                                improved cycling infrastructure,
• Secured funding for monthly free bike maintenance sessions, overseeing the servicing and repairs of           facilities and security on campus
  around 20-35 bikes per session
• Cycle mileage offered to staff through expenses
                                                                                                              • Increase in public transport rates
• Secure Bike Marking offered in conjunction with UCLan Security and Lancashire Constabulary                  • Greater awareness of the
• A successful Bike lock scheme implemented where, staff and students can purchase a ‘gold sold secure’
  bike lock at cost price
                                                                                                                sustainable travel initiatives
• Launch of two UCLan Bus Services from Blackburn and Blackpool to Preston                                      available to staff and students
• Annual rail season ticket loan scheme for staff
• Incentivised car sharing through the Liftshare platform by providing a 50% reduction in the cost of car
  parking permits for car sharers and dedicating car share bays on the university’s main car parks
• Installation of two additional motorcycle parking shelters and equipment lockers made available for the
  storage of motorcycle gear
• Expansion of the UCLan Car Share Database through the Liftshare platform with the addition of myPTP
  Personal planning tool
• Scope 3 travel data collected on an annual/biennial basis
• Introduction of an online car hire booking tool for business travel
• Data collection of international flight mileage and domestic business travel mileage including carbon
  emissions
• Video-conferencing software, facilities and support made available throughout the University
• Vehicle Replacement Strategy that considers electric and low emitting vehicles for fleet replacements
• Increase of electric vehicles in the University fleet
• Investment in electric vehicle infrastructure on campus, by increasing the number of charge points to six

4 Travel Plan 2019 – 2024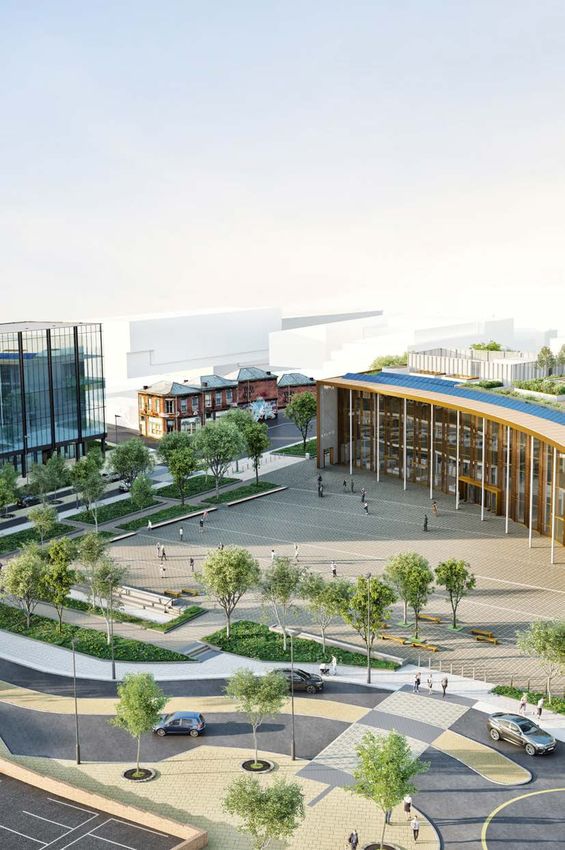
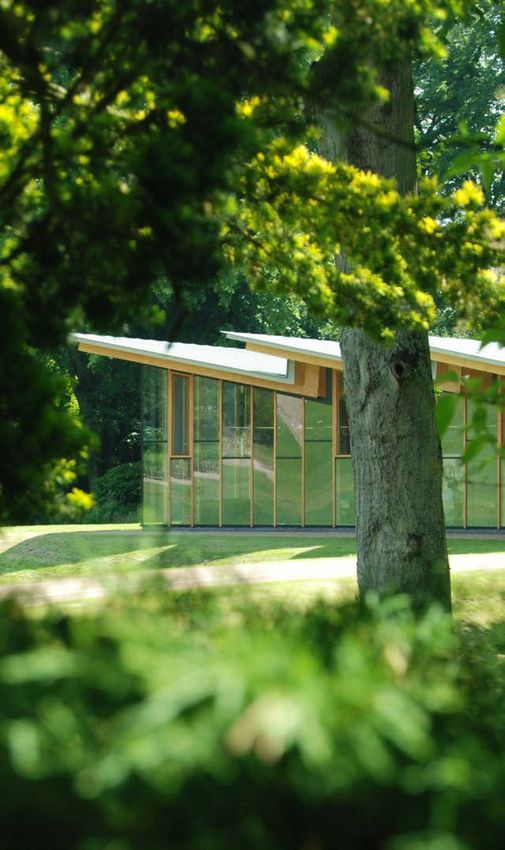
4. Development of the Travel Plan
We have had a Travel Plan in place since the year 2000. Over the course of the Plan the scope
was widened beyond the focus of commuter travel to include elements of business travel and
fleet vehicles as well as visitor travel. The Plan also recognises the move towards the collection of
commuter emissions from both business and commuter travel in line with sector-based requirements
advised by HEFCE.

Campus Masterplan
Preston Campus is currently undergoing a Masterplan transformation, involving major investment totalling
over £200 million. The Travel Plan has assisted with obtaining planning permission for a number of
University buildings, including: The Media Factory, Sports Centre, JB Firth, Oasis Multi-faith Centre, and the
newly opened £35 million Engineering Innovation Centre (EIC). Finally, at the heart of the campus work has
now started on a new Student Centre, linked with a public square it will draw together the University with the
City like never before and will be the next major milestone in the completion of the Campus Masterplan.
The long-term vision of UCLan’s Campus Masterplan is to spark a major focus on regeneration and business
investment in the University quarter, reinforce our ties to the local community and create wider benefits for
Preston and beyond.
A commitment to environmental sustainability remains at the heart of our campus development strategy.
All new building and construction work at UCLan reaches the standards set by BREEAM ‘Education
Excellent’ and opportunities for encouraging sustainable travel, are factored into building design.

5 Travel Plan 2019 – 2024
5. Scope of the Travel Plan
The Travel Plan covers our Preston City Campus, including UCLan Sports Arena, Westleigh and
University owned residences. Areas of the University where travel has a direct impact are:
Staff and student commuting
The modes of transport used by staff and students to access the University.
Business Travel
Travel undertaken for University business; local, national or international.
University Fleet
We have our own fleet of vehicles to undertake educational, research or operational activities; these include
carrying out deliveries, security patrols, visiting residences and grounds work across the campus.
Visitor Travel
Visitors to the University include contractors, deliveries, conference delegates and prospective students
and families.

6. Implementation and Management
The Travel Plan is implemented and monitored by the Sustainable Travel Coordinator, through a Sustainable
Travel Action Plan. To maximise its effectiveness, the Travel Plan forms part of a coordinated approach to
pursuing Sustainable Development at UCLan allowing cooperation from across the University’s Services
and Schools.

Sustainable Travel Action Plan
The Sustainable Travel Action Plan comprises of a range of initiatives and supporting strategies along
with a timescale to ensure delivery within each academic year of the Travel Plan. This is developed with
objectives set from outcomes of the annual travel surveys, as well as actions arising from building projects
or involvement with other health and sustainable initiatives across the University. It is not always possible to
complete actions within the academic year, if this is the case then actions can be carried over into the next
academic year or revised as part of the annual review process.
Download the annual revisions below:

  2020/2021           2019/2020            2018/2019

6 Travel Plan 2019 – 2024
7. Supporting Strategies
ISO14001
We have an Integrated Safety, Health and Environmental Management System (IMS). The overarching Safety,            OHS 702841

Health and Environmental Policy has been endorsed by the Vice-Chancellor committing the University
community to do ‘what is reasonable to avoid or minimise any adverse environmental impacts...and
promote and adopt environmental and sustainability initiatives’.
The Travel Plan sits within the IMS structure and as such is externally audited by our appointed accreditation
body BSI. We have operated an ISO14001 certified Environmental Management System since 2010 and in
October 2016 we were recognised as an early adopter of the revised ISO14001:2015. The IMS has been                 EMS 707432
pivotal to UCLan’ s success in achieving our sustainability targets and having ISO14001 demonstrates that
the system is effective and that we are committed to environmental sustainability.
Operational procedures have been written for Travel/Transport detailing how the University manages and
mitigates the impacts of travel across all areas of the University. A Health and Sustainable University Working
Group provides the forum for consulting and discussing implementation of the Travel Plan.

Carbon Management Plan
The Higher Education Funding Council (HEFCE) has set sector-wide carbon reduction targets by 34% by
202 and 80% by 2050 (Climate Change Act, 2008). The HEFCE strategy requires individual institutions to set
their own targets for Scope 1 and Scope 2 against a 2005/6 baseline, which equates to a 48% reduction by
2020. These requirements are contained within the University’s Carbon Management Plan by 2015-2020.
We have seen significant change since this target was originally set and although the size of the University is
set to increase it will also become more energy efficient. In terms of travel, Scope 1 relates to emissions from
our fleet vehicles. Scope 3 emissions, which include emissions from business and commuting travel are not
included within the Carbon Management Plan.

Preston Local Plan
We work closely with Lancashire County Council and Preston City Council and ensure that the Travel Plan
aligns with the Preston Local Plan 2012-2026.

7 Travel Plan 2019 – 2024
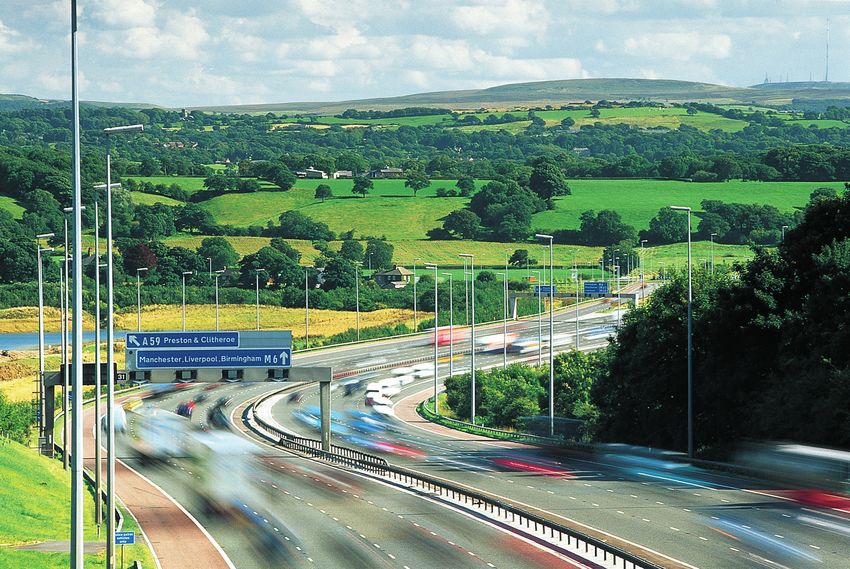
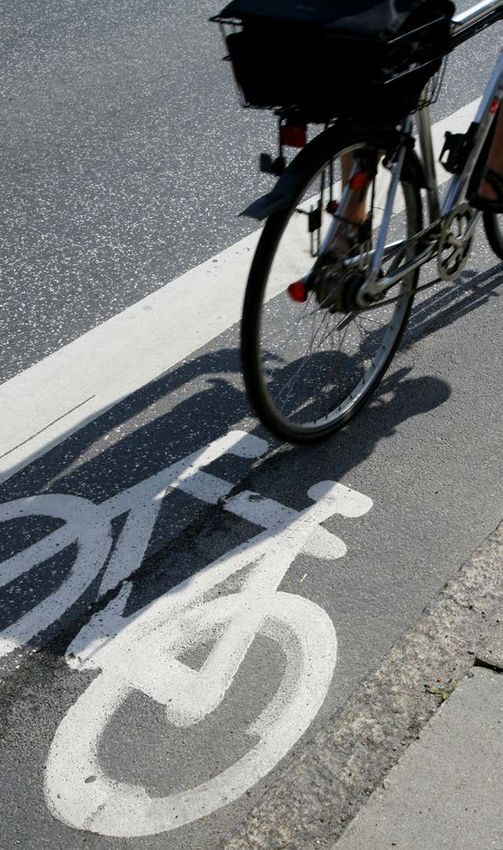
8. Commuter Travel
Walking
Working in conjunction with the Healthy University Initiative, we promote the health and environmental
benefits of cycling and walking to work. We have developed a ‘Walking Campus’ initiative of guided walks
led by trained volunteer walk leaders. The project aims to encourage people to take every opportunity to
build exercise into their daily lives. We have a number of trained walk leaders and we have worked with
Preston City Council to develop five measured one-mile walks. Lunchtime walks and walking meetings are
encouraged. We also take part in the annual National Walk to Work Month.

Cycling
Our staff and students have access to a range of excellent cycle facilities across campus which help make
cycling a viable option for commuting. Cycling on campus has seen a large amount of investment over
the last few years. We have a range of cycle storage facilities, including cycle compounds, individual cycle
lockers and equipment lockers. Cyclists also have access to shower facilities, a subsidised bike lock scheme
and regular free bike maintenance sessions.
We are perfectly situated for leisure and commuter cycling and is on a National Cycle Route, whilst being in
close proximity to others, including The Guild Wheel, a 21 mile “Greenway” that encircles the city of Preston.

Public Transport
As part of the University’s commitment to sustainable travel, we actively encourages staff, students and
visitors to the University to use public transport. Preston Campus is conveniently located within easy walking
distance of both the railway station (Preston Lancs) and Preston bus station.
We have produced a detailed travel guide to provide information on sustainable travel, including personal
journey planning and have negotiated a range of travel discounts for staff and students.

Rail
We are conveniently situated within walking distance of Preston Train Station making the train an excellent
mode for travel to the campus. Preston is a principal station on the West Coast Main Line from London to
Glasgow. Routes to Preston run from London Euston, Birmingham, Manchester, Liverpool, Glasgow and
Edinburgh. There is also a direct link to Manchester Airport. Staff have access to an annual rail season ticket
loan scheme which sees the cost of an annual rail season purchased by the University with interest free

8 Travel Plan 2019 – 2024
repayments spread over 12 months directly from salary. Students have access to rail discounts under the
16-25 and 26-30 railcard schemes, allowing a potential cost saving of 1/3 on rail journeys.
The train station is also host to a secure Bike Hub. The fully enclosed bike storage Hubs have 24- hour
access using a key fob, and are CCTV monitored, individuals are also able to hire a bike and access a
maintenance service.

Bus
We are well serviced by bus routes and all major bus services from outside of Preston stop at the Bus
station which is only a 10-minute walk away from campus. Some local services stop nearer to campus and
staff and students benefit from the same semester length bus travel discounts offered by Preston Bus and
Stagecoach Bus. Up-to-date, specific route information can be found on the transport providers websites
Preston Bus / Stagecoach Bus.
We engage with bus service providers on a regular basis to try to ensure that these services meet the
expectations of our staff and students. We also subsidises a bus service that connects Accrington/Blackburn
and Blackpool & the Fylde to Preston, with a more direct, quicker and cheaper service stopping centrally
on campus.
UCLan Super Bus, a joint initiative, between the University and the UCLan Students’ Union (SU), has seen the
trial of two new bus services running from Accrington/Blackburn and Blackpool to Preston for only £1 per
trip. The service is affordable, quick and stops at the Students’ Union at the heart of campus.

Park and Ride
Preston boasts two Park & Ride facilities offering a regular service into the City Centre from convenient
links from the M6 and M65, providing parking on the outskirts of the city and relieving congestion. Both
services stop close to the Railway station, just a 10-minute walk away from campus.

Car Share
We have teamed up with Liftshare to supply private car share groups for students and staff, using this web-
based system the University is able to monitor its membership. Staff and students are able to identify a car
share partner, whether they have access to a vehicle or not. Individuals awarded a Car Share permit receive a
50% reduction in the cost and have access to dedicated Car Share bays on the University’s main car parks.

9 Travel Plan 2019 – 2024
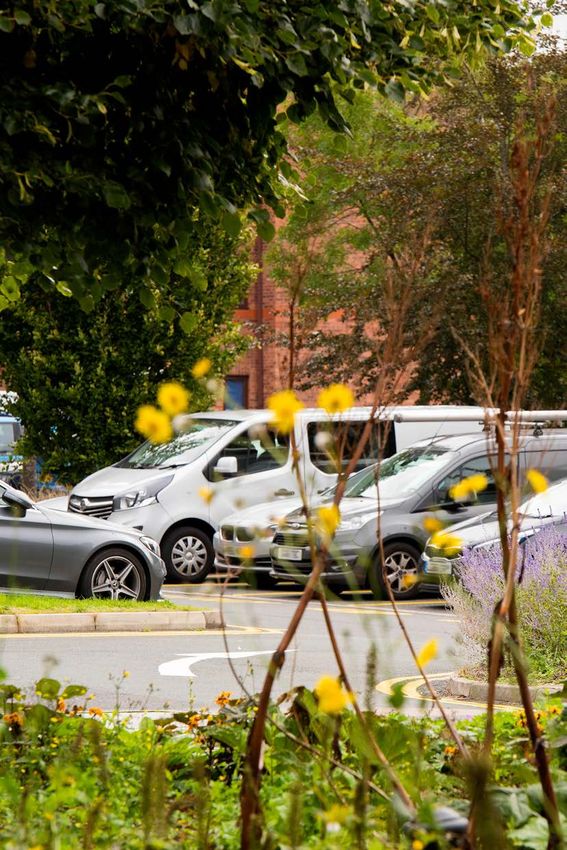
9. Preston City and Campus Map
The ‘Preston City Guide and Campus Map’ has been designed for staff, students and visitors. The guide
is updated annually and is available in paper format. The purpose of the guide is to highlight the various
access routes to campus by a number of travel modes. The campus map included in the guide includes
a walking distance scale to highlight the proximity of campus from the train and bus station as well as
preferred walking routes. A map of Preston City centre is also included, and the guide is made available
around campus and is included at induction events.

10. Car Parking Space and
Demand Management
UCLan currently has car parking provision for 1,400 spaces as agreed by Lancashire County Council,
according to guidance within the Parking Standards contained in the Preston Local Plan 2012-2026.
UCLan offers permit parking in order to control the demand and has a number of pay and display facilities
on some parks for short stays. There is also a visitor car park with 40 bookable spaces.
With over 40% of University staff living over 10 miles away from campus, the majority of staff park on
University car parks. Currently all staff are entitled to purchase a car parking permit no matter how close they
live to the University.
Many local roads around the University have seen parking restrictions applied over recent years, which has
pushed the on-street car parking out to areas beyond the non-residential areas and into further outlying
residential areas. The availability of on-street parking in some parts of Preston in close proximity to the
University, along with staff being prepared to walk further distances to avoid paying for a car parking permit,
may have accounted for the increase in on-street car parking at one point. However, with additional parking
restrictions applied to on-street parking within the past year, trends show that more staff are parking on         View the campus map >
campus again and less are using the on-street parking. This inevitably means less parking availability for
students.
UCLan has seen an increase in the demand of student car parking permit applications, presumed to be
caused by the changing demographic of students, with increasing numbers choosing to commute rather
than stay in local accommodation for the duration of their studies. In January 2020 UCLan appointed The
Parking Consultancy (TPC), based on their experience of working in the fields of car parking and sustainable
travel to carry out a review of car parking and its operations.

10 Travel Plan 2019 – 2024
Air Quality Management (AQMA)
Preston City Council is committed to the development of a Lancashire wide air quality and planning policy.
5 AQMAs have been identified in and around the city. Within Preston, the main pollutant of concern is
Nitrogen Dioxide, which is mainly related to transport sources. The Travel Plan supports the Preston Local
Plan 2012-2026 and its supporting strategies and is aware of the national Air Quality Management Areas.

Car Parking Locations
As a city centre campus this Travel Plan monitors where staff and students park, in order that we continue
to maintain good relationships within our local community.

Staff Car Parking Location Trends 2006-2019

  Car Parking Location                2006/2007 2010/2011 2014/2015 2017/2018 2018/2019
  University Car Park                    90%           85%           83%          81%           85%
  Public Car Park                         2%            2%            2%           2%            3%
  Park & Ride                             1%            0%            0%           0%            2%
  On-street (residential)                 2%            4%            3%           3%            2%
  On-street (non-residential)             5%            4%            5%           9%            6%
  Other                                   0%            5%            7%           5%            2%

Student Car Parking Location Trends 2013-2018

  Car Parking Location                              2013/2014 2014/2015 2016/2017 2017/2018
  University Car Park                                  23%           46%          44%           36%
  Public Car Park                                      33%           23%          29%           26%
  Park & Ride                                           0%            2%           2%            2%
  On-street (residential)                              22%           18%          19%           17%
  On-street (non-residential)                          11%            6%           6%            8%
  Other                                                11%            5%           0%           11%

11 Travel Plan 2019 – 2024
11. Travel Survey Results                                             Staff Travel
                                                                                   Travel Plan Targets 2018/19 - Travel Survey Data
                                                                                   Survey - Audit    SummaryActual
                                                                                                              2018/19
                                                                             Mode            Target 2018/2019      2018/2019
Staff Travel Survey – Audit Summary Results 2018/2019                              Car Solo                           47.5%              49%
                                                                                   Car Share                           10%               8%
  Modal Split 2018/2019                                                            Car Use Combined                   57.5%              57%
                                      Motorcycle
                            Walk         1%                                TravelRailPlan Targets 2018/19 Travel Survey
                                                                                                                  15%   Data            17.5%
                            10%
                                                                                   Bus                                 8.5%              8%
                    Cycle
                     6%                                                    ModeCycle           Target 2018/2019 Actual
                                                                                                                 8%    2018/2019         6.5%
                                                                                   Walk                                9.5%              9.5%
                 Bus                                                       Car Solo
                                                                                 Motorcycle           47.5%            1.5    49%        1.5%
                 8%                                                        Commuter
                                                                                                                                                Car Solo and Car S
                                                      Car Solo
                                                       49%                 Car Share                  10%                      8%               61        59

                                                                           Car Use                57.5%                  57%
                                                                           Combined
                  Rail
                                                                                                                                                     10        11
                  18%                                                      Rail Car Solo and Car Share
                                                                                                   15% Data Trends 200417.5%
                                                                                                                        - 2018
                                                                           Bus     70%                8.5%                     8%
                                                                                                                                                2004/5    2006/7
                                   Car Share
                                                                                   60%
                                      8%                                   Cycle                       8%                     6.5%
                                                                                   50%
                                                                           Walk                       9.5%                    9.5%
                                                                                   40%
   Car Solo at 49% is just 1.5% above target
                                                                                           Motorcycle              1.5                 1.5%
             Car Solo at 49% is just 1.5% above target
   Car Sharing at 8% is below target (10%)                                                      30%
             Car Sharing at 8% is below target (10%)
   Car Commuting overall stands at 57% which is below the combined                              20%
   target ofCar
             57.5% Commuting overall stands at 57% which is below the combined target of 57.5%
                                                                                                10%
   WalkingWalking         attarget
              at 9.5% is on  9.5% is on target
   Cycling atCycling
                6.5% hasat  6.5% has
                          decreased        decreased
                                       slightly           slightly
                                                and is 1.5%          and (8%)
                                                            below target  is 1.5% below target (8%)
                                                                                                  0
                                                                                                      2004/5     2006/7      2010/11 2014/15 2016/17 2018/19
             Rail
   Rail Travel  hasTravel
                    increasedhasby increased
                                    2.5% and hasby seen2.5%
                                                         a 6% and    hasover
                                                               increase  seenthe a 6% increase over the past two years. Now standing at 2.5% above target at 17.5%
   past twoBus
             years.Travel    remains
                    Now standing           static
                                     at 2.5%       attarget
                                               above   8% and     is 0.5% below target
                                                            at 17.5%
                                                                                                      % Car Solo       % Car Share
   Bus TravelActions to help meet the targets:
                remains  static at 8%  and  is 0.5% below  target
             • Continue to negotiate discounts with the main bus operators and work with Rail North Ltd to promote Rail Season Ticket loans for s
             • Continue to promote cycle facilities, free bike maintenance sessions and the Cycle to Work scheme.
             • 2019
12 Travel Plan   Work
                    – 2024closely with internal stakeholders improving accessibility and raising awareness of incentives for greener travel choices
             • More promotion through HR for new starters prior to interview at UCLan, outlining travel options available. Follow up email to New
Student Travel Survey – Audit Summary Results 2017/2018 Travel Plan Targets 2017/18 - Travel Survey Data
Mode Target 2017/2018 Actual 2017/2018
Car Solo 19% 19%
ModalModal
Split 2017/2018
Split 2017/2018
Car Share 12% 9%
Car Solo Car Use Combined 28% 27%
Car19%
Solo
19% Rail 12% 18%
Walk Bus 8.5% 12%
Walk
36%
36% Cycle 2.5% 6%
Car Share
Car Share Walk 49% 36%
9%
9%
Car Solo and Car Share Data Trends 2009 - 2018
Rail
18%
Rail
Cycle
Cycle 25%
18%
6%
6%
Bus
Bus
12%
12% 20%
15%
Car Solo has reduced by 2% and stands at 19% 10%
Car Sharing at 9% is 3% below target (12%)
Car Commuting overall at 27% is on target 5%
Walking at 36% is below target (49%), however, more students are choosing to live
off campus and commute. 0
Cycling at 6% has increased this year and is above the target of 2.5% 2009/10 2012/13 2013/14 2016/17 2017/18
Train travel has increased again to 18% this year, and is now 6% above target
% Car Solo % Car Share
Bus travel has increased by 4% this year this year and is 4% above target.
13 Travel Plan 2019 – 202412. Modal Split Targets 2019-2024 Staff Modal Split Targets 2004-2024 Mode Actual Actual Target Target Target Target Target Target 2004/2005 2017/2018 2018/2019 2019/2020 2020/2021 2021/2022 2022/2023 2023/2024 Car Solo 62% 48% 47.5% 47% 46.5% 46% 45.5% 45% Car Share 10% 10% 10% 10% 10% 10% 10% 10% Overall Car Use 71% 58% 57.5% 57% 56.5% 56% 55.5% 55% Rail 7% 15% 15% 15% 15.5% 16% 16.5% 17% Bus 5% 8.5% 8.5% 8.5% 9% 9% 9% 9% Motorcycle 2% 1.5% 1.5% 1% 1% 1% 1% 1% Cycle 3% 8% 8% 8% 8% 8% 8% 8% Walk 11% 9% 9.5% 9.5% 9.5% 10% 10% 10% Staff Modal Split Targets 2004-2024 Mode Actual Actual Target Target Target 2004/2005 2017/2018 2019/2020 2021/2022 2023/2024 Car Solo 19 19 18.5 18 17 Car Share 9.5 9 9 9.5 10 Overall Car Use 28.5 28 27.5 27.5 27 Rail 12 18 18 18.5 19 Bus 6 12 12 12.5 13 Cycle 1 6 6 6 6 Walk 44 36 36.5 35.5 35 Other 9 14 Travel Plan 2019 – 2024
13. Monitoring and Review
Monitoring
Our travel activities are monitored through a number of different sources, including an annual travel survey,
information from travel providers, internal financial systems and the uptake of staff benefits. The data collected
enables us to understand our travel impacts and assess our progress towards positive change.

Document Revision
This document is updated annually to include new policy where applicable; reviewed and additional versions
of the annual Sustainable Travel Action plans; and Updates to Modal Split arising from travel survey results.

Travel Surveys
Separate staff and student Travel Surveys have previously been conducted annually but going forward, staff
surveys will continue to be conducted annually, whereas student travel surveys will be conducted biennially
starting from 2018/2019. Results of modal split will be published in the format of audit summaries within the
Travel Plan document and updated once survey analysis has been completed.
To enable us to monitor progress of the Travel Plan targets, modal split results as well as the take up of
sustainable travel initiatives are monitored.
The following indicators will continue to be used to monitor the Travel Plan initiatives at UCLan:
• Number of car parking permits issued
• Usage of cycle facilities
• Feedback from staff and students
• Uptake of free bike maintenance sessions
• Car Share memberships via www.sharedwheels.co.uk
• Uptake of staff annual rail season ticket loans
• Usage of myPTP (number of personal travel plans issued)
• Number of staff/students accessing discounted bus tickets
• Annual reports on the Action Plan element of the Travel Plan will be provided to the University’s
  Environmental Management Systems (EMS) Steering Group and the University Executive Board detailing
  achievements against targets.

15 Travel Plan 2019 – 2024
14. Business Travel
It is recognised that an essential part of our work involves staff and students travelling off-site.
However, sustainable travel decisions can be made as an integral part of this process, reducing Virtual Conferencing
the impact the environment and potentially saving money. As part of our Travel Policy, staff are
encouraged prior to booking travel to consider the travel hierarchy. The travel hierarchy is a useful The University supports a variety of
framework for use within the University, setting out the order in which options for travel/ transport conferencing technologies, such
should be considered based on environmental impact.
as SKYPE for Business and other applications
University financial regulations set travel allowances and guidance on distance to be travelled per mode.
We have implemented an online booking tool for claiming expenses and as a result, individuals which offer the opportunity to engage with
will have to register their personal driver details before claiming mileage (grey fleet). staff, students and external stakeholders
We have committed to rolling out an online car hire booking tool, this should streamline internal who are based off campus.
administration processes, making it easier for staff to book their own hire car. In addition to this, we are also
looking into having an onsite car club where staff can hire an onsite pool car, suitable for shorter /partial day
trips. This will form part of the online car hire booking tool and in effect, should reduce the amount of grey Car Sharing for business travel
fleet mileage attributed to business travel which currently stands at 54% of all business travel. Grey fleet
mileage has seen a 20% increase in the past two years, it is hoped that there should be a significant shift Car Travel - staff can use the UCLan car sharing
onto more fuel-efficient hire cars and a move away from individual mileage claims.
database for logging one-off business journeys
Most Sustainable in order to find a car sharing partner.
Travel Allowances
Virtual
Conferencing Business travel allowances are managed
Walking or Cycling from the Travel Office. Mileage rates currently
Public Transport stand at 45p/per mile for a maximum of
(Rail, Coach, Bus)
10,000 miles per annum, a passenger rate of an
Car Sharing
(Fleet Vehicle/Hire Car) additional 5p/per mile has just been introduced.
Car Sharing (Privare Car/Taxi) Cycling on business attracts 20p/per mile.
Solo Occupancy Car
Air
Least Sustainable
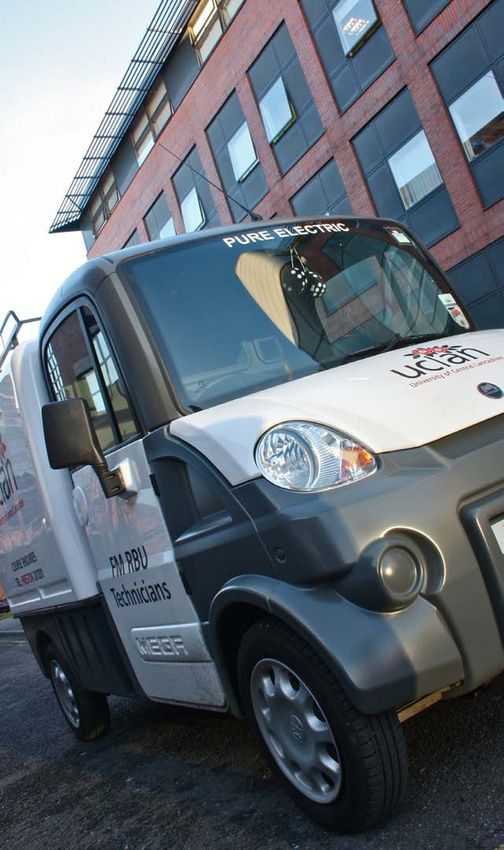
16 Travel Plan 2019 – 2024Carbon Emissions Since 2010/2011 the University’s internal financial software has been used to collect domestic business mileage using destinations of travel. Destinations are then used to estimate the carbon emission data for UK business travel by car (grey fleet), hire car, bus/coach, rail and domestic air travel. International business mileage by air has started to be collected using the same process from flight data booked through the Travel Office from our financial reporting system, from which mileage and carbon emissions can be estimated. Carbon emissions from business travel (by both staff and students) will be reported to HEFCE when the reporting of Scope 3 travel emissions becomes mandatory in the Estate Management Records. In the meantime, this data is collated and monitored internally and provides useful base line data for any information required in the future. 15. Fleet Management Our fleet comprises of 40 vehicles; 4 cars, 20 vans, 2 minibuses and 12 others (predominantly grounds vehicles) and 2 electric vehicles. Vehicles are regularly serviced in accordance with manufacturers specifications and maintained to achieve optimum fuel efficiency. All vehicles are selected for fit-for purpose usage and durability with a life -span of vans averaging 7-10 years. Consideration is given to replacing vehicles with more efficient models including electric vehicles in line with the Vehicle Replacement Strategy. We also have a Fleet Drivers Procedure which ensures that drivers are trained on the importance of driving safely as well as in an efficient and eco-friendly manner. Electric Vehicles We have electric vehicle charging points on one of the larger car parks and on the visitor’s car park. Currently our electric fleet vehicles charge here and staff/student electric vehicles can use the charging points if they meet the criteria within the Electric Vehicle Charging Policy. 17 Travel Plan 2019 – 2024
16. Visitor Travel
We only have 40 bookable car parking spaces for visitors due to the limited
amount of car parking on campus. We receive many requests for visitor car
parking and therefore visitors have to meet the set eligibility criteria. Visitors are
encouraged to travel to campus by sustainable modes and a Preston Campus
and City Guide is available to inform visitors of available travel options.

An Equality Impact Assessment highlighted that there are no adverse impacts
of the Travel Plan on the six equality target groups; Age Gender, Disability,
Race, Religion and Belief or Sexual Orientation. However, modal choice will be
determined to some extent by Age, Gender and Disability and the Travel Plan
aims to improve facilities for all members of the University community.

Joanne Hall
Sustainable Travel Coordinator
University of Central Lancashire,
Preston.
PR1 2HE
Tel: 01772 892052
Email: jmtalbot@uclan.ac.uk

18 Travel Plan 2019 – 2024                                                               09431v3 7/21
You can also read