TRANSMISSION 101 Alison Silverstein () NCEP Transmission Technologies Workshop April 20-21, 2011
←
→
Page content transcription
If your browser does not render page correctly, please read the page content below
TRANSMISSION 101

Alison Silverstein (alisonsilverstein@mac.com)
NCEP Transmission Technologies Workshop
April 20-21, 2011

OVERVIEW

1.   What is transmission and how do we use it?
2.   Statistics, maps and costs
3.   Roles and benefits of transmission (with
     examples)
4.   Basic transmission levels and equipment
5.   Planning the system
6.   Closing thoughts
7.   Additional details

                                                  2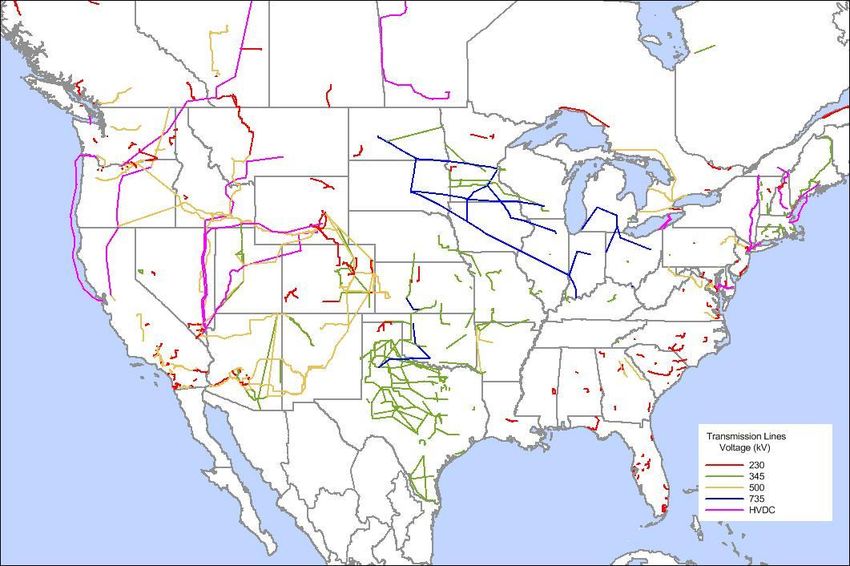
1) TRANSMISSION AND THE POWER SYSTEM
Generation: creates electric energy using a variety of
fuel sources, at many locations.
Load: the homes, factories, offices, and devices that
consumer electricity. “Load center” is the location (like
a city or major industrial customer) where lots of
energy use is concentrated
Transmission: moves electric power long distances
from generation points to customer load centers.
Usually >69kV
Distribution: distributes electric power and energy
the final distance from transmission to loads. Usually
operates at 35kV or less.
3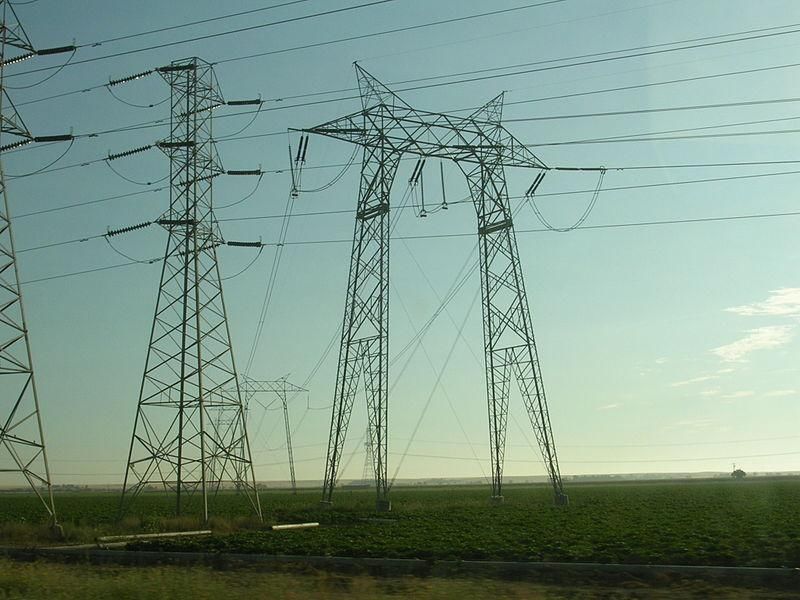
THE TRANSMISSION SYSTEM
The electric system was
originally built as many local
or regional grids, linking
generators to loads.
Local grids were joined to
improve reliability and lower
costs by sharing generation.
With the development of power
trading markets and long-
distance backbone
transmission lines, the US and
Canada evolved into 3 large
regional interconnections.
164,000 mi network linking
over 75,000 MW of generation
to millions of customers served
by 3,000 utilities.
4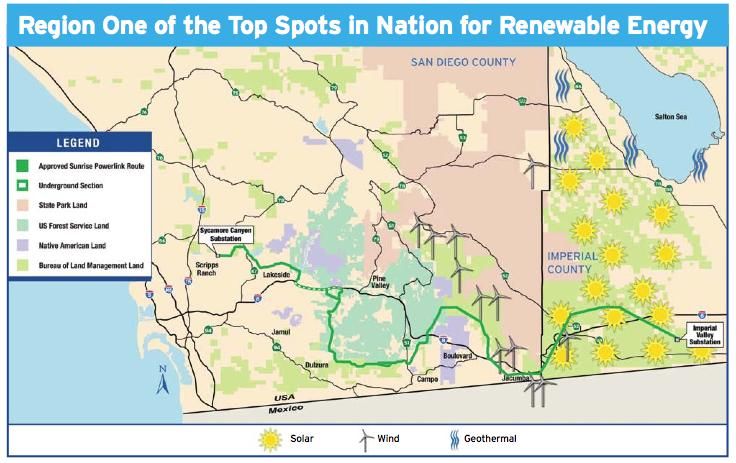
2) STATISTICS, MAPS & COSTS
ALL TRANSMISSION, 69KV AND ABOVE

                                   5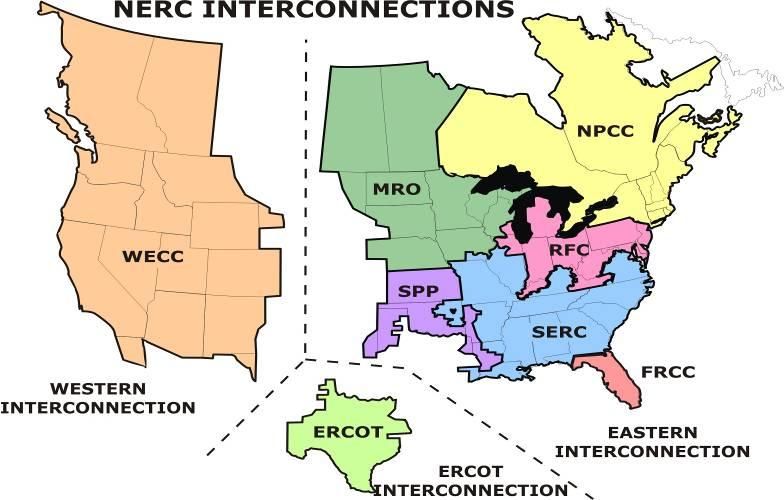
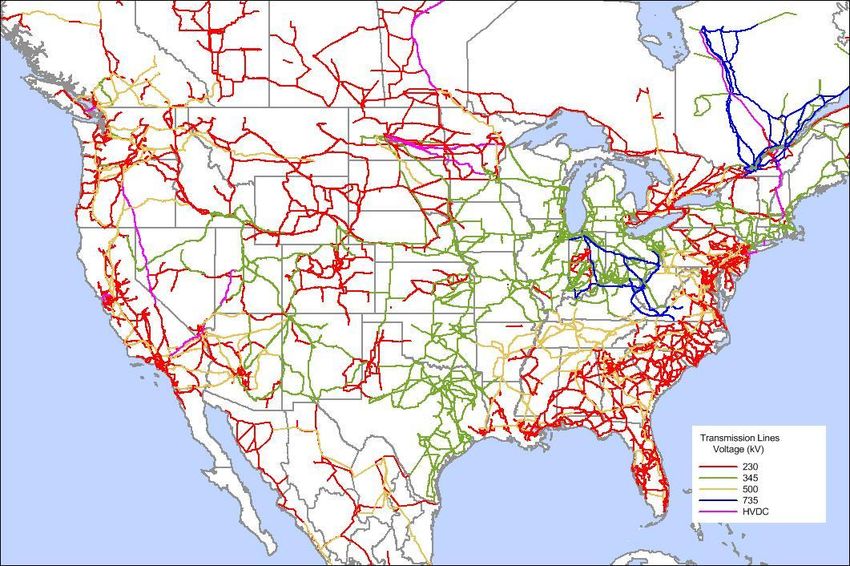
U.S. TRANSMISSION, 230 KV AND ABOVE

                                      6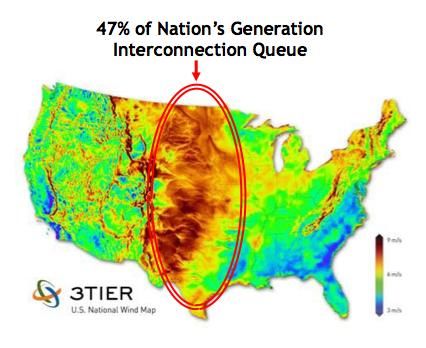
PROPOSED NEW TRANSMISSION, >230KV

                                    7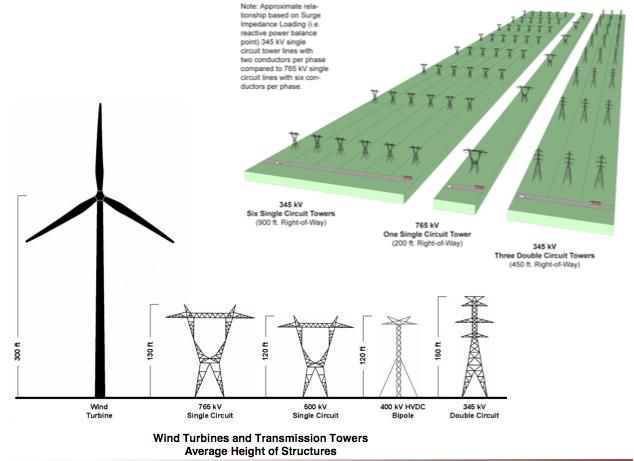
BASIC TRANSMISSION STATISTICS
452,699 circuit-miles of transmission in North
America in 2009 (per NERC – US, Canada, Mexico, 2010)
280,341 mi in Eastern Intercon
120,763 mi in Western Intercon
28,665 mi in ERCOT
Circuit-mile = miles of line x circuits/line
U.S. transmission (>100kV) projected to grow from
372,340 mi in 2009 to 406,730 mi by 2019
15,700 transmission substations in U.S.
8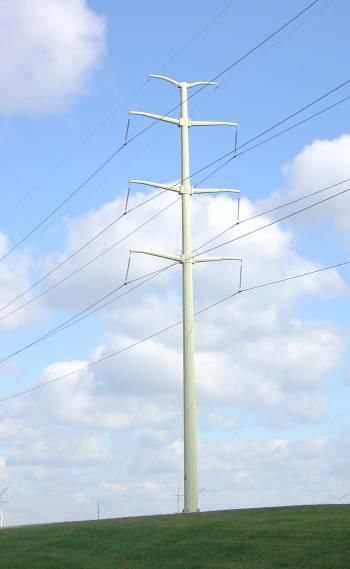
U.S. ELECTRIC TRANSMISSION INVESTMENT
ACTUAL

                                             9
              EEI – Navigant 2/2010 Survey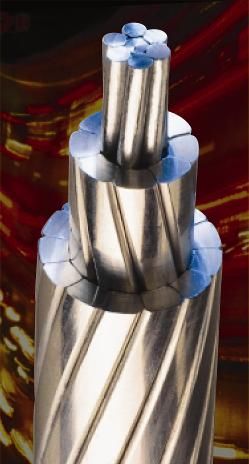
TRANSMISSION ADDITIONS
After two flat decades of low transmission
construction, NERC finds transmission additions are
increasing (in circuit-miles)
But transmission additions aren’t yet keeping up with
demand. 2008 Brattle Group estimate that $298
billion transmission investment needed between 2010
and 2030 to maintain reliable service; EEI says $56
billion planned 2009-2020.
10US TRANSMISSION ADDITIONS PLANNED
• About 3,100 circuit-miles now under construction as of mid-2010
• About 24,000 circuit-miles in planning phase
• About 12,000 circuit-miles in conceptual stage
Data from NERC 2010 LTRA 11NON-LINE TRANSMISSION INVESTMENTS
Substations, equipment replacements
(transformers, phase shifters), reactive
compensation (capacitors, static VAR
compensators, dynamic reactive sources such as
FACTS devices)
Control systems (EMS, SCADA, dynamic line
rating)
Smart grid -- monitoring devices (phasor
measurement units), transmission automation
(automatic reclosers), analytics and diagnostic
tools
Communication networks
12
Physical and cyber-securityTRANSMISSION INVESTMENT AND RATES
Hard to get estimates of total transmission investment:
$91 billion spent by IOUs 1980-2008 (EIA),
expect another $56 billion investment by IOUs from 2009-
2020 (EEI).
Transmission investment has been growing slowly –
9,700 mi of HVT were built in the 1990s, around 9,000
mi built in 2001-2010, and 39,000 circuit-miles could be
built in this decade (per NERC).
On average, total transmission capital and operating
costs translated into rates equal less than 5% of a
ratepayer’s monthly electric bill – so substantial
increases in transmission investment can end up
causing very small rate increases, or be wholly offset by
energy savings from accessing low-cost generation or 13
reducing line losses and congestion costs.TRANSMISSION OWNERSHIP AND FUNDING
Electric utility – recovers costs through cost-of-service
rates to ratepayers and transmission customers
Investor-owned, vertically integrated or functionally separate
wires company subsidiary
Municipal utility
Cooperative (or Generation & Transmission coop for other
coops)
Independent transmission company (ITC, American
Transmission Co.)
Merchant transmission (third-party non-utility
ownership, often DC projects like Neptune) – recover
costs through market-based contracts and fees
REITs – IRS has approved T&D assets as real estate
for REIT requirements (Hunt Transmission)
Project financing – create a project-specific LLC to
borrow against project cash flows and improve leverage 14
and tax status3) ROLES AND BENEFITS OF TRANSMISSION
1. Interconnect new generation and resource areas
to the grid
2. Improve reliability by strengthening the grid
3. Improve reliability and manage risk by
providing access to additional generation
resources
4. Reduce energy cost by providing access to
diverse generation resources
5. Reduce congestion by creating new flow paths
and system capacity
6. Increase efficiency by reducing line losses
7. Make wholesale markets more competitive and 15
efficientREASONS FOR NEW TRANSMISSION
Over half of these projects planned by 2019 are to
maintain or improve reliability
A quarter are for integrating renewables (EEI
says >12,900 mi of transmission, $37 billion)
BUT – the average project is less than 70 miles
long, so most are local rather than
regional/interstate.
16
NERC 2010 LTRAINTERCONNECT NEW GENERATION
COMANCHE-DANIELS PEAK LINE
Interconnects Comanche Power Plant Unit 3
($1.4 billion, 750 MW coal-fired plant) to PSCo
(XCel) grid
Double-circuit 345 kV line
Cost of $150 million
17INTERCONNECT NEW GENERATION RESOURCES
POLICY PUSH FOR RENEWABLE GENERATION
RPS Policies
www.dsireusa.org / April 2011
VT: (1) RE meets any increase ME: 30% x 2000
WA: 15% x 2020* New RE: 10% x 2017
MN: 25% x 2025 in retail sales x 2012;
MT: 15% x 2015 (Xcel: 30% x 2020) (2) 20% RE & CHP x 2017 NH: 23.8% x 2025
OR: 25% x 2025 (large utilities)* ND: 10% x 2015 MI: 10% & 1,100 MW MA: 22.1% x 2020
x 2015* New RE: 15% x 2020
5% - 10% x 2025 (smaller utilities)
(+1% annually thereafter)
SD: 10% x 2015 WI: Varies by utility;
NY: 29% x 2015 RI: 16% x 2020
10% x 2015 statewide
NV: 25% x 2025* CT: 23% x 2020
IA: 105 MW OH: 25% x 2025†
CO: 30% by 2020 (IOUs) PA: ~18% x 2021†
10% by 2020 (co-ops & large munis)*
IL: 25% x 2025 WV: 25% x 2025*† NJ: 22.5% x 2021
CA: 33% x 2020 UT: 20% by 2025* KS: 20% x 2020 VA: 15% x 2025* MD: 20% x 2022
MO: 15% x 2021 DE: 25% x 2026*
AZ: 15% x 2025
OK: 15% x 2015 NC: 12.5% x 2021 (IOUs) DC DC: 20% x 2020
10% x 2018 (co-ops & munis)
NM: 20% x 2020 (IOUs)
10% x 2020 (co-ops)
PR: 20% x 2035
TX: 5,880 MW x 2015
HI: 40% x 2030
29 states +
Renewable portfolio standard Minimum solar or customer-sited requirement DC and PR have
18
*†
Renewable portfolio goal Extra credit for solar or customer-sited renewables an RPS
(7 states have goals)
Solar water heating eligible Includes non-renewable alternative resourcesLOTS OF POTENTIAL NEW GENERATION
AWAITING INTERCONNECTION
Wind Resource Potential Transmission System
19INTERCONNECT NEW GENERATION AREAS
TEXAS CREZ LINES
Over 2,300 miles of 345 kV
transmission will be built at a
cost of $8 billion by seven
transmission utilities chosen
by the PUCTx.
These lines will deliver 18.5
GW of windpower from W.
TX and the Panhandle to
central TX.
Benefits will include $30 bil
in economic gains, including
lower energy costs, landowner
income, tax income, economic
development and jobs, plus
lower air emissions, 17 bil gal
water saved.
Average ratepayer cost =
$4/month 20INTEGRATING RENEWABLES Every study of renewable generation development potential and goals within the U.S. has concluded: 20, 30 and 35% renewables development are technically feasible if the transmission system is significantly expanded Major amounts of new transmission is required for every future wind development scenario in the Eastern and Western interconnections Costs for integrating large amounts of renewables are manageable with large amounts of transmission and large regional operating pools (including fast, flexible non-renewable generation); markets make it easier to get 21 ancillary services easily and cost-effectively.
IMPROVE RELIABILITY, STRENGTHEN GRID
CALIFORNIA PATH 15 UPGRADE
Path 15 is an 84-mi stretch of
transmission through CA’s Central
Valley, built to deliver Pac NW
hydropower south to CA and the SW.
Two 500kV lines (Los Banos- Gates,
Los Banos-Midway)
Four 230kV lines (at Gates)
Total capacity was 3,900 MW, so it
bottlenecked power flows into
southern CA.
After CA electricity crisis of 2000-
2001, WAPA and Trans-Elect built a
third 500kV line and a 5th 230 kV
circuit to reduce the constraint,
expanding south-to-north capacity to
5,400 MW in 2004.
Trans-Elect financed the $300 million
upgrade and owns capacity rights 22ACCESS ADDITIONAL RESOURCES TO REDUCE
COST, DIVERSIFY RISK
SUNRISE POWER LINK
Imperial Valley to San Diego, by SDG&E
117 mi, 500 kV line, 1,000 MW capacity for $1.9
billion
Will create transmission access for wind, solar, and
geothermal resources
Projected benefits of $100 million/yr in net benefits to
SDG&E customers
23REDUCE CONGESTION, IMPROVE ECONOMICS
MISO REGIONAL TRANSMISSION EXPANSION
Midwest ISO estimates that its 2010 transmission
expansion plan (231 projects, $1.2 billion in new
infrastructure on top of previously approved projects)
will lower electric generation costs, lower delivered
electricity costs (LMPs at loads), reduce energy and
capacity losses, and reduce required reserve margins.
for reliability.
24INCREASE EFFICIENCY AND RELIABILITY
ONCOR SVCS
Oncor added two Static Var Compensators in
Dallas and Fort Worth to provide dynamic voltage
control and mitigate power oscillations to improve
reliability in ERCOT’s largest load center.
Through dynamic reactive power injection, SVCs
can increase transfer capability and reduce line
losses.
Each SVC costs over $50 million.
25IMPROVE RELIABILITY, STRENGTHEN GRID REPLACE AGING INFRASTRUCTURE Lots of today’s EHV system was built in the 1960s and PJM 500 kV structure it isn’t aging well. Steel thickness loss, metal fatigue and cracking Metal corrosion Deterioration of line splices and insulators Foundations and footings are deteriorating Transformers nearing or past end of useful lives Unless these are fixed or replaced, failure by these structures or devices will cause big outages. 26
4) BASIC TRANSMISSION LEVELS AND
EQUIPMENT
What is a transmission line?
Transmission voltages
Parts of a transmission line
27WHAT IS A TRANSMISSION LINE?
Wires between substations
Can be constructed overhead or underground
Transfers voltage between sources and loads,
allowing current to flow
Energy (Watts) = V (Voltage) x I (Current in
Amperes)
Lines
are rated for Voltage, Current, and
Energy Transfer
Energy = throughput over time, e.g. kWh
Demand = maximum capacity at a point in time, e.g. peak kW
We design the grid to serve maximum expected peak demand reliably
and cost-effectively 28TRANSMISSION VOLTAGES
Standard US AC
Transmission Line Voltages Voltage >230 kV called Extra
Nominal Maximum High Voltage (EHV)
Lower voltages have higher
(kV-rms) (kV-rms)
69 72 line losses
115 121 Not all voltages in every
138 145 region; rest of world has
different but similar voltage
161 169
ratings
230 242
China building new 1,100 kV
345 362 lines
500 550
29
765 800TRANSMISSION VS. DISTRIBUTION
Transmission: Distribution:
Bulk transfer of electrical Limited quantity of energy
energy transferred
Generator to substation Substation to customer
Substation to substation Residential or business
Long distance Short distance
High voltage (>69kV) Low voltage (MAJOR COMPONENTS OF AN OVERHEAD
TRANSMISSION LINE
Shield wire
Conductor Conductor
Shield wire
Insulator
Insulators/hardware
Structure
Foundation
Grounding
Monopole structureOVERHEAD TRANSMISSION LINES CAN BE
Single Circuit,
Double Circuit,
32
Or Multiple
CircuitTRANSMISSION LINE RIGHT-OF-WAY (ROW)
The strip of land the line is on
Provides access for construction, operation and maintenance
Conductor movement must be contained within ROW
Higher voltages require wider ROWs
ROW width controls much of line design
Effective vegetation management in ROW is crucial
33RIGHT-OF-WAY CROSS-SECTION Electric lines sag lower as they carry more electricity, in hotter temperatures, and with ice loading. If utilities don’t maintain and enforce (and regulators don’t support) vegetation management and ROW easements, there are more outages and accidents due to sagging 34 lines contacting trees and structures in the ROW.
TRANSMISSION VOLTAGES, STRUCTURES AND
ROWS
35
Higher voltages use ROW acreage more efficientlyDC TRANSMISSION
DC links between AC lines and systems
More expensive to build
DC lines have few drop-off points
DC has lower line losses, high efficiency
Use DC, HVDC for long distances, high capacity
36CONDUCTORS Copper used only for small distribution conductors Aluminum most common for transmission voltages Aluminum has about 60% of the conductivity of copper, but is much cheaper; good conductivity but poor strength Steel strands wrapped around aluminum add strength – ACSR (Aluminum Conductor Steel Reinforced) is the most commonly used conductor Conductor under higher tension sags less 37
NEW CONDUCTORS
Many newer competing
technologies claim advantages
Low line losses
Low sag (high strength)
Withstand high temperature
Can operate safely at higher
voltages
New materials
Lower cost/delivered energy
Reconductoring can increase
line capacity without building
new lines 37OVERHEAD TRANSMISSION VS. UNDERGROUND Overhead: Underground: Low system loss Shorter distances Lower installation and Increased system loss maintenance cost Higher installation and Accessible for maintenance cost (10x cost maintenance and problem- differential) spotting Harder to access for Wider Right-of-Way maintainance and repair Visually obtrusive Narrower Right-of-Way Environmental concerns Visually inconspicuous EMF/Corona concerns Some environmental Higher likelihood of concerns accident or attack Few EMF issues 39
TRANSMISSION COST Transmission line construction cost varies by many factors: Voltage Overhead or underground (rule of thumb – undergrounding costs 10x as much as a comparable overhead line) Design specifics (e.g., structure types, number of phases, ROW width, whether you’re over-building today to up-rate line later, strength requirements for local climate impacts) Route length Type and location of land (urban costs more than rural) Materials costs (type of conductor, steel v. concrete structures, amount of imported content and relative currency costs, component materials scarcity) Accommodations made to suit landowners and siting authorities (changes in structure type, route adjustments to meet environmental requirements, community needs or40 landowner demands)
TRANSMISSION COST ELEMENTS
Transmission capital costs include ROW land,
  materials, construction, regulatory and
  permitting, and substations
Transmission operating costs include operations
  and maintenance, vegetation management, taxes,
  insurance – total about 3% of capital cost
Transmission levelized cost in $/MWh = capital cost
  plus O&M over lifetime (50 years), adjusted by
  line capacity (MW) and utilization factor (%)

                                                      41
TRANSMISSION INTEGRATION COST
When a new generator interconnects to the grid, it
may have operational characteristics that require
additional effort by operators to integrate that
generation reliably into grid operations.
Relevant characteristics include dispatchability,
intermittency, predictability, min and max operating levels,
ramping speed, ability to operate on automatic control for
ancillary services.
The grid operator uses ancillary services provided by other
generators and demand resources to integrate generation.
Some representative renewables integration costs (per
WECC):
Wind -- $5/MWh
Photovoltaic -- $2.50/MWh
Solar thermal -- $2.50/Mwh 425) PLANNING THE SYSTEM
TASKS IN PLANNING AND BUILDING A T LINE
Project planning and
control
Licensing and
environmental
Conceptual engineering
Detailed design
Material procurement
Construction contracts
Construction management
Engineering completion
43LONG-TERM – PLANNING THE SYSTEM
NERC estimates that U.S. summer peak demand
could grow from 772 GW in 2010 to 870 GW by 2019
(1.34% annual growth rate).
Annual net energy to grow from 3,970 GWh to
4,613 GWH (1.57% /yr)
Future resources (demand and supply) are expected
to grow by approximately 100,000 MW from 2010 to
2019.
131,000 MW planned capacity, about 85%
available on-peak in 2019.
44SOME UNCERTAINTIES FOR 2019
Load
Generation
45
NERC 2010 LTRAPLANNING CHALLENGES
How do you build transmission when you don’t know:
What will load be?
Where will load be?
To what degree will load be fixed and non-negotiable, versus
dispatchable (controllable DR) or influenceable (rate-driven DR)?
What generation will be available?
Technologies and fuels?
Operating range and flexibility -- baseload v. intermediate v.
peaker; ramping speed; heat rate?
Wholly predictable and dispatchable (fossil plants, nuclear,
geothermal, energy storage) or intermittent and variable with less
predictability?
Fuel costs?
Generation locations?
Retirement of existing plants due to economics of fuel costs, heat
rates or environmental regulation?
Planning goals
Maintain or improve grid reliability
Connecting desired energy sources (renewables? low carbon?)
Foster an efficient electric system and market 46Regional Planning Process
RTO/ISO planning encompasses the regional footprint;
stakeholders can provide input and advocate positions
throughout the process
Project is submitted to RTO/ISO for modeling to evaluate the impact on
the regional system, including costs and benefits
If the data shows the project is beneficial based on the RTO/ISO’s
established criteria, it is approved
Approved projects are eligible for cost recovery according to the RTO/ISOs
methodology
Projects may proceed outside the planning process but no cost recovery
through RTO/ISO will be available 47NEW LONG-TERM PLANNING EFFORT
DOE Interconnection-wide Long-term Planning grants under
2009 ARRA
Stimulus Act set aside $80 million for long-term (20-year)
interconnection-wide transmission planning
$60 million for Eastern, Western and ERCOT interconnection
work by technical analysis teams informed by stakeholder
groups
$20 million for related technical studies and support by
national labs
Development of complex scenarios and sensitivity cases for
future grid development paths reflecting alternate societal,
policy, fuel cost and technology possibilities
Use of economic and engineering models to simulate power
plant development, grid operations and costs over the 20-
year horizon for each scenario and sensitivity case
With analytical results, stakeholders and planners can
better understand dominant policy and economic drivers
and consequences and design a more robust, reliable and
economic power system. 48
Full results in 2013; work to be continued thereafterWHAT WE CAN LEARN FROM SCENARIO
ANALYSIS (THINK GENERAL, NOT SPECIFIC)
49
MISO Transmission Expansion Plan 2010CHALLENGES FOR NEW TRANSMISSION
Planning – what do we build, and when?
Which generation resources do we want to develop, and
where?
What’s the best timing to get new generation and
transmission?
What types of transmission are flexible and cost-
effective in the face policy, economic, societal and
technology uncertainties?
Cost allocation and recovery – who’s going to build it and
who’s going to pay for it?
Who bears the costs and who gets the benefits of
generation and transmission development?
Siting and routing – where do we put new generation and
transmission, and how do we resolve it faster and cleaner?
Clear, unambiguous, long-term regional or national
policies are necessary to establish certainty for major
transmission investment and to move projects from plans 50
into reality.TRANSMISSION DELAYS
NERC reports that a majority of new transmission
projects are reporting delays of up to 3 years from
permitting, siting, litigation, and other causes.
Permitting time for a major transmission line has
doubled from 3-4 years to 10 years or more
(particularly for environmental and land use reviews
and approvals)
See NEMA’s “Transmission Chutes and Ladders” at
http://www.wiresgroup.com/images/NEMA_on_Siting_Trans_Corridors_Fall_2010.pd
f
516) CLOSING THOUGHTS
It’s difficult to build transmission, and it isn’t getting any easier.
Delays
Uncertainty
Grid operation becomes harder as generation characteristics
change
Load’s growing and generation’s growing but transmission
isn’t keeping up, so maintaining reliability gets harder.
There are alternatives to transmission, but they don’t have the
same regional-scale impacts as transmission and are not always
easier
Non-wires solutions like efficiency, demand response, energy
storage and distributed generation
Local generation near loads
Grid modernization (transmission and distribution
automation, power electronics, synchrophasor technology,
voltage management devices, reconductoring)
Possibilities
New interstate EHV (765kV and up) and HVDC backbone
More classic transmission 52
More outages and higher energy costsTHANKS FOR THE HELP!
Miles Keogh, NARUC
Ivy Butts, NARUC
Don Mundy, Black & Veatch
Jeff Fleeman, AEP
Jeff Hein, NREL
53ADDITIONAL BACKGROUND
EHV voltage comparisons
Line losses
Transmission services
54EHV TRANSMISSION COMPARISON
TRANSMISSION CAPITAL COST BY VOLTAGE

                                                        56
       Table from WREZ Model Methodology Report, 2010
SUBSTATION CAPITAL COSTS
57
Table from WREZ Model Methodology report, 2010 5
7TRANSMISSION LINE LOSSES
If 100 MWh are generated at the power plant, on average
only 93 MWh of that energy gets through the transmission
and distribution system to the end user.
Average line losses = 1-2% for EHV transmission, 2-4%
overall lines and substations
Average line losses = 4-6% for distribution
Line losses at peak are higher – can be 10-15% due to
higher resistance and reactive power consumption
Delivered electricity cost after losses =
FUN FACT: Joule’s Law – energy losses are directly proportional to
the square of the current; higher voltages reduce current and thus
reduce resistive losses. Line losses are dissipated as heat; hot
conductors sag lower, which is why transmission lines have 58
thermal constraints.“TRANSMISSION SERVICES”
“Transmission service” encompasses a suite of functions (ancillary services)
provided by grid operators or generators, that are needed for grid reliability:
Scheduling – before-the-fact assignment of generation and transmission
resources to meet anticipated loads
Dispatch – real-time control of all generation and transmission resources to meet
load and maintain reliability
Regulation – automated control of on-line resources to respond rapidly to
operator requests for increased or decreased generation, to correct minute-to-
minute fluctuations by load and generation and maintain system frequency within
required range around 60 Hz. Also called frequency response. Can be provided by
some automated demand response and storage technologies.
Spinning reserve – extra capacity available by increasing the output of
generators already on-line. Like regulation service, but over longer periods (e.g.,
10-30 minutes). When called energy imbalance service, serves a financial
settlement function in clearing spot markets. Can be provided by demand
resources.
Replacement reserve – provided by off-line resources available within 30-60
minutes, that can be used to replace or supplement frequency control reserves to
restore system stability. May be called supplemental or non-spinning reserve
service. Can be provided by demand resources, imports, or curtailment of exports.
Voltage control – injection or absorption of reactive power to maintain
transmission system voltages within required ranges. Provided by generators or
transmission equipment like SVCs and capacitor banks.
Black start -- generators that can self-start without grid support
BEWARE – ancillary service names and definitions vary across balancing
authorities
59 and expertsTRANSMISSION SERVICES BY COST
60You can also read