Town of Tecumseh Shoreline Management Plan Update Coastal Flood Risk Assessment Public Information Centre #2 - April 20, 2021
←
→
Page content transcription
If your browser does not render page correctly, please read the page content below

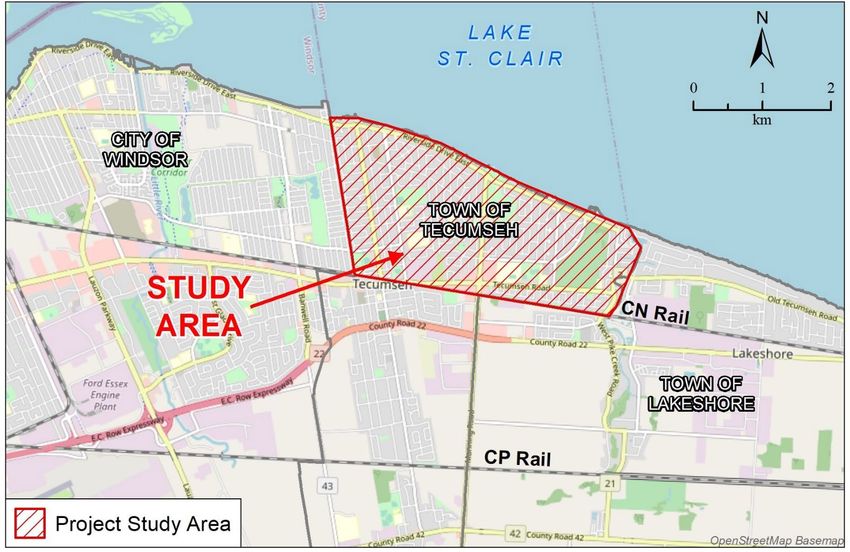
Town of Tecumseh
Shoreline Management Plan Update
 Coastal Flood Risk Assessment

   Public Information Centre #2
            April 20, 2021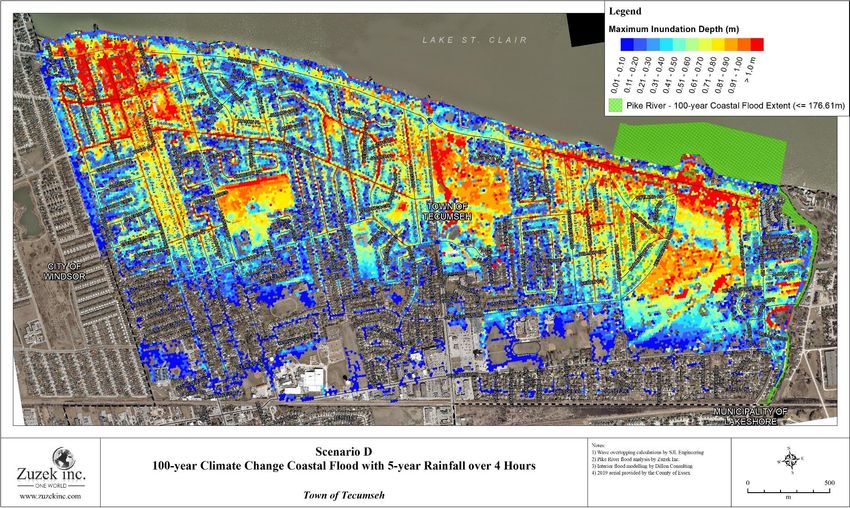
Study Area

             2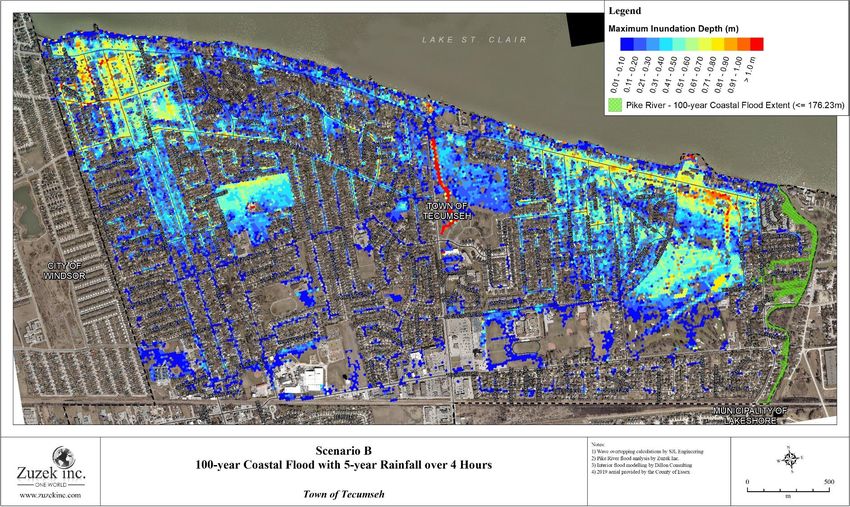
AGENDA FOR PIC#2 Meeting format, goals, and next steps Flood risk factors in Tecumseh Flood mapping and potential economic damages Options to reduce flood risk and damages Question and answer on the presentation Interactive discussion with the participants Next Steps 3
Public Information Centre Guidelines
All participants are muted and off video
The panelists will present the webinar and have their video on
During the feedback portion you can use the ‘Question and Answer’ button
found at the bottom of your screen
Open the Question and Answer Window
Type your question or comment in the window. Click send
Your question will be read to all participants by the facilitator and one of the
panelists will respond to the comment or question
4
Note: Check Send Anonymously if you don’t want your name attached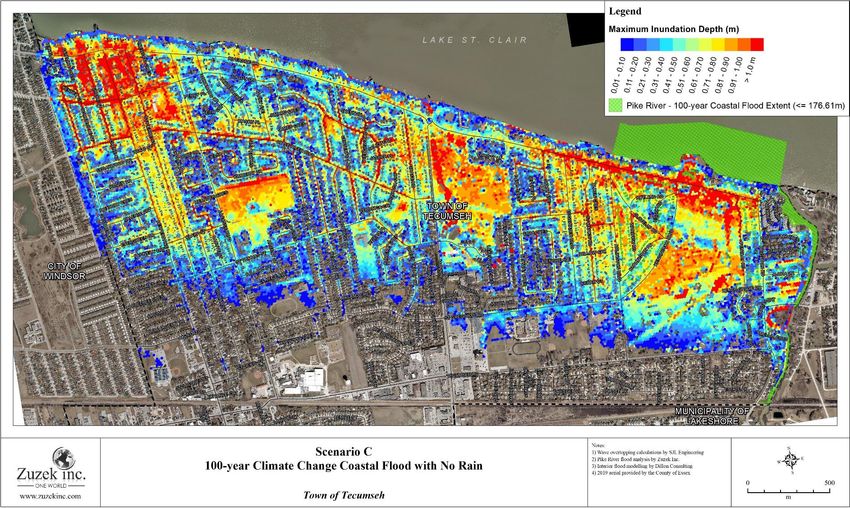
Public Information Centre (PIC) #2 GOALS Provide an update on the project and workplan Update on climate change impacts and rainfall/wave flooding events Share findings of the flood risk assessment and potential economic damages Provide preliminary information on flood mitigation strategies Gather feedback from the attendees about local conditions and evaluation criteria 5
LOOKING AHEAD FOR PIC#3
PIC#3: June-July 2021 (tbd)
Afternoon and evening sessions
Scope of meeting (partially based on feedback today):
Re-assess floodplain mapping with hypothetical mitigation projects
Review mitigation options to reduce flood risk and improve emergency access
Assess reduction in economic damages with mitigation projects
Feedback from the attendees
Draft report July 2021
6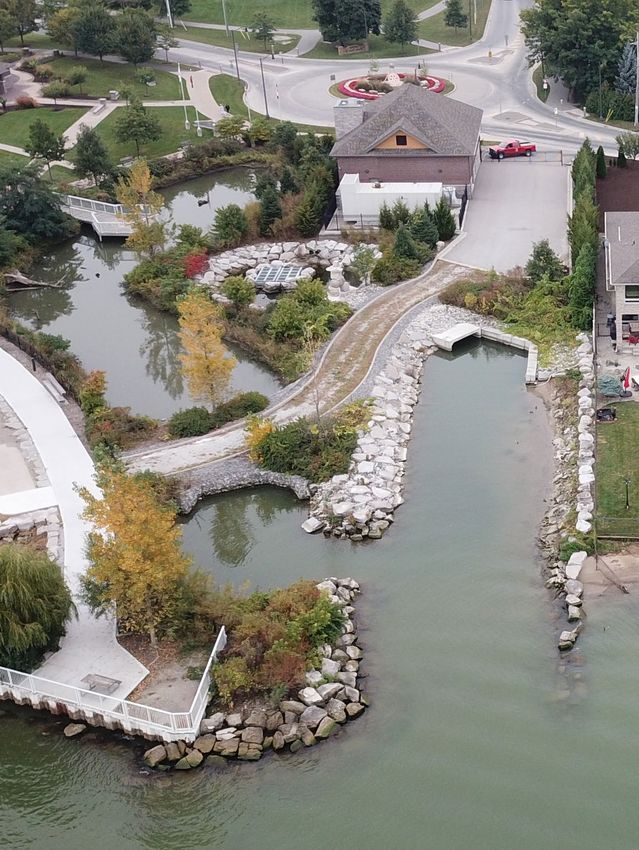
FLOOD RISK FACTORS IN TECUMSEH
1948 to 2016 Winter Air Temperature Increase
Projected Increase in Wave Energy due to
Reduced Ice Cover (Lake Erie example)
Climate Change projections suggest lake ice cover might completely disappear,
leading to winter wave energy increases of 100% (by late century/2080)
Flood and erosion risks increase in the winter
9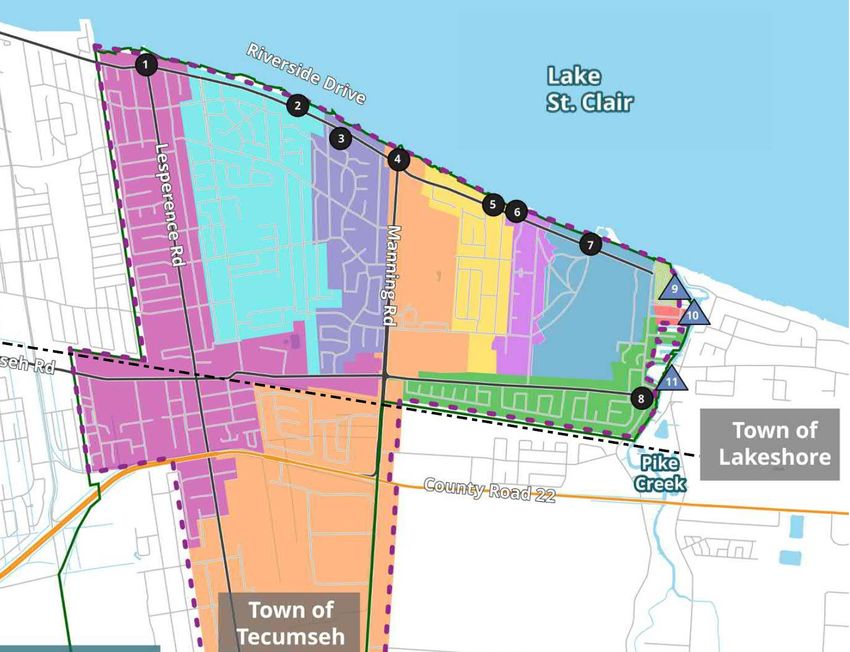
Historical Water Levels, 100-year Combined Flood
      Level, and 100-year Climate Change Flood Level

10
LAKE LEVEL
11
FORECASTCombined Rainfall and Coastal Flooding Events
(wave overtopping)
Leverage results from Dillon
(2019) for rainfall flood risk
Rain and wave events?
Windsor airport provided the
closest long-term record of wind
speed and rainfall data
Roughly 70% of the historical
coastal storm events featured
some rainfall
5-year 4-hour rainfall is 49.5mm
Storms with coastal flooding
and rainfall will be evaluated
12Shore Protection Database Shoreline protection database was assembled for the entire study shoreline Summary statistics: 13
Shore Protection Structure Condition is Good
   BUT CREST ELEVATION IS TOO LOW
Examples of Low Properties and Low Crest
     Elevations for Shore Protection (176.04 m wl)

15
Wave Overtopping Pushes Water over the Shore
Protection and onto Riverside Drive
16FLOOD PATHWAYS
In 2020 berms constructed in
known flood prone areas
17Road Elevation versus Flood Elevation 18
Road
Elevation
versus
Flood
Elevation

19
Road
Elevation
versus
Flood
Elevation

20
Saint Patrick’s Day Storm of 1973
Major coastal storm on March 17, 1973
Peak water level at Belle River reached +176.19 m IGLD85’
4 cm below predicted 100-year combined flood level
Mean Lake Level = +175.83 (50-year for March)
Storm Surge = 0.36 m (25-year)
Significant wave height event
St. Clair Beach Police Station
Riverside
21 Drive Tecumseh Road Arlington Blvd.Saint Patrick’s Day Storm - 1973
Water levels in 2019 peaked at +176.17 m IGLD85’ (July 20, 2019). Some
infrastructure has been updated since 1973
Only 2 cm less than the March 17, 1973 event
Why did we not see the same flooding? “4 feet of water on
Riverside Drive”
2019 water levels were a result of high mean lake levels Windsor Star
Did not have a concurrent major storm surge or wave event
No significant wave overtopping of the shoreline
We were lucky!
“Over 3,000 residents
evacuated from their homes”
Windsor StarFLOOD MAPPING AND POTENTIAL
ECONOMIC DAMAGES
2324
25
26
27
28
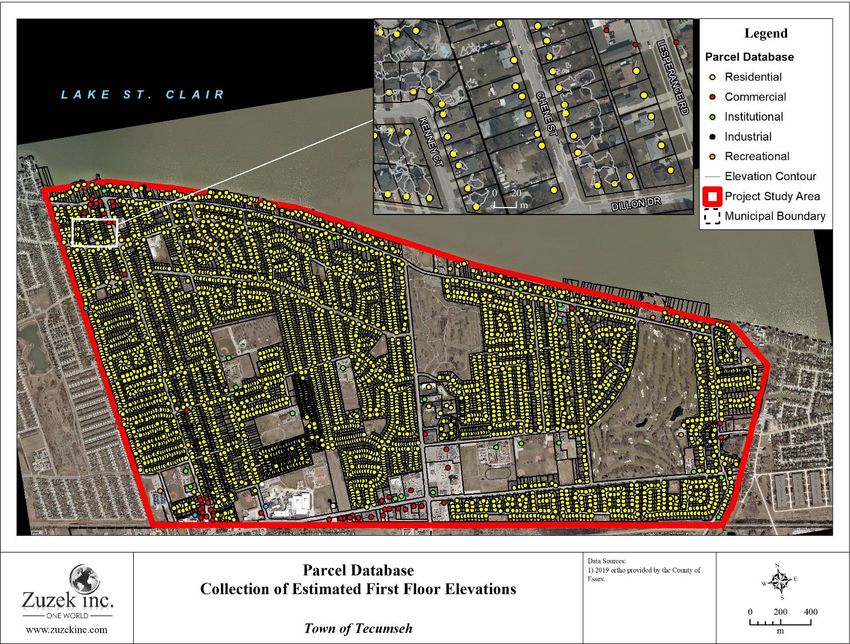
PROPERTY PARCEL

                  29
   DATABASE
Flood Damage Methodology (DRAFT) Property value based on current assessment value Building and content damages increase with the depth of flooding above the first floor (USACE methodology in graphics below) Potential for basement flooding ongoing (no damage estimate yet) 30
Estimated Economic Damages
for Flood Scenarios (DRAFT)
Damages for Commercial (18), Institutional (1), Industrial (10), and
Recreational (1) buildings ongoing but not included in the estimates below
Basement flooding damage calculations ongoing (only estimates below)*
Wet Exterior *Potential Residential
First Floor
Flood Scenario Basement Basement Structure and
Flooded
Foundation Damage Content Damage
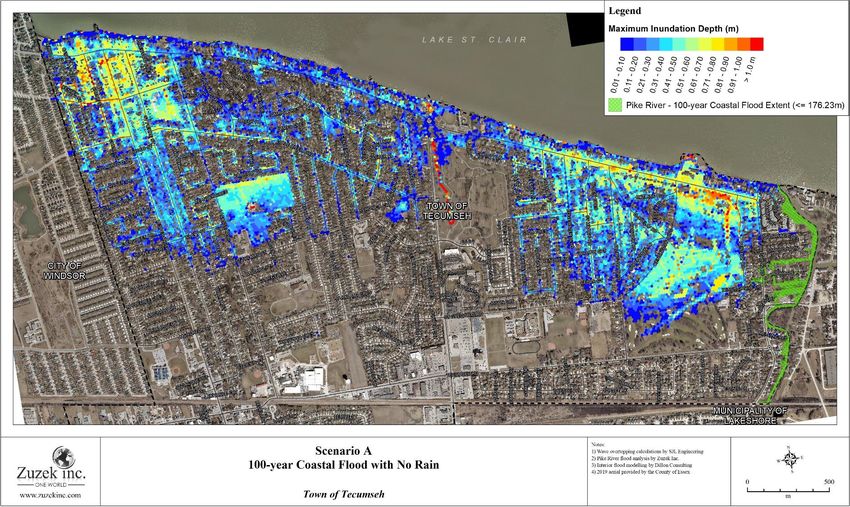
A – 100-year Coastal Flood no Rain ~700 Calculation not 95 $12 to $20 million
complete. Could
B – 100-year Coastal Flood with 5-year exceed $20M
~700 (high uncertainty) 97 $12 to $20 million
Rainfall (49.5 mm)
C – 100-year Climate Change Coastal
~2,650 Calculation not 712 $92 to $138 million
Flood no Rain complete. Could
exceed $60M
D – 100-year Climate Change Coastal
~2,650 (high uncertainty) 715 $93 to $139 million
Flood with 5-year Rainfall (49.5 mm)
Calculation not
E – Urban Stress Test Rainfall (150 mm
~300 complete. Could 11 $2 to $3 million
rain)
31 with 5-year Coastal Flood exceed $7MADAPTATION CONCEPTS 32
Types of Climate Change Adaptation Strategies
Avoid: reduce exposure by ensuring new development doesn’t occur on
hazardous land (doesn’t help with legacy development)
Retreat / Re-Align: a strategic decision to relocate public and private assets
exposed to significant coastal hazards, or change existing land uses
Accommodate: an adaptive strategy that allows for continued occupation while
changes to human activities or infrastructure are made to reduce risk
Protect: a reactive strategy to protect people, property, and infrastructure.
Traditional approach and often the first considered
Avoid Retreat Accommodate Protect
33ACCOMMODATE
Flooding persists, but impacts of flooding are mitigated
Mitigated impacts can be economic (property, possessions, infrastructure, loss of
employment, etc.)
Mitigated impacts can also be related to human safety (emergency access, ability
to evacuate, etc.)ACCOMMODATE: Floodproof Floodproofing Homes: Backflow valves Foundation coating / covering Opening shields (doorways, windows) Raise homes
ACCOMMODATE: Stormwater Management
Upgrade stormwater management capacity
East Townline Drain Pump Station - BEFORE
East Townline Drain Pump Station - AFTER
East Townline Drain Pump Station - AFTERACCOMMODATE: Emergency Planning Specialized emergency vehicles Emergency preparedness and planning
PROTECT
Wave overtopping will occur for most of Tecumseh Shoreline during 100-year
event under existing conditions:
22% of shoreline infrastructure has less than 1 foot of freeboard
67% of shoreline infrastructure has less than 2 feet of freeboard
FreeboardPROTECT: Reduce wave overtopping, mitigate
flooding
Flooding can be mitigated through coastal flood protection
Coastal flood protection can be located offshore, along the shoreline, or onshore
Offshore Shoreline OnshorePROTECT: Offshore Flood Protection Offshore protection: Breakwaters Artificial reefs
PROTECT: Shoreline Flood Protection

Increase crest elevation

Rock berm / cobble beach
PROTECT: Shoreline Flood Protection

Return / re-curved / parapet walls

Stepped Wall
PROTECT: Shoreline Flood Protection

Secondary seawall

Overtopping catchment
PROTECT: Shoreline Flood Protection

Improved drainage / venting
PROTECT: Onshore Flood Protection

Levees / flood berms
PROTECT: Onshore Flood Protection

Flood barriers

Raise land elevations & Improve overland drainage pathways
PROTECT: Other Considerations
Scour protection will mitigate erosion of the lakebed, which would result in deeper
water and larger waves
SCOUR PROTECTION
Changes to vertical walls may create additional surcharges
Additional structural elements for increase stability may be required (tie-backs, improved
drainage, etc.)PROTECT: Key Takeaways
Flood protection should be properly engineered based on an analysis of local
design conditions and performance objectives
Design standards should be implemented to ensure consistency
Although flood protection can be implemented lot by lot, community scale
solutions are preferred
Integrated approach
Ensure standards are followed to meet performance objectives and protect
investments
Piecewise (lot by lot) protection can lead to additional vulnerabilities and increased
risk for others if impacts are not thoroughly investigatedQUESTION AND ANSWER PERIOD
ON THE PRESENTATION
49INTERACTIVE DISCUSSION WITH THE
PARTICIPANTS
50QUESTION #1
From the first PIC, we learned your priorities for developing
infrastructure solutions to the flood risk in Tecumseh included:
- Long-term sustainable solutions (77% of respondents)
- Cost to landowners (69% of respondents)
- Cost the Town of Tecumseh (54% of respondents)
1. Based on what you learned today, should other priorities or
criteria be considered when developing solutions to
mitigate flood risk?
51QUESTION #2
2. Please share your ideas for short- and long-term options to
reduce coastal and interior flood risk.
52QUESTION #3 3. Emergency access for people and first responders may be limited on some roads during flooding events. In addition to the ongoing emergency response planning by the Town of Tecumseh, do you have any other suggestions on how to improve emergency access? 53
QUESTION #4

4.   For the Lakefront landowners, would you be willing to
     participate in a shoreline protection upgrade program that
     standardizes criteria and approaches for the Tecumseh
     lakefront? How should such a program be developed and
     implemented?

54
NEXT STEPS
• PIC#2 Comment Sheet
• Finalize technical work on flood mitigation alternatives
• PIC#3 June/July 2021 to include:
• Final Flood and Erosion Risk Assessment
• Draft Adaptation Concepts to reduce flood risk
• Final Report
55COMMENT SHEET
www.tecumseh.ca\shorelinemanagementplan
56You can also read