Towards regular drought status bulletins for irrigation systems in Central Asia using remote sensing - Christopher Conrad
←
→
Page content transcription
If your browser does not render page correctly, please read the page content below
Towards regular drought status
bulletins for irrigation systems
 in Central Asia using remote
            sensing
             Christopher Conrad
       Institute of Geosciences und Geography
              Department of Geoecolocy

           Schafft Wissen. Seit 1502.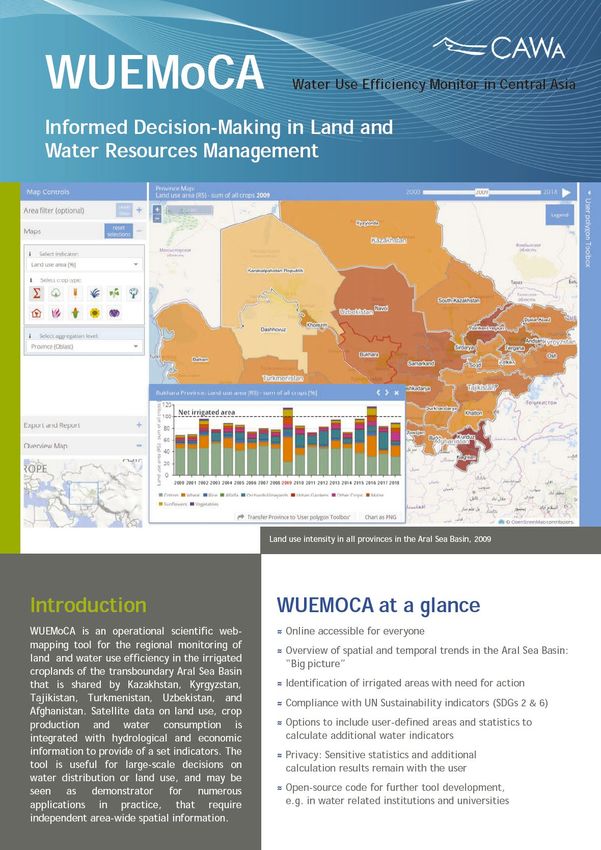
German Initiative
                                      Aim of ‘Green Central Asia’:                                    One goal of the Green
                                      - to develop a political dialogue and
                                      - consequently create better access to
                                                                                                      Central Asia Initiative
                                         information and data in order                                     is a Drought
                                      - to enable countries to assess the impact of                    Monitoring System
                                         climate change more accurately and
                                      - to develop cooperative preventive
                                                                                                       that helps to detect
                                         measures.                                                    and manage droughts
                                      Target group: foreign ministries and, through                     within a cropping
                                      them, the respective institutions responsible
                                      for climate and environmental resources,
                                                                                                      season in the Aral Sea
                                      including educational and research                                       Basin
                                      institutions                                                    - 2020/2021: Specification
                                      Target countries: Kazakhstan, the Kyrgyz                                   - 2021/2022:
                                                                                                        Foreign Minister Maas and his counterparts from Central

                                                                                                                   Implementation
                                                                                                        Asia and Afghanistan in Berlin, 28.01.2020, © Florian
                                      Republic, Tajikistan, Turkmenistan and                            Gaertner/photothek.net

     http://greencentralasia.org/en   Uzbekistan as well as Afghanistan.
17.06.2021                             [IDMP] Virtual Exchange - Drought Monitoring and Forecasting                                             2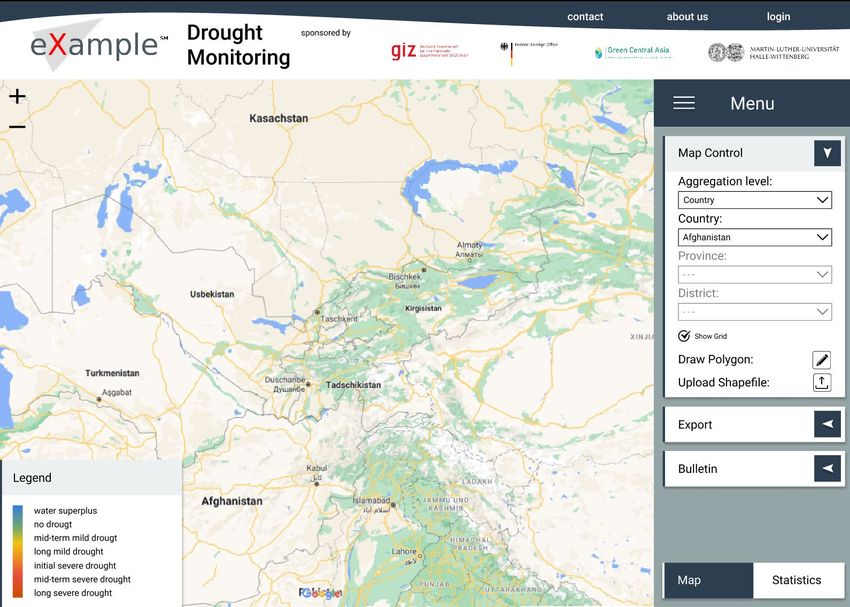
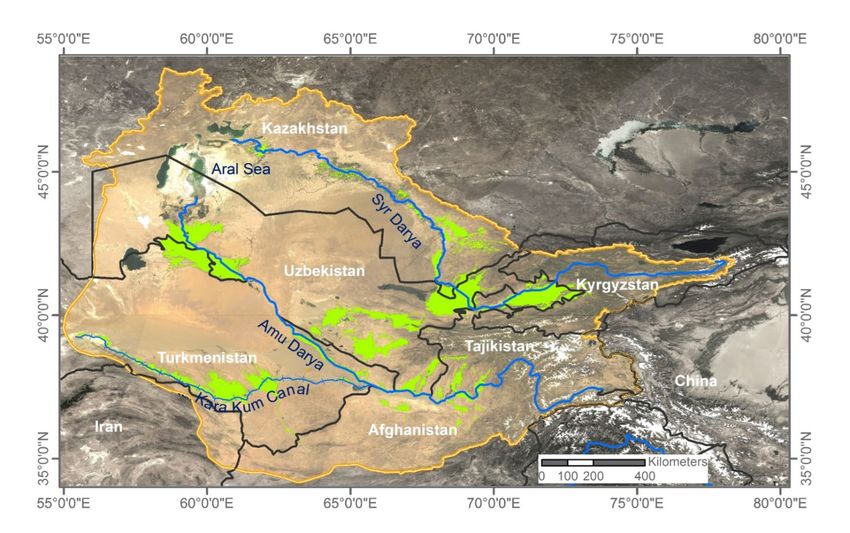
The Aral Sea Basin

                             Aralseeboden
                             Photo: Pool Filmverleih/lotus Film                                                                  Pamir: Abramovgletscher
                                                                                            Numerous Reservoirs                  Photo: K. Unger-Shayesteh

                             Baumwoll-, Reis-, und
                             Getreideproduktion

                                                                                                                                     Photos aus dem Archiv
                                                                                                                                             Quelle: Eigener Entwurf
                                                                                                                                     des Khorezm-Projekts
                17.06.2021                                        [IDMP] Virtual Exchange - Drought Monitoring and Forecasting                                         3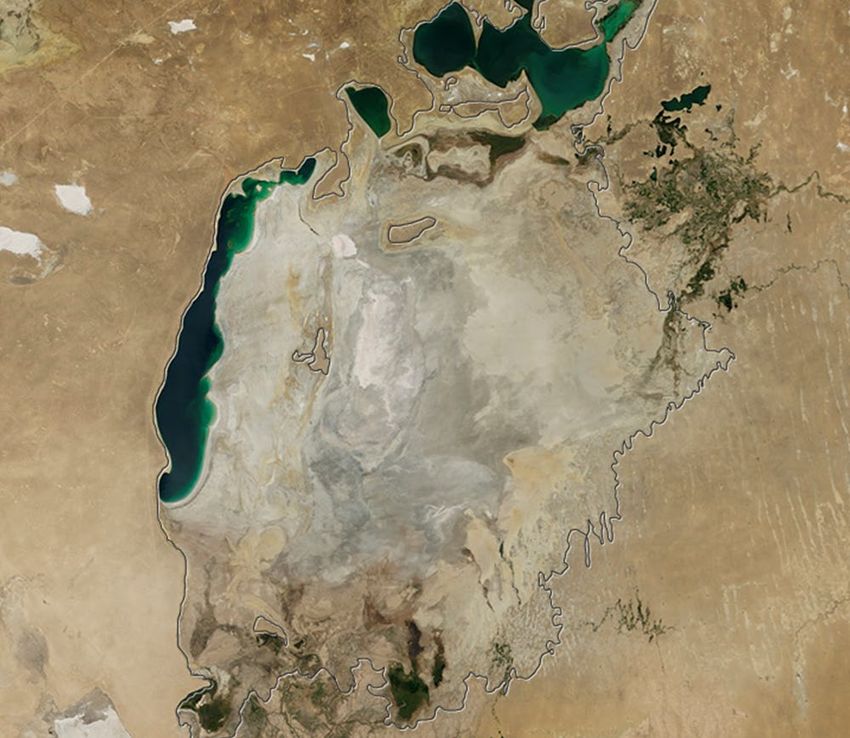
Water Use Efficiency Monitor for
Central Asia WUEMoCA
→ German Water Initiative in Central Asia 2009-2019
  (https://www.cawa-project.net/)
→ Decision-support tool for identifying irrigated areas of
  the Aral Sea Basin with need for action in water
  management (water scarcity, land degradation and
  abandonment)
→ Source of new data: Integrates satellite RS technology
  (MODIS), i.e. for land use mapping crop yield
  estimations and evapotranspiration modelling
→ Database for administrative boundaries, water
  distribution units, regular grid cells and user zones

https://wuemoca.geo.uni-halle.de/app/                                                           https://www.cawa-project.net/news-
                                                                                                detail/news/wuemoca-brochure-broshjura/
17.06.2021                                [IDMP] Virtual Exchange - Drought Monitoring and Forecasting                              4
Example: Detect unused (fallow) land

                                                                               Detect parts of the irrigated cropland in the Aral Sea
                                                                               Basin that is unused within one or more cropping
                                                                               years (fallow).
                                                                               Indicators: Temporarily unused irrigated land, fallow land
                                                                               frequency
                                            Own figure based on WUEMoCA data

                                                                               ⇒ Decisions about the use of unproductive land:
                                                                                 planting alternative crops (e.g. agroforestry),
                                                                                 abandon land, invest in irrigation and drainage
                                                                                 infrastructure, etc.

                                                                               The figures show the Amu Darya Delta. Dark and bright cells in raster
                                                                               refer to mainly unused and heavily irrigated areas, respectively.
                                                                               Top: Drought year 2008
                                                                               Down: Water rich year 2010
                                            Own figure based on WUEMoCA data

                               17.06.2021        [IDMP] Virtual Exchange - Drought Monitoring and Forecasting                                   5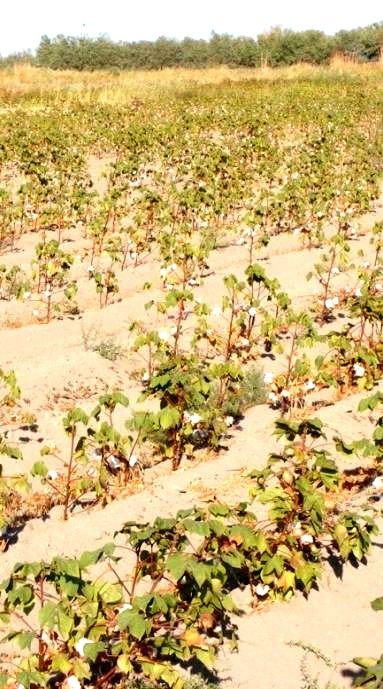
Who are the users? Scientific /
                                       administrative bodies that aim to
                                          prepare decision support and
  Specification                                        political dialogue

  phase for a                        National level: hydromet and other
                                                    services, universities
  drought monitoring
                                                 Regional l.: CAREC, IFAS
  system in the Aral
                                            International l.: WMO, GWP,
  Sea Basin
                                                UNCCD, UNDRR, IDMP …

                  What are the key                                           What are possible recommendations by the users in
                   requirements?                                             drought situations?
1. Detect droughts „in time“                                                 - Temporarily exclude fields from water supply
           (after two weeks)                                                 - Change water distribution/allocation
2. Describe droughts: Where,                                                 - Support of national planning (subsidies)
      how long, how strong?                                                  - ….

     17.06.2021                                     [IDMP] Virtual Exchange - Drought Monitoring and Forecasting                 6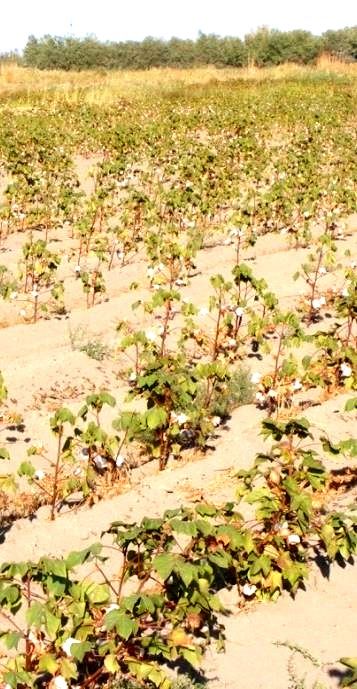
Scientific background: drought concept

                                                                          Indicators
                                                                          Reduced vegetation growth
                                                                          Reduced relative water consumption

 17.06.2021              [IDMP] Virtual Exchange - Drought Monitoring and Forecasting                          7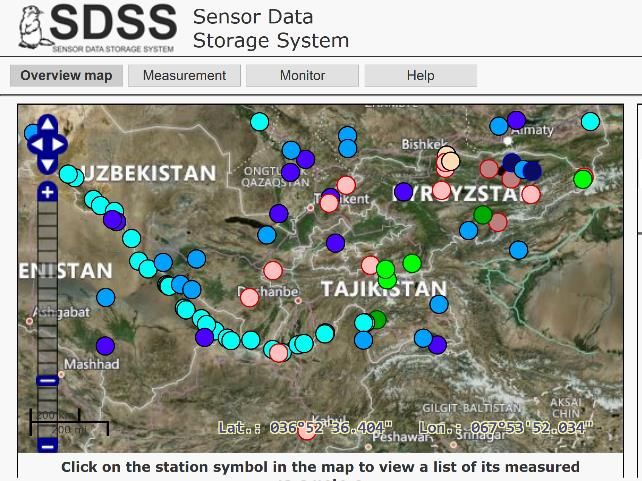
Scientific drought detection and monitoring
Indicators from satellite data

 Normalized Difference Vegetation Index (NDVI):
 Index values for greenness and density of vegetation,
 ratio of red to infrared radiation.
                                                                                              Indicators
                                                                                              Reduced vegetation growth
 Evaporative Stress Index (ESI): Ratio of actual
 evapotranspiration (AET) to potential ET (PET),                                              Reduced relative water consumption
 showing water use relative to demand, e.g., S-SEBI
 model.

 Combination of the indicators shows strength and
 duration of a drought.
 17.06.2021                                  [IDMP] Virtual Exchange - Drought Monitoring and Forecasting                          8
Scientific drought detection and monitoring
Indicators from satellite data

                                                                                           Indicators

                             ESI shows drought signal                                      Water consumption

                                                                                           Observation within
                                                                                           statistical
                                                                                           percentiles of the
 A combination of indicators and a measuring over                                          indicators during
 time indicates drought duration and severity.                                             the past 10 years
 17.06.2021                               [IDMP] Virtual Exchange - Drought Monitoring and Forecasting          9
0. DSI [t=k] = WL-ESI [t=k] + WL-
Ruleset for the analysis of the two indicators (NDVI, ESI, and DSI)                  NDVI [t=k]

Indikator   APR1     APR2      APR3      MAY1     MAY2   MAY3    JUN1      JUN2      1. Classification of Water surplus
 WL_ESI      0        -1        -1        -1        0     0        0         1       If WL_ESI >=1 Water surplus = 1
WL_NDVI      0         0        -1        -1        -1    -1       0         0

  DSI        0        -1        -2        -2        -1    -1       0         0
                                                                                        Water surplus
Duration     0         1         2        3         4     5        0         0
                                                                                          No drought
Sum(DSI)     0        -1        -3        -5        -6    -7       0         0

Severity     0        1        =1    = 0 => duration = 0, if DSI < 0 duration++       a) Severity Factor: 1.5 & b) Sum(DSI): Sum of DSI from start of
if duration < 1                 => „no drought“               drought
if 1 „long-term drought“   If Severity < 1 => „mild drought“                       10
                                                         If Severity >=1 => „severe drought“
Prototype of front end (variant 1):
Developed by informatics students of Uni Halle-Wittenberg
1. Get overview in a 5 k x 5 km raster
2. Analyse drought status and development in administrative
boundaries online with a dashboard of information (Map Control
=> Statistics)
3. Analyse own areas of interest (draw polygon, upload shapefile)
4. Export information to shapefile
5. Order Bulletin (biweekly, monthly, seasonal)
Map of Drought Situation: A combination of indicators and a
17.06.2021
measuring over time indicates drought duration and severity. 11Bulletin
1. Definitions used in the drought monitor
2. Maps (5 km * 5km grids with administrative boundaries of interest)
3. List areas with need for action
4. Tables and graphs
Water surplus
No drought
Initial mild Initial severe
drought drought
Mid-term mild Mid-term
drought severe drought
Long mild Long severe
drought drought
17.06.2021 12Conclusions
→ Scientific tools such as remote sensing technology can contribute
to identify, monitor and combat droughts
→ Steps towards a remote sensing based operational drought
montoring tool planned in GCA:
1. Specification (in agreement with potential users)
2. Implementation
3. Test and Application (with users)
4. Dissemination (policy dialogue)
→ Identify pathways to implementation and use of such
information requires collaboration among all stakeholders
17.06.2021 [IDMP] Virtual Exchange - Drought Monitoring and Forecasting 13Outlook:
Drought forecast system in the
irrigated Aral Sea Basin / Central Asia
1. Bring our partners and other stakeholders together:
national: hydromets, ministries for emergency
situations ..
Regional: CAREC, IFAS, …)
international (GWP, WMO, UNCCD, UNDRR, ICBA, …)
2. Define information demand/contribution of
http://sdss.caiag.kg/sdss/index.php
hydromets and other stakeholders
https://www.cawa-
3. Integrate scientific tools about water availability, project.net/fileadmin/cawa/00_home/Flyer_November17-
artificial reservoirs / management options and Webversion.pdf
water user system (MODSNOW, SDSS, WUEMoCA,
GCA drought monitor)
4. Present results on learning platform for different
users
=> Drought Management Center for Central Asia?
17.06.2021
Gafurov, A., Lüdtke, S., Unger-Shayesteh, K. et al. MODSNOW-Tool: an operational tool for
daily snow cover monitoring using MODIS data. Environ Earth Sci 75, 107814
[IDMP] Virtual Exchange - Drought Monitoring and Forecasting (2016).
https://doi.org/10.1007/s12665-016-5869-xTowards regular drought status
bulletins for irrigation systems
in Central Asia using remote
THANK YOU FOR YOUR ATTENTION!
sensing
Christopher Conrad
Institute of Geosciences und Geography
Department of Geoecolocy
Schafft Wissen. Seit 1502.
Representation of the University of Halle-Wittenberg in Almaty,
Dr. Peter Liebelt (peter.liebelt@geo.uni-halle.de)You can also read