To what extent does Airbnb affect house prices in Amsterdam?
←
→
Page content transcription
If your browser does not render page correctly, please read the page content below
To what extent does Airbnb affect house prices in Amsterdam?
                                                    Team 11
                                                   April 2021

1    Abstract
The impact of Airbnb has come under significant scrutiny and this short paper contributes to the literature by
looking at Airbnb’s effect on house prices in Amsterdam. The key issue is identification due to the likely presence
of unobserved confounding factors like tourism demand, which shift housing supply and demand in Amsterdam.
We employ Generalised Random Forests to estimate a local average partial effect that comes closest to a causal
effect of Airbnb on house prices. These results are compared to the benchmark of a panel data model with time-
and area-fixed-effects. The estimated average treatment effects show a nuanced picture of the causal effect of
Airbnb presence on local housing demand. Further distance to an Airbnb seems to increase house prices by
0.87% for each 100 meters. A 0.019% decrease in house prices per additional listing within 250 meters seems
to suggest a counterintuitive negative effect on local house prices (possibly due to negative externalities). The
spillover of Airbnb on neighbouring areas’ house prices may be positive, which requires further investigation.

                                                        1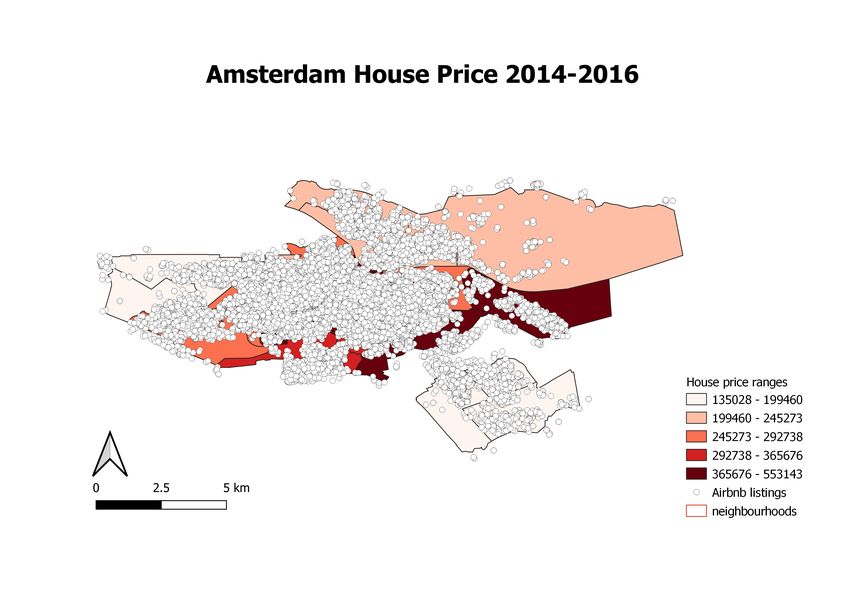
Contents
1 Abstract                                                                                                        1

2 Introduction                                                                                                    3

3 Channels                                                                                                        4

4 Data                                                                                                            6

5 Methodology                                                                                                     6

6 Analysis                                                                                                        8

7 Conclusion                                                                                                      11
  7.1 Policy Implications . . . . . . . . . . . . . . . . . . . . . . . . . . . . . . . . . . . . . . . . . . . . 11
  7.2 Further Research . . . . . . . . . . . . . . . . . . . . . . . . . . . . . . . . . . . . . . . . . . . . . 11

                                                         2
2     Introduction
A Brief background on Airbnb
Airbnb is part of the ’sharing economy’ and its motivation is to match short-term rental demand with un-
derutilized houses or spare rooms. Because of Airbnb’s review systems, potential renters can screen potential
landlords. The reduction in trust and quality assurance frictions should ensure a reduction in unused room
capacity and so an increase in economic efficiency. This also allows homeowners to rent out their property for
short periods of time and so access a direct income stream from their property which should, other things equal,
increase their house value.

The platform uses matching technology to reduce the search costs of users and facilitate smooth and safe trans-
actions with its review and reporting mechanism. Airbnb also opens up new areas to tourism with three-quarters
of its listings in neighbourhoods typically not covered by the traditional tourist industry. Meanwhile, it offers
an authentic and budget rental option for tourists and short-term visitors.

A Brief background on Airbnb in Amsterdam
Airbnb was first introduced in Amsterdam in 2008 and has grown rapidly since, with one in 15 dwellings in Am-
sterdam showing up on an online rental platform such as Airbnb in 2020 [1]. This growth has been accompanied
by sharp rises in house prices with house prices increasing 65% in the 5 years to 2018. This is not necessarily
causal.

A concern with Airbnb would be that it benefits non-resident tourists at the expense of residents, which is clearly
a public policy problem. This tension between residents and non-residents culminated in 75% of residents in 3
historic regions voting to ban home-rental although this ban was later overturned.

Channels through which Airbnb affects house prices
Prices are fundamentally the result of a supply and demand relationship which is often ignored in hedonic
pricing but it is this relationship that is key to understanding the channels through which Airbnb affects house
prices. From this relationship, we know that anything that affects supply or demand can affect the price. This
then gives us several clear potential channels as below. These are explored in more detail in the ’Channels’
section.

    1. A shift from long-term renting supply to short-term renting causing a reduction in long-term renting stock
       (supply).
    2. Airbnb can increase tourism who demand services that require land (supply).

    3. An increase in a house’s income stream which increases the house value (demand).
    4. An increase in the income/wealth of homeowners/other locals increasing ability to pay and so demand
       (demand).
    5. Negative (non-pecuniary) externalities imposed by Airbnb users on locals (demand).

It’s important to note that while some of these channels such as the externality channel will primarily be
a very localised phenomenon, other channels such as the wealth channel will have much more of a dispersed
effect across the Netherlands as landlords do not need to purchase property near their current property and a di-
versification of risk argument would suggest they may not want to focus their property portfolio in a single area.

Key potential issues
In general, treatment effect identification in a hedonic pricing regression, where the price is modelled as a
function of regressors, is challenging. As prices are the result of the equilibrium of supply and demand, any
variable that shifts supply or demand also shifts the price. Hence, all variables that would shift the demand or
supply equation and are correlated with the treatment effect must be conditioned on. Any of those variables
we don’t condition on would be unobserved confounders, which would cause bias in the treatment effect esti-
mator. Estimation of the causal effect of Airbnb on house prices faces all these challenges. The most obvious
confounder in Amsterdam’s short-time rental market is tourism demand. Short-term rentals and tourism are
close substitutes. As the demand for tourism increases, short-term rental demand increases accordingly (figure
1). The short-term rental rate increases just like its quantity.

By using time and location dummies we account for this issue.

                                                        3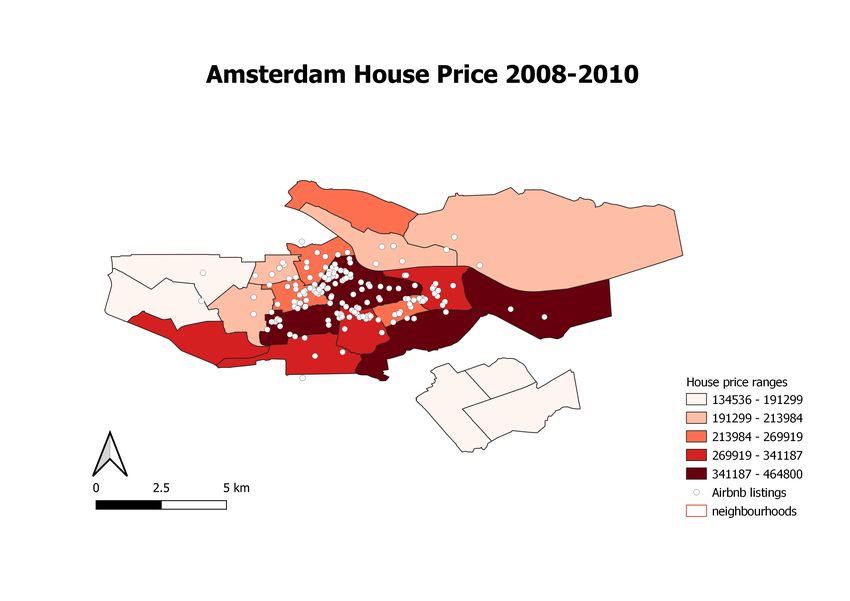
Figure 1: Short-term rental market with more tourism

                              P
                                                                  Supply original

                        ∗                                         Supply with Airbnb
                       PAT
                                                                  Demand with more tourism
                        P0∗
                        PA∗

                                                                  Demand original
                                                                  Q
                                            Q∗0   Q∗A      Q∗AT

Key findings
We initially use panel data methods which suggest that there is a positive effect of distance to the nearest
Airbnb on house prices and a negative effect of density of Airbnb’s on house prices.

The random forest we subsequently run supports this analysis and obtains predictions that are close to the
linear prediction. The random forest also finds that the predicted effect of Airbnb density on local house prices
varies widely across the set and so to give a single point estimate for the effect of Airbnb density on house prices
would be clearly incorrect. Rather, we have a heterogenous treatment effect with the effect depending on the
house’s specific characteristics.

We also consider the spatial evolution of house prices and the emergence of Airbnb listings across different
regions.

Other’s results
Barron et al [3] look to answer the same question but for the United States. They use instrumental variables
and conclude that on average a 1% increase in Airbnb listings increases rents by 0.018% and importantly house
prices by 0.026%. They conclude this is due to the reallocation of the housing stock by landlords and due to
the increase in a house’s earning potential.

Sheppard and Udell (2016) [6] examine the effect of Airbnb in New York with a hedonic pricing model and
find that a doubling of Airbnb listings is associated with a 6-11% increase in property prices. Other estima-
tion methods they consider produce even higher estimates; their difference-in-difference approach estimates the
Airbnb treatment (having an Airbnb listing within 300m) increases value by 31%.

As explained above, it appears the treatment effect is heterogeneous so to claim a single effect due to the presence
of Airbnb would be inappropriate. Meanwhile, our results do not seem to support these existing studies.

3    Channels
We consider two broad markets: the freehold market and the rental market. The rental market can be further
segmented into a short-term rental market mostly for tourists and a long-term rental market for local residents.
Hotels, for example, constitute a large part of the short-term rental supply. Short-term and long-term renters
have different demands and needs but they both draw from the (same) total housing stock. Traditionally seg-
mentation has existed on the supply side as well as the demand side because of these different needs and because
of different legal environments.

The rise of house-sharing is blurring this divide and enables owners of traditionally long-term rental properties
to target short-term renters [3]. Airbnb reduces frictions and costs of short-term rental for landlords. These
frictions include trust and quality assurance that traditionally would have made short term house rental very
difficult [4]. This friction reduction is likely to increase the marginal propensity of homeowners to reallocate
housing from the long-term to the short-term rental.

                                                           4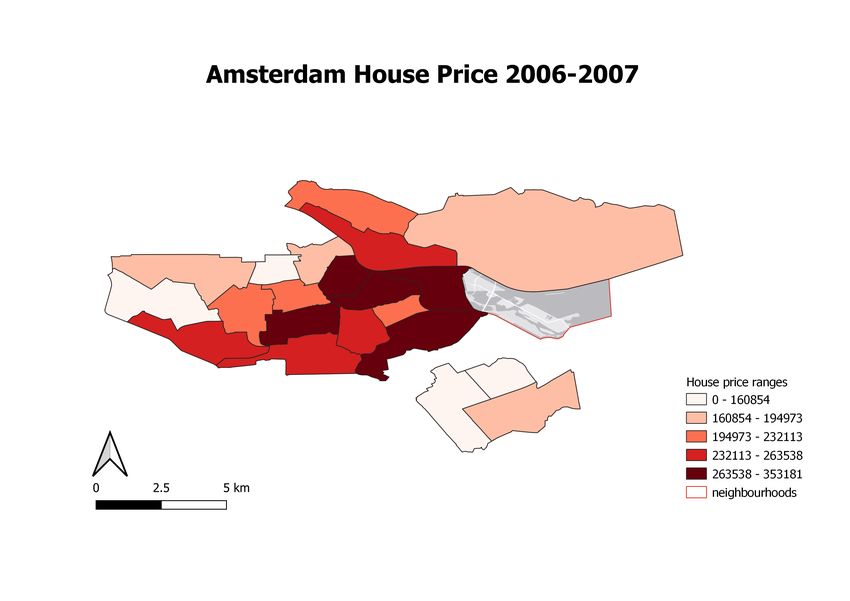
This cost reduction is reflected in an increased supply of short-term rentals at any rent in a perfectly competi-
tive market. In figure 2 we demonstrate this effect by flattening the supply curve for short-term rentals in the
quantity-price-space. The equilibrium price of short-term rentals decreases, while the quantity of short-term
rentals increases.

                                      Figure 2: short-term rental market

                                 P
                                                                  Supply original

                                                                  Supply with Airbnb

                           P0∗
                           PA∗

                                                                  Demand
                                                                  Q
                                           Q∗0   Q∗A

Because of the inelastic nature of the housing stock, this increase in short-term rentals can come from a re-
duction of long-term rentals, or a reduction in non-rented property. The short-term supply of rentals is nearly
inelastic so long-term rental supply has to decrease by approximately the increase in short-term rental supply.
Long-term rental supply decreases at every price as the cost of short-term rental decreases with the introduction
of Airbnb as demonstrated in figure 3. Local residents in long-term rentals will therefore need to pay a higher
equilibrium rental price, while the total quantity of long-term rentals is reduced. The marginal propensity of
homeowners to reallocate housing from the long- to the short-term rental market will determine the quantity
of replaced housing [3].

The consequences of these changes for the housing market (for purchases) are obvious.

The reduction in short-term renting costs increases the value of potential renting opportunities which increases
housing demand. The increase in wealth and income of landlords translates into a greater ability to finance
further property investment and so demand and so property prices.

The increase in tourists ushered in by Airbnb increases local economic activity and so local incomes and hous-
ing demand. These tourists require amenities and services which require land, increasing land demand and so
property prices.

Figure 4 demonstrates the increase in demand for housing due to Airbnb. As local housing supply is quite

                                      Figure 3: Long-term rental market

                                 P

                                                                  Supply with Airbnb

                           PA∗
                           P0∗                                    Supply original
                                                                  Demand
                                                                  Q
                                                  Q∗A       Q∗0

                                                        5
Figure 4: Housing market (for purchase)
P
Supply
PA∗
P0∗
Demand with Airbnb
Demand without Airbnb
Q
Q∗0 Q∗A
inelastic, the presence of Airbnb should result in an increase in house prices according to the channels covered
so far.
For this argument to not go through we would have to have strong negative externalities as a result of local
Airbnb’s. These externalities could include noise and congestion, can be very large and can outweigh Airbnb’s
other positive price effects, at least locally. As these externalities are highly local, Filippas and Horton argue
that while individual owners will oversupply the market, if the decision is left instead to building owners they
will internalise the externality and supply the efficient amount of house sharing [5].
4 Data
The analysis was undertaken using microdata on housing transaction covering the period from 2000-2018. This
was supplemented by data from http://insideairbnb.com/ which we used in the spatial analysis.
The dataset contains information on sales price, distance to nearest Airbnb listing and the number of Airbnb
listings within a 250 metres radius along with housing characteristics to use as control variates. There is known
measurement error within the Airbnb variables due to the fact that listing locations are only accurate within
100 metres.
Table 1 contains descriptive statistics for the key independent and dependent variables. We identified a number
of outliers, where for example the room size was ≥ 20 or 0, and these were removed.
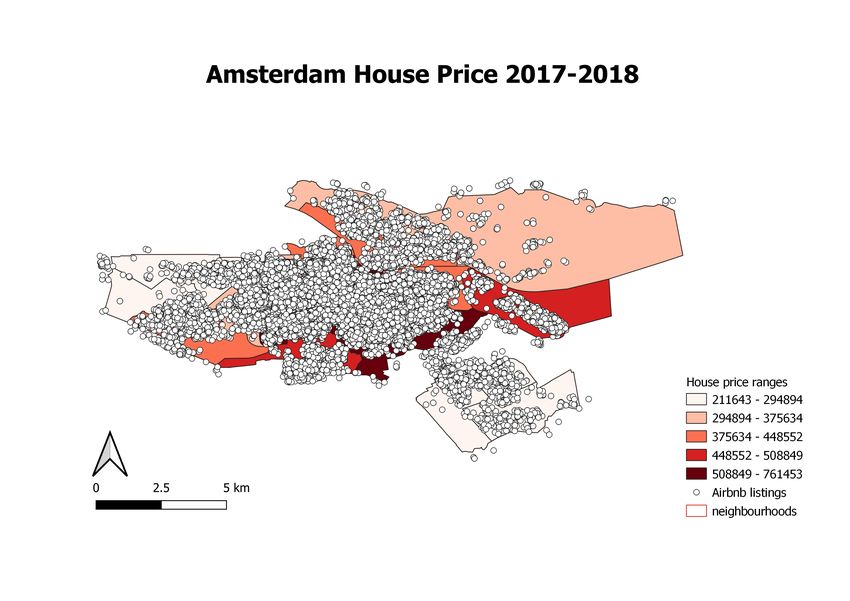
Figure 7 shows the evolution of house prices using a spatial heat map. To aid visualisation, we have grouped
the data into blocks of years. The figure shows the concentration of houses prices by neighbourhood. We have
then overlaid the average number of Airbnb listings by neighbourhood, this data is available from 2008 to 2018.
The Airbnb data highlights the increasing density of listings over time and the heterogeneity across local areas
and presents the possibility to determine local treatment effects.
5 Methodology
Our preferred methodology is Generalised Random Forests, following [2], a nonparametric statistical estimation
technique to determine local treatment effects. The local average partial effect of Airbnb presence Ai on housing
prices, θ(Xi ), comes closest to a causal effect of Airbnb on house prices. Our local estimating equation is defined
ψθ(X),ν(X) contains the local treatment effect θ(Xi ) as well as a nonparametric nuisance ν(.). It is a function
of the observed data, where Oi = {Pi , Ai , Xi }. Pi represents the observed house price, Ai the Airbnb presence
(which we either measure as distance to the closest Airbnb or Airbnb density) and Xi is the set of observed
covariates, which have been described in the Data section (excluding x- and y-coordinates).
6
Figure 5: House Price Heat Maps

              7
Table 1: Descriptive Statistics
Statistic N Mean St. Dev. Min Pctl(25) Pctl(75) Max
price 108,441 301,044 228,108 50,000 173,937 340,000 2,500,000
logprice 108,441 12.447 0.532 10.820 12.066 12.737 14.732
distance 108,441 274.718 882.637 0 0 78.3 8,843
density 108,441 44.000 90.553 0 0 37 685
rd x 108,441 120,923.900 3,157.516 112,296 118,920 122,991 132,341
rd y 108,441 486,087.900 2,494.155 477,021 484,880 487,611 493,073
construction period 108,441 4.195 2.694 1 2 7 9
garden 108,441 0.273 0.446 0 0 1 1
size 108,441 86.667 42.957 25 60 100 1,185
volume 108,441 246.021 142.040 55 162 284 4,740
rooms 108,441 3.248 1.387 0 2 4 103
wtype 108,441 −0.618 1.071 −1 −1 −1 5
parking 108,441 0.104 0.305 0 0 0 1
monumentalstatus 108,441 0.031 0.174 0 0 0 1
buyerpaysorfree 108,441 1.036 0.187 1 1 1 2
quality 108,441 14.395 1.766 2 14 14 18
E[ψθ(X),ν(X) (Oi )|Xi = x] = 0 (1)
Cov(Pi , Ai |Xi = x)
ψθ(X),ν(X) (Oi ) = θ(Xi ) − (2)
V ar(Ai |Xi = x)
Estimation of local moments (instead of global moments) helps us with identification. We estimate the model
fully nonparametrically but retain the asymptotic normality of the estimated treatment effects. We allow the
effect of Airbnb distance and density to be correlated with unobserved time-specific and area-specific charac-
teristics. The demand for tourism is a typical global confounder in this model. By allowing the random forest
algorithm to select any time dummies that matter (in the sense that they predict house price or Airbnb pres-
ence), we do not need to include global confounders of house prices, which are the same for all houses at one
point in time.
Instead of this flexible approach for local average partial effect estimation, we could have used a simple panel
model with location (4 digit zip code) fixed effects αi , time fixed effects ζt to obtain an average treatment effect
θ.
E[ψθ(X),ν(X) (Oit )|Xit , Ait ] = 0 (3)
Cov(Yit , Ait |Xit , αi , ζt )
ψθ(X),ν(X) (Oit ) = θ − (4)
V ar(Ait |Xit , αi , ζt )
This simpler identification strategy is our benchmark. We estimate the benchmark panel model with the
treatments Airbnb density and distance from 2008 onwards, as distance is available only since 2008. The
estimate the generalised random forest with treatment distance from 2008 onwards. We also estimate the panel
model only with treatment Airbnb density using the data going back to 2008 to see the pre-Airbnb time periods
can provide a different perspective on the causal effect of Airbnb (while we continue to condition on time and
4-digit zipcode dummies). A random forest with treatment Airbnb density is run on the same data going back
to 2000.
6 Analysis
Our preliminary results point to a nuanced effect of Airbnb on house prices. In all of our tables we condition
estimation on observed covariates described in the Data section (excluding x- and y-coordinates). In table 2,
the estimated average treatment effect is consistent across specifications. While further distance to an Airbnb
seems to increase house prices by 0.1-0.12% for each meter in distance, each additional Airbnb listing in a radius
within 250 meters of the transaction appears to decrease house prices by 2.9-3%. These results would allow the
8interpretation that locally the negative externalities of Airbnbs outweigh the benefits of the simpler rental to
tourists, leading to an overall decrease in local housing demand. Nonetheless, as some long-term housing gets
replaced by short-term housing, the global demand for housing may still increase significantly. In turn, house
prices would increase everywhere.
Table 2: Average treatment effect estimate ˆ for Airbnb distance and density with the panel model and data
since 2008
Dependent variable:
logprice
Pooled OLS AreaFE TimeFE Both
(1) (2) (3) (4)
∗∗∗ ∗∗∗ ∗∗∗
distance 0.0011 0.0010 0.0012 0.0012∗∗∗
(0.00001) (0.00001) (0.00001) (0.00001)
density −0.0299∗∗∗ −0.0291∗∗∗ −0.0289∗∗∗ −0.0292∗∗∗
(0.0005) (0.0054) (0.0052) (0.0052)
Observations 68,771 68,771 68,771 68,771
R2 0.7118 0.7398 0.7660 0.7663
∗ ∗∗ ∗∗∗
Note: pTable 4: Predicted local effect of density and distance on log home price in Amsterdam
Statistic N Mean St. Dev. Min Pctl(25) Pctl(75) Max
density 108,437 −0.00019 0.00056 −0.00281 −0.00057 0.00014 0.00641
distance 68,771 0.000025 0.000087 −0.000460 −0.000027 0.000068 0.000514
Figure 6: Random forest treatment effect estimate for density
Figure 7: Random Forest treatment effect estimate for distance
107 Conclusion
7.1 Policy Implications
Airbnb rental intuitively has positive and negative externalities, some of which are more concentrated such as
noise and some which are more dispersed including spending in the local area. As the presence of Airbnb doesn’t
appear to uniformly lead to an increase in house prices this suggests that there are indeed negative externalities
being imposed on the local area, reducing housing demand in certain areas.
When goods with negative externalities are supplied by individuals they tend to suffer from overconsumption.
The negative externalities associated with Airbnb to the local neighbourhood may point toward the need for a
local tax on such short-term accommodation. This local tax may be used to help facilitate more housing solutions
for those people displaced by the rise in short-term accommodation in affected neighbourhoods however, given
the potential positive externalities further cost/benefit analysis would need to be conducted before pursuing
such a strategy.
7.2 Further Research
The variables capturing the effect of Airbnb are subject to measurement error which means the local partial
effects estimated will be subject to attenuation bias and the true effects may be larger than those presented. It
may be possible to identify an instrumental variable for the density of Airbnb within the local area. This would
help address the issues associated with measurement error while also addressing the endogeneity challenges we
have sought to address using Fixed and Time Effects.
Further use could be made of the spatial data available. We investigated a preliminary high-level analysis using
Moran’ I: spatial correlation measure. The analysis, given the time constraints, was limited to the relationship
between house price and the number of Airbnb listing. The more limited number of house price transactions
in the period 2008-10 makes this form of simple analysis difficult and returned insignificant results over this
period. However, we found statistically significant results for later years and identified that the house price
correlation with first degree Queen neighbour is positive and that the strength of correlation increases over
time. Furthermore, that house price and Airbnb listing correlation between first degree Queen neighbours is
positive and the strength increases over time. However, the second degree relationship is negative with increasing
strength over time. An area for further research would be to include this form of neighbour relationships into
the main model we have outlined above
Because of the time constraints we haven’t been able to exploit the full benefits of using the Generalised Random
Forests approach. An area for further research will be to investigate the variable importance in the forest and
better understand the sources of heterogeneity in the treatment effect estimates.
11References
[1] Amsterdam to allow Airbnb rentals in city centre after court order. Mar. 2021. url: https://www.reuters.
com/article/us-netherlands-airbnb-amsterdam-idUSKBN2B81NS.
[2] Susan Athey, Julie Tibshirani, and Stefan Wager. “Generalized random forests”. eng. In: The Annals of
statistics 47.2 (2019), pp. 1179–1203.
[3] Kyle Barron, Edward Kung, and Davide Proserpio. “The effect of home-sharing on house prices and rents:
Evidence from Airbnb”. In: Marketing Science 40.1 (2021), pp. 23–47.
[4] Liran Einav, Chiara Farronato, and Jonathan Levin. “Peer-to-Peer Markets”. eng. In: Annual review of
economics 8.1 (2016), pp. 615–635. issn: 1941-1383.
[5] Apostolos Filippas and John Horton. “The Tragedy of your Upstairs Neighbors: Is the Negative Externality
of Airbnb Internalized?” In: June 2017, pp. 537–538. doi: 10.1145/3033274.3085097.
[6] Stephen Sheppard, Andrew Udell, et al. “Do Airbnb properties affect house prices”. In: Williams College
Department of Economics Working Papers 3.1 (2016), p. 43.
12You can also read