Thoughts for 2023 Fed Playbook
←
→
Page content transcription
If your browser does not render page correctly, please read the page content below
Newsletter

                                                                           January 2023

                Fed Playbook

   2022 Year in Review
            & Thoughts for 2023
 2022 Review
Weak Stock and Bond
Returns in 2022
Investors were riding high at the
end of 2021 given the very strong
returns of over 26% for the S&P 500
and a modest loss of less than -2% in
the Bloomberg US Aggregate bond
index. The broader stock indices
were near all-time highs and interest
rates were just beginning to lift
from the all-time lows set during
the pandemic. The good times did
not last long, however, as the stock
market peaked in the first week of
2022, which led to a very difficult
year.
We believe a primary driver of
negative stock and bond returns
during 2022 was the change in
policy by the Federal Reserve Board
(the Fed) from easing to tightening.
We call this the Fed Playbook and

                                        jen@gbafinancial.com          Rochester Station
                                        217.498.8575 | 855.778.8883   201 South Walnut Suite 300
                                        Fax: 217.498.9299             Rochester, IL 62563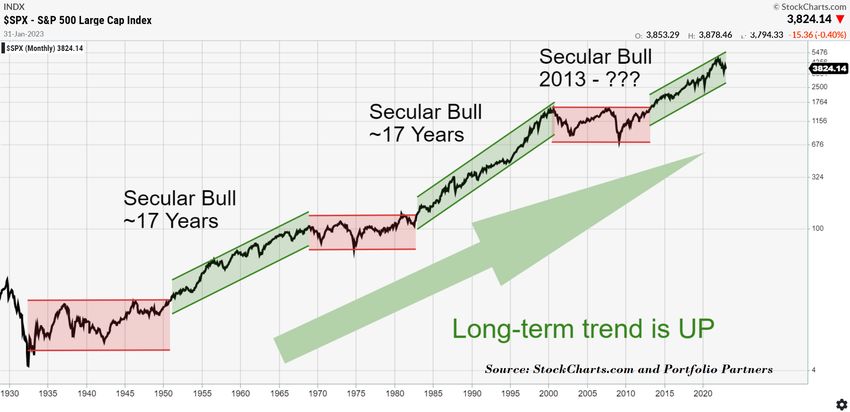
Newsletter
January 2023
2022 Review
will provide further details later in the newsletter. This tightening led to broad weakness across multiple
markets and asset classes. For the year, the S&P 500 declined -19.44%, the NASDAQ Composite dropped
-33.10%, the Russell 2000 lost -21.56% and the MSCI ACWI Ex-USA (international stocks) fell -18.30%.
US interest rates were a key detractor to bond returns as the yield on the 10-year US Treasury jumped from
1.51% last year to 3.88% at the end of 2022. Rising rates caused the broad-based Bloomberg US Aggregate
bond index to lose an unprecedented -13.01% for the year. As you can see on Chart 3 below, this is the
biggest loss for the bond index in at least the last 26 years. (CHART 1)
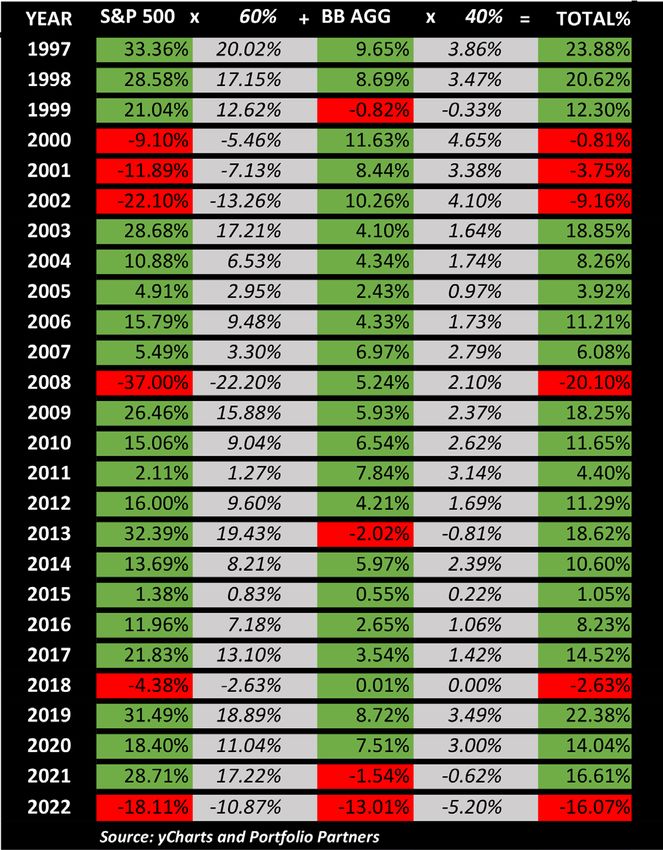
Bonds Fail to Support Stocks
Bonds have a strong history of supporting and improving longer-term returns compared to owning stocks
alone. According to research from Goldman Sachs Asset Management, a portfolio comprised of 60% S&P
500 index and 40% Bloomberg
Aggregate Bond index increased
the probability of achieving positive
returns on a 1-, 3-, 5- and 10-year
basis. (CHART 2)
Please notice that 15-year rolling
returns have been positive 100%
of the time for both the 60/40 This example does not reflect sales charges or other expenses that may be required for some
portfolio and the stock only investments. Rates of return will vary over time, particularly for long term investments.
portfolio. This tells us that bonds have consistently helped
improve returns on a shorter-term basis, while
maintaining the positive longer-term returns. In other
words, bonds help in the shorter term and don’t seem to
hurt the longer term.
Unfortunately, our collective consciousness largely resides
in the short term and, as we said, 2022 delivered the
biggest loss for the Bloomberg Aggregate Bond index in
at least the last 26 years. This led to a very disappointing
loss of -16.07% for a 60/40 portfolio. This is only second to
a loss of -20.10% experienced during the Great Financial
Crisis of 2008. Although this year has been difficult, we
continue to believe in the longer-term support that bonds
can provide alongside a portfolio of stocks. (CHART 3)
The Fed Playbook
As we stated above, we believe much of the negative
performance for stocks and bonds this year stemed from
a change in policy approach by the Fed. We call this policy
approach the “Fed Playbook” and it basically relates to
whether the Fed is accommodative or non-accommo-
dative to economic growth. We believe the Fed switched
playbooks in January 2022 from accommodation to
non-accommodation. This policy shift has led to higher
jen@gbafinancial.com Rochester Station
217.498.8575 | 855.778.8883 201 South Walnut Suite 300
Fax: 217.498.9299 Rochester, IL 62563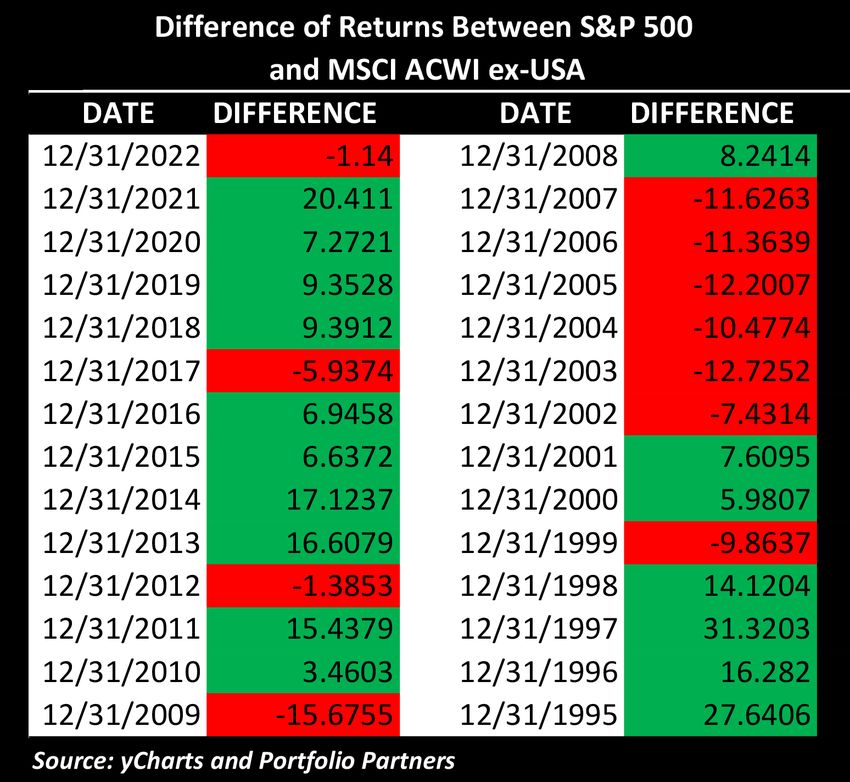
Newsletter

                                                                                               January 2023

 2022 Review

interest rates and lower stock market valuations.
While this transition has been painful to experience, we believe
the Fed is following its dual mandate directed by Congress. Re-
call from our Portfolio Partners September 2022 Newsletter that
the Fed was originally created by the Federal Reserve Act of 1913
primarily to serve as the lender of last resort. This changed with
the Humphrey-Hawkins Act of 1978, which created the “dual
mandate” to provide price stability and maximum sustainable
employment.
The Fed’s current mandate is to keep inflation around 2% and
unemployment around 4%. The Fed successfully achieved that
goal for the last 13 years or so as inflation stayed below 2% and
unemployment trended lower over the period to ultimately
reach 3.7% in November 2022.
The challenge of this mandate is that what is good for employ-
ment is eventually bad for inflation and vice versa. (CHART 4)
Our view is that the Fed Playbook has been pursuing an accommodative policy since the 2008 Great
Financial Crisis. This effort led to the realization of full employment with inflation mostly below 2%. This
changed in March 2021 when inflation crossed above 2% and reached 5% by the end of that year. One could
reasonably argue that the Fed was late switching playbooks by waiting until 2022 to raise rates. Suffice to
say, they have changed playbooks and that is what matters at this point.
We expect positive returns for stocks and bonds may be difficult to achieve until the market has sufficient
information to believe inflation is stabilizing and interest rates are no longer rising. It is important to note,
however, that we expect the market to bottom before we see rates peak. This is because the market is for-
ward looking, and buyers will likely begin showing up in anticipation of peak rate increases.

  Thoughts for 2023

Disinflation Could be the New Situation
One of the most important drivers of poor stock and bond performance during 2022 was high inflation, in
our opinion. Inflation
started rising modestly
in the summer of 2020
while most of us were
primarily focused on
understanding and
fighting the Coronavi-
rus. Prices continued
to rise and broke above
the Fed’s inflation tar-
get of 2% in March of
2021 and continued to
remain stubbornly high
since that time.
(CHART 5)

                                                       jen@gbafinancial.com               Rochester Station
                                                       217.498.8575 | 855.778.8883        201 South Walnut Suite 300
                                                       Fax: 217.498.9299                  Rochester, IL 62563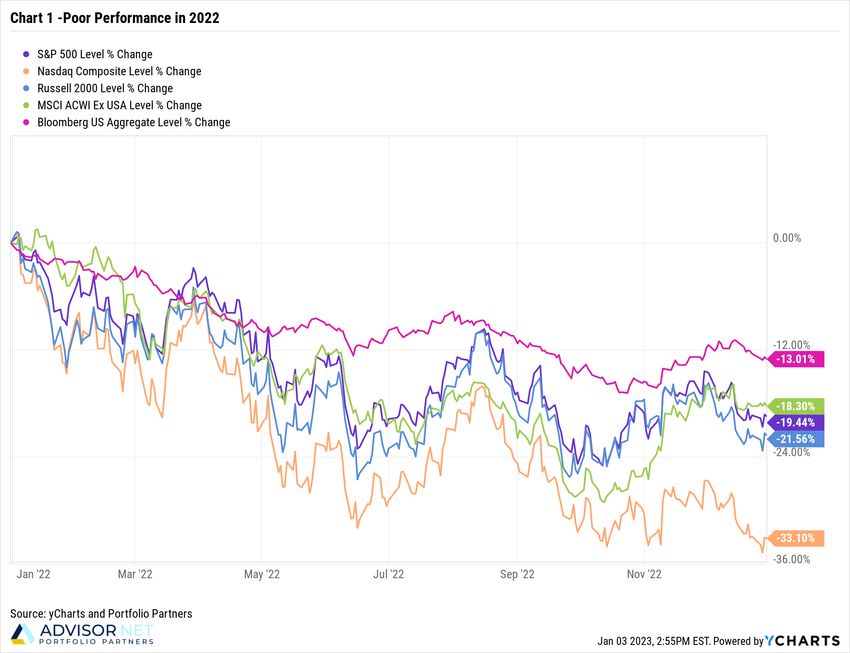
Newsletter

                                                                                              January 2023

  Thoughts for 2023

We believe that increased money supply (called M2) has been an important contributor to creating higher
inflation. The Fed’s measurement of money supply began increasing aggressively in March 2020 as the US
responded to the economic shutdown enacted in response to the pandemic. The growth of M2 peaked in
February 2021 at +26.9% and has steadily declined to +1.3% in October 2022. We think this reversion to more
normal levels of growth in M2 are a leading indicator of slowing inflation in the months ahead. (CHART 6)
Other hints that
inflation may be
peaking are de-
clining prices for
automobiles and
peaking home
prices. We think
this could lead
to disinflation
during 2023. Dis-
inflation is when
inflation increas-
es at a decreasing
rate and should
not be confused
with deflation
where the rate of change is negative. Periods of disinflation can lead to positive stock returns, but there will
likely be myriad factors at work in 2023 making it difficult to conclude that disinflation will lead to positive
stock returns in the short term. That said, it is a more constructive environment compared to rising rates of
inflation as we have experienced for the last 18+ months or so.
Car and truck prices began declining in July 2022 and have continued to decline for remainder of the year.
(CHART 7)

                                                      jen@gbafinancial.com              Rochester Station
                                                      217.498.8575 | 855.778.8883       201 South Walnut Suite 300
                                                      Fax: 217.498.9299                 Rochester, IL 62563
Newsletter

                                                                                           January 2023

  Thoughts for 2023

The rate of increase for national home prices appears to have peaked in March of 2022 and the rate of
change has continued to decline for much of the year. (CHART 8)

  SIDEBAR–A Real Look at Gasoline Prices
  Rising inflation has certainly taken a toll on consumers and financial markets during 2022. Perhaps the
  most talked about pain point, however, has been the rising price of gasoline at the pumps. Although
  gasoline prices have steadily increased since the lows of the pandemic in April 2020, the Russian
  invasion of Ukraine early in the year helped lead to an immediate and significant rise in prices that
  was felt dearly by US consumers.
  Despite continued conflict by Russia in Ukraine, gasoline prices peaked in mid-June of 2022 and have
  steadily declined since that time. We think declining gasoline prices, along with auto and home prices,
  may be providing a hint to slowing inflation (or disinflation) in the coming months. We believe this will
  be a welcome reprieve for consumers and possibly for the markets. The critical question is whether the
  declining prices are a result of improving oil supplies or expectations for a slowing economy. We will be
  watching this situation closely.

                                                    jen@gbafinancial.com              Rochester Station
                                                    217.498.8575 | 855.778.8883       201 South Walnut Suite 300
                                                    Fax: 217.498.9299                 Rochester, IL 62563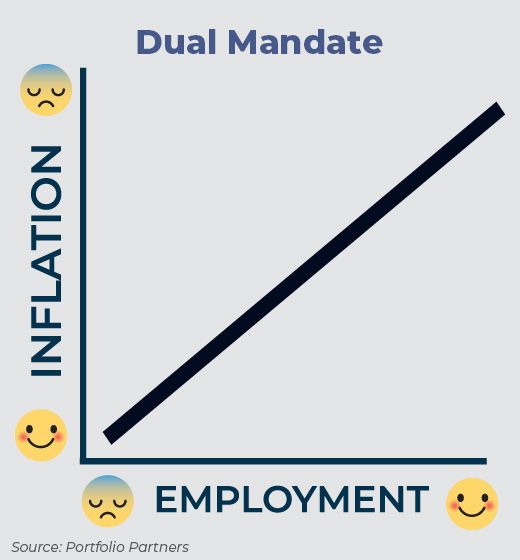
Newsletter

                                                                                                     January 2023

  Thoughts for 2023

International Was Less Bad
The US stock market delivered
disappointing returns in 2022 with a
-19.44% loss for the S&P 500, but the
international markets performed modestly
better with a loss of “only” -18.30% for the
MSCI ACWI ex-USA. This marks the first
time since 2017 and only the second time
in ten years that the MSCI ACWI ex-USA
index performed better than the S&P 500.
The S&P 500 has outperformed the
MSCI ACWI ex-USA index 17 of the last
28 years, or 61% of the time. This has led
many investors to question the utility
of including international as a strategic
allocation in a diversified portfolio. We
think a better question is HOW MUCH
international should be included, not IF
international should be included. The MSCI
ACWI ex-USA outperformed the S&P 500
by an average of 9.2% from 2002 through
2009 and provides a good reminder of
                                               This example does not reflect sales charges or other expenses that may be
the longer-term benefits of including
                                               required for some investments. Rates of return will vary over time,
international. (CHART 9)                       particularly for long term investments.
According to industry research, the US market accounts for about 60% of the investable global market
capitalization. This means that around 40% of the investable global market capitalization is in international
markets. We currently have a strategic allocation for international of around 30% in our models but believe
there may be an opportunity for a tactical approach that could enhance our current process. Expect to hear
more about this in 2023.

Respect the Downtrend, but Open to Possibility
We have consistently repeated our encouragement to “Respect the Downtrend” during 2022. The core of
this message remains true today: respect the downtrend and remain relatively defensive. We have, however,
enhanced our message the last few months as we have observed bourgeoning positive economic clues. We
have simply added the request to be open to possibility.
We continue to position our portfolios relatively defensively due to the aforementioned downtrend, but
we have been creating our plan to move that toward offense as more improvement is observed. The main
driver of the market discontent, in our opinion, has been inflation and interest rates. We believe the stock
and bond markets will bottom before it is obvious that inflation and rates have peaked. Our plan is to make
incremental moves in the portfolio as improvements unfold.

                                                      jen@gbafinancial.com                     Rochester Station
                                                      217.498.8575 | 855.778.8883              201 South Walnut Suite 300
                                                      Fax: 217.498.9299                        Rochester, IL 62563
Newsletter
January 2023
Thoughts for 2023
From Fed to Earnings
We have stated several times that we believe the primary driver of the negative performance for stocks and
bonds has been rising inflation and the corresponding increase in rates. We have described this as a change
in the “Fed Playbook” and has been a major consideration in our market analysis during 2022.
We think it is possible that the market focus shifts in 2023 from the Fed (and inflation) to corporate
earnings. As we stated above, the Fed has shifted from accommodating full employment to fighting
inflation. This will most likely lead to some level of economic slowdown in the coming months, which
should eventually lead to reduced corporate earnings.
Many are calling for a recession around the midpoint of 2023, but we will eschew making that prediction
because we are already positioned relatively defensively. History has shown that economic recessions tend
to occur closer to market lows than highs; therefore, we will be looking for signs of improvement to catalyze
our next moves. (CHART 10)
jen@gbafinancial.com Rochester Station
217.498.8575 | 855.778.8883 201 South Walnut Suite 300
Fax: 217.498.9299 Rochester, IL 62563Newsletter
January 2023
Thoughts for 2023
Longer-term Perspective
While we do not encourage (or practice) complacency regarding portfolio management, we believe it is
wise to provide a historical context around time frames and returns. A simple axiom is that the longer you
stay invested, the higher probability for positive returns. To wit, the S&P 500 delivered positive returns 100%
of the time for every 15-year rolling period from January 1969 to September 2022. (CHART 11)
jen@gbafinancial.com Rochester Station
217.498.8575 | 855.778.8883 201 South Walnut Suite 300
Fax: 217.498.9299 Rochester, IL 62563Newsletter
January 2023
Thoughts for 2023
We can also study a long-term price chart for the S&P 500 to see that secular bull markets can last from 15
to 20 years. The last two secular bull markets lasted about 17 years each. We believe a secular bull market
started around 2013 and has the potential to continue for another five to seven years. Time will tell if the
2022 drawdown is simply a pause in the secular bull market or the start of a new secular bear market.
We continue to be positioned relatively defensively but remain open to the possibility of an eventual
resumption of the secular bull market. (CHART 12)
We also like this ~100-year price chart because it illustrates the positive longer-term bias towards positive
returns for the S&P 500. In other words: we can make it in the long run!
MARKET TRACKER – 12/31/2022 MARKET TRACKER – 12/31/2022
S&P 500................................................... 3,839.50
INDEX 3 mo 1 yr 3 yr 5 yr
DIJA............................................................ 33,147.25
NASDAQ ................................................ 10,466.48
S&P 500 7. 5 6% -1 8 . 32 % 7.7 7 % 9.42 %
MSCI ACWI ex-USA 1 4 . 8 2 % -1 5 . 24% 0.42 % 1. 32 % WTI CRUDE OIL................................. $80.26 /BARREL
B LO OMBE RG GOLD ....................................................... $1,819.70 /OUNCE
US AGGREGATE 1.87% -1 2 . 8 8% -2 .74% 0.02 % 10-YEAR TREASURY FIELD......... 3.88%
UNEMPLOYMENT............................ 3.70%
(Source: yCharts and Portfolio Partners) GDP............................................................ 2.20%
PPI.............................................................. 7.40%
CORE CPE (INFLATION)............... 4.68%
Thank you for your trust and support. (Source: yCharts, Dorsey Wright and Portfolio Partners)
Stay focused on your long-term objectives.
jen@gbafinancial.com Rochester Station
217.498.8575 | 855.778.8883 201 South Walnut Suite 300
Fax: 217.498.9299 Rochester, IL 62563Newsletter
January 2023
The index, a member of the Dow Jones Total Stock Market Indices family, is designed to measure the performance of large-cap U.S. equity
securities that are classified as “growth” based on a multi-factor analysis.
The index, a member of the Dow Jones Total Stock Market Indices family, is designed to measure the performance of small-cap U.S. equity
securities.
The index, a member of the Dow Jones Total Stock Market Indices family, is designed to measure the performance of large-cap U.S. equity
securities that are classified as “value” based on a multi-factor analysis.
The index, a member of the Dow Jones Total Stock Market Indices family, is designed to measure the performance of small-cap U.S. equity
securities.
The S&P 500® Information Technology comprises those companies included in the S&P 500 that are classified as members of the GICS®
information technology sector.
The S&P 500® Health Care comprises those companies included in the S&P 500 that are classified as members of the GICS® health care
sector.
The S&P 500® Consumer Discretionary comprises those companies included in the S&P 500 that are classified as members of the GICS®
consumer discretionary sector.
The S&P 500® Utilities comprises those companies included in the S&P 500 that are classified as members of the GICS® utilities sector.
The S&P 500® Communication Services comprises those companies included in the S&P 500 that are classified as members of the GICS®
communication services sector.
The S&P 500® Real Estate comprises stocks included in the S&P 500 that are classified as members of the GICS® real estate sector.
The S&P 500® is widely regarded as the best single gauge of large-cap U.S. equities. The index includes 500 leading companies and captures
approximately 80% coverage of available market capitalization.
The S&P 500® Consumer Staples comprises those companies included in the S&P 500 that are classified as members of the GICS® consumer
staples sector.
The S&P 500® Materials comprises those companies included in the S&P 500 that are classified as members of the GICS® materials sector.
The S&P 500® Industrials comprises those companies included in the S&P 500 that are classified as members of the GICS® industrials sector.
The S&P 500® Financials comprises those companies included in the S&P 500 that are classified as members of the GICS® financials sector.
The S&P 500® Energy comprises those companies included in the S&P 500 that are classified as members of the GICS® energy sector.
This is not an offer to buy or sell any financial instruments and should not be relied upon as the sole factor in an investment-making decision.
Opinions expressed are not intended as specific investment advice or to predict future performance. This information is not intended as
investment or tax advice.
Registered Representative offering securities and advisory services through Cetera Advisor Networks LLC, Member FINRA/SIPC, a Bro-
ker-Dealer and a Registered Investment Advisor. Advisory services also offered through Lakeridge Wealth Management LLC. Cetera is under
separate ownership from any other entity.
Opinions expressed are not intended as specific investment advice or to predict future performance. Additional risks are associated with
international investing, such as currency fluctuations, political and economic stability, and differences in accounting standards, all of which are
magnified in emerging markets. Past performance is not indicative of future results. The stocks of small companies are more volatile than the
stocks of larger, more established companies.
The views stated in this newsletter are not necessarily the opinion of Cetera Advisor Networks LLC and should not be construed directly or
indirectly as an offer to buy or sell any securities mentioned herein. Due to volatility within the markets mentioned, opinions are subject to
change with notice. Information is based on sources believed to be reliable; however, their accuracy or completeness cannot be guaranteed.
Past performance does not guarantee future results.
This newsletter is created by Portfolio Partners. Portfolio Partners provides investment research, portfolio and model management, and
investment advisor services to investment advisor representatives. Investors cannot invest directly in indexes. The performance of any index
is not indicative of the performance of any investment and does not take into account the effects of inflation and the fees and expenses asso-
ciated with investing. The S&P 500 is a capitalization-weighted index of 500 stocks designed to measure performance of the broad domestic
economy through changes in the aggregate market value of 500 stocks representing all major industries.
The Dow Jones Industrial Average (DJIA) is a price-weighted average of 30 significant stocks traded on the New York Stock Exchange (NYSE)
and the Nasdaq. The Nasdaq is a global electronic marketplace for buying and selling securities, as well as the benchmark index for U.S.
technology stocks and is also used to refer to the Nasdaq Composite, an index of more than 3,000 stocks listed on the Nasdaq exchange.
The NASDAQ Composite Index includes all domestic and international based common type stocks listed on The NASDAQ Stock Market. The
NASDAQ Composite Index is a broad based index. The MSCI EAFE index is designed to measure the equity market performance of developed
markets (Europe, Australasia, Far East) excluding the U.S. and Canada. The Index is market-capitalization weighted. The Bloomberg Barclays
US Aggregate Bond Index, which was originally called the Lehman Aggregate
Bond Index, is a broad based flagship benchmark that measures the investment grade, US dollar-denominated, fixed-rate taxable bond mar-
ket. The index includes Treasuries, government–related and corporate debt securities, MBS (agency fixed-rate and hybrid ARM passthroughs),
ABS and CMBS (agency and non-agency) debt securities that are rated at least Baa3 by Moody’s and BBB- by S&P. Taxable municipals, includ-
ing Build America bonds and a small amount of foreign bonds traded in U.S. markets are also included. Eligible bonds must have at least one
year until final maturity, but in practice the index holdings has a fluctuating average life of around 8.25 years. This total return index, created in
1986 with history backfilled to January 1, 1976, is unhedged and rebalances monthly.
The Russell 2000 Index measures the performance of the small-cap segment of the U.S. equity universe and is a subset of the Russell 3000
Index representing approximately 10% of the total market capitalization of that index. It includes approximately 2000 of the smallest securities
based on a combination of their market cap and current index membership.
The MSCI All-Country World Index is a free float-adjusted market capitalization weighted index that is designed to measure the equity market
performance of developed and emerging markets. The MSCI ACWI consists of 46 country indexes comprising 23 developed and 23 emerging
market country indexes. The developed country indexes include: Australia, Austria, Belgium, Canada, Denmark, Finland, France, Germany,
Hong Kong, Ireland, Israel, Italy, Japan, Netherlands, New Zealand, Norway, Portugal, Singapore, Spain, Sweden, Switzerland, the United King-
dom and the United States. The emerging market country indexes included are: Brazil, Chile, China, Colombia, Czech Republic, Egypt, Greece,
Hungary, India, Indonesia, Korea, Malaysia, Mexico, Peru, Philippines, Poland, Qatar, Russia, South Africa, Taiwan, Thailand, Turkey and United
Arab Emirates.
jen@gbafinancial.com Rochester Station
217.498.8575 | 855.778.8883 201 South Walnut Suite 300
Fax: 217.498.9299 Rochester, IL 62563You can also read