DRIVING OUTPERFORMANCE - THE FBHS ADVANTAGE & STRONG HOUSING - Investor Presentation April 2021
←
→
Page content transcription
If your browser does not render page correctly, please read the page content below

T H E F B H S A DVA N TAG E & ST R O N G H O U S I N G
     DRIVING OUTPERFORMANCE

Investor Presentation
April 2021
Learn About the
Opportunities

Our Commitment
to ESG
FBHS Overview
The FBHS Advantage
The Housing Market
Financial
Outperformance
and Outlook

This presentation contains forward-looking statements and uses
Non-GAAP information. For more, please read our Disclaimer
Message at the end of this presentation.
                                                                 2
Elevating our Focus on ESG to                                                                  View our

Drive Long-term Shareholder Value                                                             ESG Report:
                                                                                               www.fbhs.com/
                                                                                            global-citizenship/esg

        Environmental                             Social                            Governance
 ● Suite of eco-friendly plumbing,   ● Laser-focused on worker safety,     ● Broadened ESG oversight
   doors, and decking products         especially during pandemic;           through the Nominating,
   contribute to efforts in water      FBHS OSHA recordable incident         Environmental, Social &
   and forest conservation             and lost-time rates are better        Governance Committee of the
                                       than benchmarks                       Board of Directors
 ● Transitioned to a more robust
   Environmental, Health & Safety    ● Commitment to be a leader in        ● Adopted aspects of GRI and
   web platform to improve data        social change, including              SASB as key guideposts to frame
   collection and decision making      unconscious bias training for         ESG initiatives and strategic plan
                                       employees, employee resource
 ● Evaluating the TCFD framework       groups, joining the CEO Action      ● Board member refreshment
   and developing a carbon             for Diversity & Inclusion and the     increased diversity and
   mitigation strategy and goals       Kellogg Foundation Expanding          independent oversight
                                       Equity Program

                                                                                                                     3
Fulfilling the
 Dreams of Home
 Fortune Brands (NYSE: FBHS) is a
 home and security products company
 built on industry-leading brands and
 innovative products for kitchens,
 bathrooms, entryways and outdoor
 living spaces.
                                                                 #1                                  #1
                                           Products        North American                        Fiberglass &
                                           that save          consumer        Products that       storm door
                                                            faucet brand
                                           water                              conserve energy   system brands

Products that               Leading        Products that
are made from             cap. composite
                                           support the
                                                                 #1                                  #1
                            & PVC eco-                       Market share                       North American
recycled                     decking &     critical home   in N.A. cabinets
                                                                              Products that     padlocks brand
                                                                                                          4
materials                  railing brand
                                           industry                           protect people               4
Company Overview                                                                        Business Mix by Channel*

                                                                                                                   U.S. Home Centers           30%

Attractive, consumer-driven categories with                                                                        Wholesale
                                                                                                                   Dealer & Specialty Retail
                                                                                                                                               25%
                                                                                                                                                19%

leading brands and strong channel positions                                                                        Other Retail
                                                                                                                   Builder Direct
                                                                                                                                                 6%
                                                                                                                                                 4%
                                                                                                                   International                16%

                                                                                        Business Mix by End Market*

                                                                                                                   Repair & Remodel            50%
                                                                                                                   SF New Construction         23%
                                                                                                                   Multi-Family & Commercial   10%
                                                                                                                   International                16%

                                                        $6.1B
FBHS Net Profit Source
% Of Total FBHS as of YE 2020                                                           Within our Key N.A. Residential Market*

  22%
                                Plumbing                Net Sales YE 2020                                          Repair & Remodel            65%
                    51%         Cabinets                                                                           New Construction            35%
                                Outdoors & Security
                                                        FY20 Sales
 27%
                                                          Plumbing              $2.2B
                                                          Cabinets              $2.5B
                                                          Outdoors & Security   $1.4B
Net Profit represents segment operating income before
charges and gains, excluding Corporate G&A expense.                                     *Company data for the year ended December 31, 2020.           5
Increasing Shareholder Value:
Leveraging the FBHS Advantage to drive outsized
opportunities in a strong housing market
   Driving Outperformance         Increasing Shareholder
                                           Value

                                 Growth
                                                  Margin
                                 Above
                                               Improvement
                                 Market

                                           Lower
                                          Organic
                                          Volatility

                                                             6
The FBHS
Advantage
   The  Strong
  FBHS
            +
        Housing
Advantage       Market

                     =

                         7
The FBHS
            Advantage:
   The      It's What Sets
  FBHS
Advantage   Us Apart –
            Outperforming
            in All Cycles

                             8
                                 8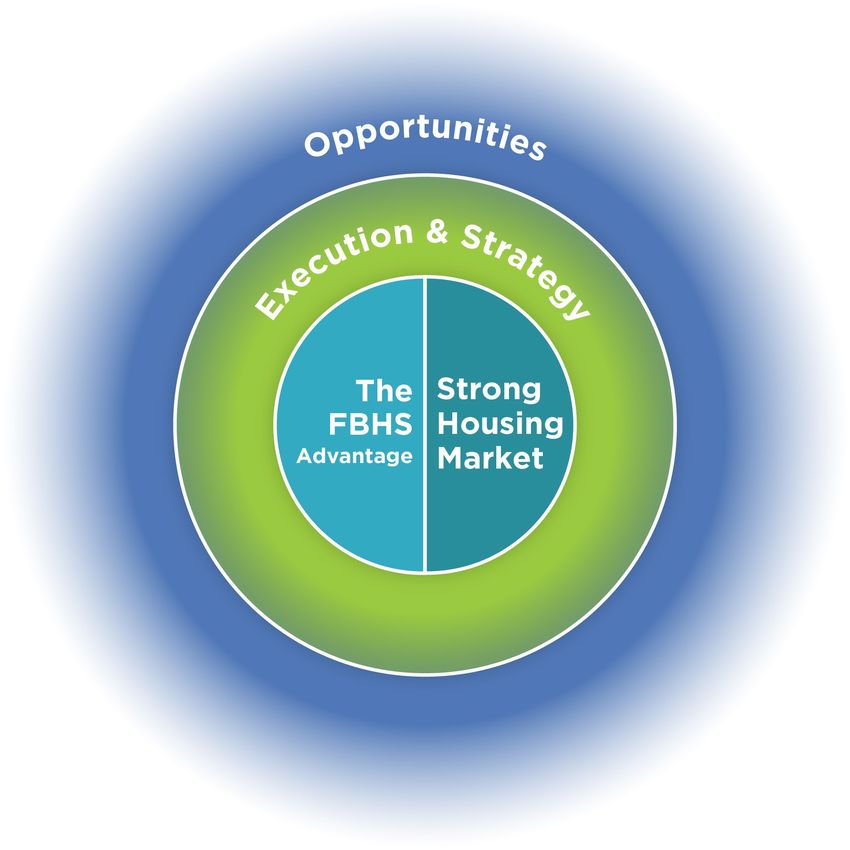
Deploying the FBHS
Advantage Across the
Organization to Drive
Revenue & Profit Growth
● Strong foundation of consumer-driven categories,
  industry-leading brands and strong channel positions
● Leveraging core capabilities / centers of excellence.
  Examples include:
    – Business simplification
    – Category management
    – E-commerce / digital enablement
    – Supply chain & next-gen sourcing
● Prioritizing investments to the most attractive
  opportunities
● Leveraging synergies across brands from channel
  and distribution expertise and broad market insight
● Re-basing cost platforms with more efficient SG&A

                                                          9
The FBHS Advantage in Action

Brand Building and Channel /            Leveraging Cross-Company                  Global Supply Chain
Distribution Synergies                  Experience                                Synergies
 Acquired Fiberon and leveraged         FBHS' advantaged portfolio approach       Global and indirect sourcing, freight and
 Therma-Tru's strong wholesale          allows for synergies created within our   other common core competencies are
 distribution network to grow Fiberon   operating companies. Operating            centrally developed and leveraged at FBHS
 brand awareness and customer reach.    Councils across brands share best         to get advantaged cost efficiencies for our
                                        practices and common core capabilities    leading brands.
 Recent acquisition of LARSON to        to create fuel for growth and enhance
 benefit from synergies as being part   margins – a significant investment made
 of larger Outdoors & Security          and a multiplying effect on returns.
 business.

                                                                                                                                10
The FBHS Advantage Drives Outperformance
and Increases Shareholder Value Creation
Growth Above ● Fuel high-potential growth engines and innovation
Market ● Build on sustainable competitive advantages
● Drive excellence in FBHS Advantage capabilities to unlock fuel and
Margin margin
Improvement
● Ensure lean and continuous improvement culture
● Maintain healthy core business
Lower Organic ● Take proactive steps to maximize agility and flexibility in a dynamic market
Volatility
● Be prepared to respond quickly for upside and downside scenarios
11Deploying the FBHS Advantage:
Execute to Drive Outperformance
1 2 3 4
Grow Fuel Execute Deploy Capital
Strong brands Lean operating model Culture of Prioritize investment
performance, safety & to best projects
Leading markets FBHS Advantage continuous
(U.S., China) capabilities improvement Significant free cash
flow generation
New product vitality • Business simplification
Empowered, diverse & creates consistent
Advantaged routes • Category management inclusive teams fuel for growth
to markets • E-commerce & digital Leadership in ESG Return cash to
shareholders
• Supply chain & sourcing
12Housing Strong
is a Great Housing
Market
Place to Be
13Multi-Year Opportunity to Address Significant Shortage
in Housing Supply
Our key U.S. housing market has been fundamentally underbuilt over the last decade
Housing Demand (In Millions)
2.4
2.2
1.7 1.7 1.7 1.8 1.7 1.6 1.7
1.5 1.6
1.2 1.3 1.3
1.0 1.1
0.7 0.7 0.7
2003 2004 2005 2006 2007 2008 2009 2010 2011 2012 2013 2014 2015 2016 2017 2018 2019 2020 2021F
Note: Housing demand equals the sum of HH formations, net depletions, natural vacancies and second homes
Yearly & Cumulative Over/(Under)-Build (In Millions)
0.9 1.3
0.7 0.7 0.8 1.0 1.0 0.9
0.3 0.4 0.6 0.4
0.1 0.1 0.0 0.1
-0.6
-0.1 -0.3 -0.1
-0.6 -0.6 -0.5 -0.4-0.3 -0.7 -0.6 -0.5 -0.4
-0.7
-0.8
Cumulative Over/(Under)-Build -1.4 -2.5
-2.0 -2.9 -3.1
Yearly Over/(Under)-Build -3.2
-3.2
2003 2004 2005 2006 2007 2008 2009 2010 2011 2012 2013 2014 2015 2016 2017 2018 2019 2020 2021F
Source: U.S. Census, HUD, FBHS Analysis
14Attractive
Fundamentals
Drive Housing
Market that is
Strong Now
and Into the
Future
Favorable Underlying Affordability &
Demographics Strong Financing
for Housing Fundamentals Support
Formation Support Housing Housing Market
& R&R Growth Growth
15Favorable Demographics for Housing Formation
Millennials: Age 25-35 Population (In Millions)
30 Prime age for first
home purchase ● Higher demand for
29.0 29.1 entry-level and first
29 28.8
28.4 step-up single-
28.0
28
27.5 family homes
27 26.8
26.5 ● Continued migration
26.3
26 to ex-burbs and
suburbs
25
● Demand for smart
24 home technology
2017 2018 2019 2020 2021 2022 2023 2024 2025
Baby Boomers: Age 60-80 Population (In Millions)
75 Living independently ● Higher demand for
longer 72.6
71.4 aging-in-place
70.2
70 68.8 products
67.1
65.4
65 63.5 ● COVID-19 driving
61.7 demand for
60
59.8 independent living
55
50
2017 2018 2019 2020 2021 2022 2023 2024 2025
16
Source: US Census Population ProjectionsAffordability
& Financing
Support
Housing
Market Growth
Low Relative High Levels of Healthy Consumer
Interest Rates Home Equity Balance Sheets
FED expected to keep fed Americans sitting on Consumer balance sheets
fund rates near zero record $7T+ of untapped up $2T during COVID-19
through 2022 home equity
17
Source: Federal Reserve, Black Knight, J.P. MorganUnderlying Strong
Fundamentals
Support R&R Spend
Aging housing stock
High home equity and home
price appreciation
Stability + Growth New
Tight housing supply Construction
FBHS benefits from 35%
Prioritization of home R&R stability while
functionality capturing upside 65%
from new R&R
construction activity
Two-thirds of our North American
residential sales are tied to the
stable and growing R&R market
18Families Consistently
Spend on R&R through a
Variety of Cycles
Re-value of
Historical R&R Growth* home driving
(Average of HIRI Home Improvement &
Retail Sales of Building Materials) growth above
historical
15% average of 4-6%
FBHS market forecast:
5.5% to 7.5% CAGR
10%
5%
0%
'11 '12 '13 '14 '15 '16 '17 '18 '19 '20 '21-23F
Source: HIRI, U.S. Census, FBHS analysis.
*Market growth expectations reflect our best estimates of end-market growth for our products
and services, weighted based on our exposure. 19Existing Housing Market & Home Investment Trends
Have Accelerated and Sustained During COVID-19
DIY Activity Remains Strong
(% of Homeowners Starting Projects)
70%
60%
70% 70% 66%
50% 61% 65%
40%
Mar ’20 May ’20 Jul ’20 Sep ’20 Mar ‘21
Consumer R&R Priorities
1. Kitchen
2. Backyard
3. Bathroom Over 90% of homeowners say
4. Flooring “the quality and comfort of my home is AS or MORE
IMPORTANT to me now compared to before COVID”
5. Decor (paint, furniture)
Source: The Farmsworth Group, Harvard Joint Center, Census, John Burns
20Financial Outperformance
and Outlook
21Value Continues to Be Created for Stakeholders
Five-Year Growth
1,200
31%
Five-Year Growth Total Net Sales
$1,018 $6.1B
1,000
$855 $868
$920
22%
800 $777
Operating Income
600
$857M
400
34%
200 Earnings Per Share
$4.19
0
2016 2017 2018 2019 2020
52%
EBITDA Note: EBITDA, Operating Income and EPS are on a before charges /
gains basis
(In Millions) 22Driving Outperformance in a Variety of Macro
Environments in 2020
Financial Performance Comparison
FY 2020 vs. PY
Net Sales EBITDA EPS
FBHS 6% 11% 29%
Peer Average(1) (~0%) 7% (-12%)
Outperformance +600 BPS +400 BPS +4100 BPS
(1) Peers not reporting on calendar fiscal cycles were adjusted to match comparable calendar periods. EPS is GAAP EPS. Source: IHS Markit
Total Shareholder Return (2020)
Peer A 45% Peer H 18% Peer O 4%
Peer B 35% Peer I 17% Peer P 4%
FBHS Peer Avg. S&P 500 Peer C 27% Peer J 17% Peer Q 3%
33% 21% 18%
Peer D 26% Peer K 16% Peer R -5%
Peer E 25% Peer L 14% Peer S -9%
Peer F 21% Peer M 12% Peer T -9%
Peer G 18% Peer N 10%
Peer set includes Allegion, AO Smith, Ball, BorgWarner, Dover, Ingersoll-Rand, JELD-WEN, Leggett & Platt, Lennox, Masco, Mohawk, Newell Brands, Owens Corning, Parker Hannifin, Pentair, RPM, Sherwin-Williams,
Snap-On, Stanley Black-Decker, Whirlpool; Total shareholder return peer average is weighted by market capitalization
23We anticipate Strong End Markets for our Products
and Services, Especially in the U.S.
2021 to 2023 Market Growth Expectations*
Global Market
● Expecting +6% to +8% CAGR
Outlook
● Expecting +6.5% to +8.5% CAGR
U.S. Market
Outlook ● U.S. Repair and Remodel (R&R): +5.5% to +7.5%
● U.S. New Construction: +8% to +11%
*Market growth expectations reflect our best estimates of end-market growth for our products and services, weighted based on our exposure.
The percentages above reflect 3-year CAGR off 2020 market performance.
24After Strong Execution in 2020, Expecting Leading
Growth and Profitability in a Strong Housing Market
2020 2020-2023 CAGR Based on Market Assumptions:
Net Sales: Net Sales: Based on 3-Year
+5.7%1 +8% to +11% Market Growth CAGR:
FBHS
OI Margin: OI Margin:
14.1% 16% to 17% ● Global Market:
+6% to +8%
Net Sales: Net Sales:
Global +8.6% +7% to +9% ● U.S. Market:
Plumbing +6.5% to +8.5%, of which:
OI Margin: OI Margin:
Group 22.2% 22%+
– U.S. Repair and Remodel:
Net Sales: Net Sales: +5.5% to +7.5%
+3.4% +6.5% to +9.5%
Cabinets – U.S. New Construction:
OI Margin: OI Margin:
10.4% 14% +8% to +11%
Net Sales: Net Sales:
Outdoors +5.2%1 +14% to +17%
& Security OI Margin: OI Margin:
14.5% 17% to 19%
1LARSON sales not included in 2020 sales figures
2020-2023 net sales growth ranges reflect estimated compound annual growth rates (CAGR) from 2020-2023 based off 2020 performance. 25Fortress Balance Sheet
Driving Value for
Stakeholders Almost $6 Billion
Deployed
since 2012
Strong Long
Free Cash History of
Flow Dividend
Generation Growth
No Near-Term Accretive &
Debt Strategic Share
Maturities Repurchases
26Significant Capital Deployment Over Next Three Years
Drives Growth and Outperformance
Potential to deploy $3B-$5B+ of capital through 2023 to drive further value creation –
almost equaling the amount deployed since the 2011 spin
($ in Millions) ($ in Millions)
Capital Deployment Deployment Potential
2012 to 20201 2021 to 20231,2
Source: Source:
Cash Available
Cash Cash $3,924 to Drive Cash $2,200 - 2,500
Deployed Added Debt 1,857 Incremental Added Debt 800 - 2,700
Value
Total $5,781 Total $3,000 - 5,200
Acquisitions $2,810 Acquisitions & Share
$2,500 - 4,700
Repurchases
Share Repurchases 2,174 Potential
Capital Dividends ~500
Dividends 797 Capital
Allocation
Allocation Total $3,000 - 5,200
Total $5,781
Net Debt to EBITDA3 2.1x Net Debt to EBITDA 2.0x to 2.5x
1EBITDA is before charges / gains on a continuing operations basis. Potential deployment includes $255 million of share repurchases
2 M&A debt capacity assumes target acquired at 10x EV/EBITDA multiple and levered at 2.5x
3 Net Debt to EBITDA as of year-end 2020 27Our Opportunities Have
Never Been Greater
Brand Expansion Opportunities
● New core businesses
1 ●
●
Adjacent categories
E-commerce
● Cross-branding
● China growth
Leading Home Innovation & Trends
● Connected products
2 ● Digitization of water
● Material-conversion / Outdoor living
● Home investment trends
External Growth
3 ● Generate & strategically deploy capital
● M&A and partnerships
28Environment, Social &
Governance (ESG) Matters
Permeate our Business
● ESG principals are foundational to FBHS being
a profitable company, respected employer and
responsible corporate citizen.
● Our ESG Report provides a resource to address
questions related to specific ESG metrics and
initiatives we believe are meaningful to our
business, including:
– Safety Targets and Safety Programs View our
– Employee Health & Wellness Benefits ESG Report at:
– Diversity, Equity & Inclusion and Development
www.fbhs.com/
– Energy and Water Usage global-citizenship/esg
– Waste and Recycling
– Manufacturing Responsible Products
– Environmentally-Friendly Innovations
– Ethical Standards for Employees & Partners
29Disclaimer
Notice on Forward-Looking Statements
This presentation contains certain "forward-looking statements" regarding business strategies, market potential, future financial performance and other matters,
including all statements with respect to "next phase," "plan," "plan to win," "continued performance," "what we see," "expected growth," "outlook," "future,"
"target," "potential" and "guidance" and statements with words such as "will," "believe," "capability," "should," "could," "expect," "estimates" or "projected" or
the letter "E". Where, in any forward-looking statement, we express an expectation or belief as to future results or events, such expectation or belief is based on
the current plans and expectations at the time of this presentation. Our views about future performance involve risks and uncertainties that are difficult to
predict and, accordingly, our actual results may differ materially from the results discussed in our forward-looking statements.
Although we believe that these statements are based on reasonable assumptions, they are subject to numerous factors, risks and uncertainties that could cause
actual outcomes and results to be materially different from those indicated in such statements, including but not limited to changes in the housing market and
North American economies, levels of new home construction and repair and remodel, our ability to maintain our competitive positions in our industry, risks
associated with acquisitions and other strategic initiatives and investments, access to and availability of labor and raw materials, risks associated with doing
business globally, our ability to successfully innovate and other risks described in our Annual Report on Form 10-K as filed with the Securities and Exchange
Commission. Except as required by law, we undertake no obligation to update or revise any forward-looking statements to reflect changed assumptions, the
occurrence of anticipated or unanticipated events, new information or changes to future results over time or otherwise.
Use of Non-GAAP Financial Information
This presentation may include financial measures, including EBITDA before charges/gains, operating income before charges/gains, free cash flow, operating
margin before charges/gains, and diluted EPS before charges/gains that are derived based on methodologies other than in accordance with U.S. generally
accepted accounting principles (GAAP). We offer these measures to assist investors in assessing our financial performance and liquidity under GAAP, but
investors should not rely on these measures as a substitute for any GAAP measure, including net income or operating income. In addition, these measures may
be inconsistent with similarly titled measures presented by other companies. All financial information presented herein is unaudited. All data in this report is from
continuing operations. For more information, including reconciliations of these non-GAAP financial measures to the most comparable GAAP measures, please
visit the "Investor Center" section of the Company's website at www.FBHS.com.
30You can also read