A Well Oiled Machine Market Indicators Report | 2017 - NEW ZEALAND INDUSTRIAL - Colliers International
←
→
Page content transcription
If your browser does not render page correctly, please read the page content below

Market Indicators
Report | 2017

NEW ZEALAND INDUSTRIAL

A Well Oiled
Machine

Accelerating success.

3 Stonehill Drive
Wiri, Auckland
Neville Holdings purchased 3 Stonehill Drive from Rock Solid Holdings Limited
for $7,025,000. The sale of the 2,300 sqm high stud prime warehouse reflected a
yield of 4.9%.

Contents
Industrial Snapshot                            4

Introduction                                   6

Key Findings                                   6

Industrial Market Indicators                   7

Auckland                                       8

Wellington                                     10

Christchurch                                   12

Regional Updates                               14

Outlook                                        15

  colliers.co.nz/Find-Research

  Join our LinkedIn group:
  Colliers International New Zealand Network

  Follow us on Twitter: @Colliers_NZ

  Subscribe on YouTube: ColliersIntNZ

INDUSTRIAL SNAPSHOT

                                                                                          TAURANGA/
 AUCKL AND OVERALL                              HAMILTON OVERALL                          MT MAUNGANUI OVERALL

     2.1% Vacancy Rate

 $109/m² Average Warehouse Net Rent              $81/m²   Average Warehouse Net Rent       $94/m²   Average Warehouse Net Rent
 $208/m² Average Office Net Rent                $136/m²   Average Office Net Rent         $134/m²   Average Office Net Rent
    6.4% Average Yield                             6.8%   Average Yield                      6.3%   Average Yield
   761 ha Industrial Zoned Vacant Land
 $472/m² Average Land Value

 Outlook: Demand:                               Outlook: Demand:                          Outlook: Demand:
            Supply:                                       Supply:                                   Supply:

                               KAPITI EXPRESSWAY, WELLINGTON                                  I PORT, ROLLESTON,
                               MacKays to Peka Peka stage completed Q1 2017.                  CHRISTCHURCH
                               Opens up the Kapiti Coast to new industrial                    Released further freehold
                               developments.                                                  sections for sale in Q3 2017.

                                 INFRASTRUCTURE                                                  DEVELOPMENT

      2016

                                         2017

 DEVELOPMENT                                                            DEVELOPMENT
THE LANDING, AUCKLAND AIRPORT                                       Q3 2017
Stage 2 completed Q3 2016.                                          SIX ADDITIONAL DEVELOPMENTS, AUCKLAND
Focus shifted to Stage 3.                                           Goodman Property Trust announced six new industrial
                                                                    developments, three at Highbrook, which will add 58,368
                                                                    sqm of warehouse and office space to their portfolio.

                                                                    4
WELLINGTON OVERALL                         CHRISTCHURCH OVERALL                          DUNEDIN OVERALL

    2.9% Vacancy Rate                          1.9% Vacancy Rate

 $106/m²    Average Warehouse Gross Rent     $90/m²   Average Warehouse Net Rent           $73/m²    Average Warehouse Net Rent
 $136/m²    Average Office Gross Rent       $172/m²   Average Office Net Rent              $119/m²   Average Office Net Rent
    8.3%    Average Yield                      7.6%   Average Yield                           8.6%   Average Yield
   133 ha   Industrial Zoned Vacant Land     836 ha   Industrial Zoned Vacant Land           48 ha   Industrial Zoned Vacant Land
 $398/m²    Average Land Value              $285/m²   Average Land Value

 Outlook: Demand:                           Outlook: Demand:                              Outlook: Demand:
            Supply:                                   Supply:                                        Supply:

    SOUTHERN MOTORWAY STAGE 2, CHRISTCHURCH                           TRANSMISSION GULLY
    Expected to open 2019.                                            MOTORWAY, WELLINGTON
    New motorway section improving travel time and                    Expected to open 2020.
    congestion between central Christchurch and                       Additional route between Wellington
    Rolleston.                                                        and the lower North Island.

      INFRASTRUCTURE                                                   INFRASTRUCTURE

      2019                                                                                  2022

                                                                                2020

 DEVELOPMENT                                                                            DEVELOPMENT
TE RAPA GATEWAY, HAMILTON                                                              TITANIUM PARK, HAMILTON
Due for completion 2019.                                                               Due for completion 2022.
A five stage industrial park developed by                                              A mixed use industrial and commercial
Chalmers Properties.                                                                   development consists of five stages
                                                                                       spanning a total 75 hectares of land.

                                                                5
Introduction Industrial Prime Yields - Three Main Centres
The New Zealand industrial market has powered on over the past 12
9% 10 Year Average
months, with continued upward momentum in all centres. Investor
confidence remains strongly positive. 8%
7%
Prime Industrial Yield
Investment activity has been driven by robust occupier and buyer 6%
demand, with a shortage of good quality opportunities driving 5%
up prices. It comes as no surprise that record low yields, high 4%
rental growth, and strong capital appreciation have been the main
3%
outcomes.
2%
1%
Increasing land values and construction costs will moderate the
amount of new industrial development over the short to medium 0%
Jun-16 Jun-17 Jun-16 Jun-17 Jun-16 Jun-17
term in some centres. All major economic indicators signal an Auckland Wellington Christchurch
expansionary outlook for the New Zealand economy and the
industrial sector. Source: Colliers International Research
Key Findings
»» Auckland’s overall industrial vacancy is currently 2.1%
(February 2017), down from the previous record low 2.2%
Industrial Vacant Land Supply - Three Main Centres
recorded in February 2016. Demand from both tenants and
owner occupiers has been consistently strong over the past Nov-15 Nov-16
year as businesses continue to expand off the back of a strong
900
economy.
Vacant Industrial Land (ha)
800
700
»» Tenant and owner-occupier demand in Wellington has grown
600
even stronger over the past year. Overall combined prime gross
500
rents increased by 7.4% in the year to June 2017 reaching $127/ 400
sqm, with secondary increasing by 9.5% to $98/sqm. 300
200
»» The Christchurch investment market has substantial capital 100
ready for investment. Prime yields in the 6.0% to 6.5% range are 0
being seen more regularly with average prime yields currently Auckland Wellington Christchurch
sitting at 6.8%, down from 7.0% 12 months ago.
Source: Corelogic, Colliers International Research
»» Prime vacant space is being absorbed almost as soon as it
becomes available in Hamilton. However more supply is
expected as Chalmers Properties develop several speculatively
built premises at Te Rapa Gateway.
»» The Tauranga industrial market is currently experiencing
record low vacancy and justifiably so, considering the high Industrial Investor Confidence Survey -
population growth the city has experienced over the past few Three Main Centres
years.
Auckland Wellington Christchurch
»» Demand continues to outweigh supply in the Dunedin 80%
industrial market with little prime stock currently available for
60%
either lease or purchase.
Net Percent
40%
20%
0%
Jun-12
Jun-13
Jun-15
Jun-17
Jun-14
Jun-16
Dec-12
Dec-13
Dec-14
Dec-15
Dec-16
-20%
-40%
Source: Colliers International Research
6
New Zealand Industrial Market Indicators Q2 2017
                                                                                                            Prime           Secondary
                      Vacancy                                                                                                                   Prime      Secondary
                              Average Net Prime Rentals                Average Net Secondary                Capital           Capital
                        Rate                                                                                                                    Market    Market Yields
                                    ($/m² pa)***                        Rentals ($/m² pa)***                Values            Values
 Precinct               (%)                                                                                                                  Yields (%)**    (%)**
                                                                                                           ($/m²)*           ($/m²)*
                                    Office          Warehouse            Office        Warehouse
                      OVERALL     LOW     HIGH     LOW       HIGH     LOW     HIGH     LOW      HIGH     LOW     HIGH       LOW      HIGH        LOW     HIGH    LOW     HIGH

 AUCKLAND             Feb - 17

 Airport Corridor       3.3%      240      260      110       125      150     190      80      100      2,175    3,040     1,175    1,750       5.00%   6.25%   6.75%   8.00%

 East Tamaki            2.4%      230      270      110       130      150     190      90      105      2,145    3,160     1,275    1,875       5.00%   6.25%   6.50%   8.00%

 Manukau/Wiri           2.2%      230      260      110       130      145     185      90      100      2,145    2,970     1,265    1,800       5.25%   6.25%   6.50%   8.00%

 Mt Wellington          1.9%      230      270      110       130      150     190      90      105      2,145    3,160     1,275    1,875       5.00%   6.25%   6.50%   8.00%

 Penrose /
                        1.8%      230      270      110       130      150     190      90      105      2,145    3,160     1,275    1,875       5.00%   6.25%   6.50%   8.00%
 Onehunga

 Rosebank /
                        1.6%      225      270      110       130      140     180      85      105      2,045    3,010     1,200    1,845       5.25%   6.50%   6.50%   8.00%
 Avondale

 New Lynn               3.1%      210      255      105       125      160     190      80       95      1,800    2,515     1,200    1,630       6.00%   7.00%   7.00%   8.00%

 Henderson              1.0%      210      255      105       125      160     190      80       95      1,800    2,515     1,200    1,630       6.00%   7.00%   7.00%   8.00%

 Mairangi Bay           2.2%      220      265      110       130      190     220      115     120      2,200    3,140     2,000    2,545       5.00%   6.00%   5.50%   6.50%

 North Harbour          1.1%      200      250      110       130      180     220      110     120      2,135    3,080     1,910    2,545       5.00%   6.00%   5.50%   6.50%

 Wairau Valley          1.5%      195      245      110       130      170     200      105     115      2,115    3,220     1,685    2,400       4.75%   6.00%   5.50%   7.00%

 WELLINGTON           Nov - 16

 Seaview                2.7%      155      180      120       140      100     125      80      105      1,590    2,115      885     1,320       7.00%   8.00%   8.25%   9.50%

 Grenada                0.2%      145      175      115       135      105     130      90      105      1,515    2,045     1,005    1,335       7.00%   8.00%   8.25%   9.25%

 Miramar /
                        0.0%      135      155      105       120      110     125      85       95      1,305    1,695      945     1,120       7.50%   8.50%   9.00%   9.50%
 Rongotai

 Ngauranga              3.3%      160      190      130       150      130     160      105     120      1,755    2,340     1,220    1,600       6.75%   7.75%   8.00%   9.00%

 Petone /
                        4.6%      150      175      120       140      135     160      105     120      1,625    2,180     1,200    1,600       6.75%   7.75%   8.00%   9.25%
 Alicetown

 Porirua                3.4%      140      155      115       125      105     120      80       90      1,500    1,870      920     1,200       7.00%   8.00%   8.00%   9.25%

 Naenae /Wingate        3.9%      135      165      105       125      90      100      60       80      1,305    1,775      695      990        7.50%   8.50%   8.50%   9.50%

 Upper Hutt             1.4%      120      140       90       105      85      100      60       75      1,065    1,400      650      865        8.00%   9.00%   9.25%   10.00%

 CHRISTCHURCH         Sept - 16

 Hornby / Islington     0.5%      170      250       90       120      135     165      70       90      1,570    2,435      975     1,400       6.00%   6.75%   7.50%   8.50%

 Middleton /
                        2.3%      170      250       90       120      135     175      70       90      1,570    2,435      975     1,425       6.00%   6.75%   7.50%   8.50%
 Sockburn

 Sydenham               3.4%      170      250       90       125      135     165      70       95      1,570    2,500      975     1,455       6.00%   6.75%   7.50%   8.50%

 Riccarton /
                          -       170      250       90       125      135     165      70       95      1,570    2,500      975     1,455       6.00%   6.75%   7.50%   8.50%
 Addington

 Bromley                  -       140      200       75       95       95      125      50       70       950     1,545      525      955        7.50%   9.25%   8.50%   11.25%

 Woolston                 -       170      220       90       120      125     165      65       85      1,460    2,240      855     1,265       6.25%   7.25%   8.00%   9.00%

 HAMILTON

 Hamilton                 -       130      200       75       120      90      125      55       75      1,325    2,475      775     1,215       5.50%   6.50%   7.00%   8.00%

 TAURANGA
 Tauranga /
                          -       150      165      100       115      100     120      75       85      1,835    2,500     1,065    1,415       5.00%   6.00%   6.50%   7.50%
 Mt Maunganui
 DUNEDIN

 Inner City               -       130      230       85       135      70      130      45       85      1,175    2,280      500     1,175       6.75%   8.00%   8.00%   10.00%

 Kaikorai Valley          -       100      200       65       110      60      100      40       65       825     1,830      420      825        7.00%   8.75%   8.75%   10.50%

 Mosgiel                  -        90      170       55       100      60       90      40       55       710     1,630      420      710        7.00%   8.75%   8.75%   10.50%

Source: Colliers International Research      Assuming 2000m² building with 50% site coverage
*Based on net combined rents of warehouse and office rents (assumes warehouse/office ratio of 80:20) and assuming fully leased at market rates
**Assumes freehold where appropriate         ***Wellington based on gross rents		              Note: figures are rounded

                                                                                          7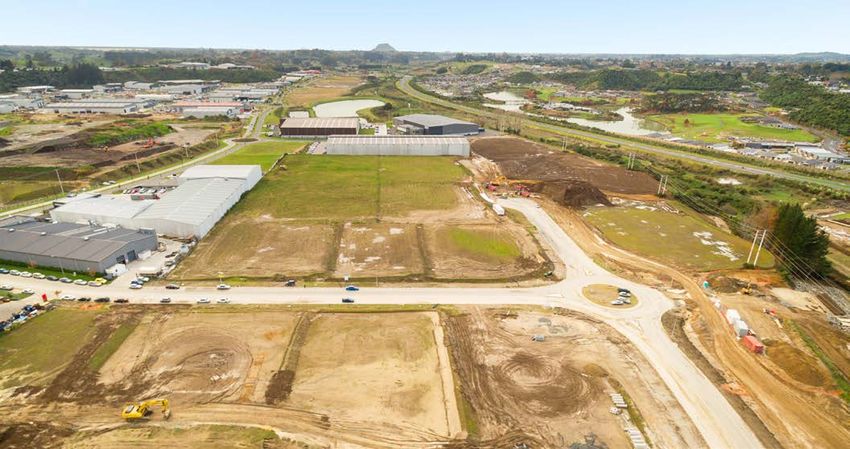
Auckland                                                                  Auckland Industrial Vacancy by Precinct

                                                                                                                                                 Feb-16                                          Feb-17

                                                                                         6%

The Auckland Industrial market has gone from strength to strength                        5%

                                                                          Vacancy Rate
over the past 12 months with our February 2017 vacancy survey                            4%

showing an overall vacancy rate of 2.1%, down from the previous                          3%

record low 2.2% recorded in February 2016. Demand from both                              2%

tenants and owner occupiers has been consistently strong over the                        1%

past year as businesses continue to expand off the back of a strong                      0%

                                                                                                                                                                                                   East Tamaki
                                                                                                        Onehunga/Penrose

                                                                                                                                                                                                                                                                 New Lynn
                                                                                                                                                               Airport Corridor
                                                                                              Overall

                                                                                                                                                                                                                 Mairangi Bay

                                                                                                                                                                                                                                 North Harbour
                                                                                                                                                                                  Manukau/Wiri

                                                                                                                                                                                                                                                 Wairau Valley
                                                                                                                                               Mt Wellington

                                                                                                                                                                                                                                                                            Henderson
                                                                                                                           Rosebank/Avondale
economy. We are now seeing increased demand for larger, higher
quality buildings, as well as businesses seeking design-build
premises. Bunnings Warehouse recently commissioned the largest
design build the market has seen in recent years for a new 20,500
sqm distribution centre at Auckland Airport. Smaller premises
                                                                          Source: Colliers International Research
have remained in high demand continuously over the past 12
months.

The 185,000~ sqm of development completed over the past year
has played catch up to the excess demand rather than tipping
the scales towards oversupply. This recent crop of developments           Auckland Industrial Development
included the new 55,000 sqm state of the art Sistema factory
completed in Q3 2016. There is another 120,000 sqm currently
                                                                                                                     13,700
under construction. Given the current conditions, some developers                                                     sqm
or owners with industrial vacant land are going ahead with
speculatively built premises, and further prime grade stock is                                                                                                                                                                  Under Construction
expected to be constructed on this basis over the coming year. Of
the developments announced by Goodman Property Trust (GMT)                                                                                                                        116,192                                       Proposed (to 2022)
                                                                                                                                                                                    sqm
for FY18*, approximately 80% (by net lettable area) have been                            119,066
                                                                                           sqm
speculatively built, demonstrating the confidence in the extent of                                                                                                                                                              Proposed (2022+)
current demand.

With developable industrial land hard to find and building costs
surging ahead we’re seeing significant pressure on rents, and this
is expected to continue in the short to medium term. The latest           Source: Colliers International Research

Colliers International Industrial Vacant Land Survey showed
approximately 82 ha was absorbed between November 2015 and
November 2016, one of the fastest rates of land take-up experienced
post-GFC.

Average prime warehouse rents are now at $119/sqm the same
                                                                          65 Hugo Johnston Drive
                                                                          Penrose, Auckland
level as 12 months ago, with secondary at $98/sqm, up from $91/
sqm. Incentives are still being offered, however they tend to be at
low levels. With limited options available to lease, some tenants
are opting to become owner occupiers where land and building
packages are being offered.

High investment demand, strong expectations of future rental
growth, and a shortage of opportunities has driven yields lower.
Average prime yields for June 2017 are 5.8%, down from 6.1% 12
months ago, with secondary at 7.0%, down from 7.2% 12 months
ago. The recent $7 million sale of 3 Stonehill Drive reflected a
strong yield of 4.9%. Over the next 12 months, yields are expected
to remain firm, with many cashed-up investors waiting for a
chance to buy.
                                                                          In May 2017, an owner-occupier purchased the former Sistema
                                                                          Plastics premises at 65 Hugo Johnston Drive from PFI. The
*1 Apr 2017 – 31 March 2018                                               premises was sold vacant for $14,250,000. Sistema moved to their
                                                                          new premises in late 2016, a state of the art 55,000 purpose-built
                                                                          facility in South Auckland.

                                                                      8
North Harbour Mairangi Bay
$500 5.5% $650 5.5%
$120 0.7% 18 $120 3.4%
KEY
NOR
TH
Industrial Areas
ER
Y
N
W
M
MW
Average Prime
O UR Land Values ($/m2)
Wairau Valley
Y
RB
HA $650 5.4% Average Prime
ER Market Yields (%)
P
$120 1.5%*
UP
Average Prime
Warehouse Rents ($/m2)
Prime Vacancy Rates (%)
N O RT H
Trend 0%/$0 Actual
ES Auckland CBD
W
TE
RN Rosebank/Avondale Financial Indicators: Jun 16 to Jun 17
MW Physical Indicators: Feb 16 to Feb 17
Y $413 5.9%
$120 1.7%
16
Henderson Penrose/Onehunga
Rosebank Road Interchange
$400 6.5% $475 5.6%
$115 0.4% $120 0.4% Mt Wellington
SO
UT
H $500 5.6%
WE
ST
ER $120 0.0%
N
MW
Y
New Lynn
$400 6.5% East Tamaki
$115 3.1%* $438 5.6%
$120 1.8%
Highbrook Drive Interchange
Airport Corridor/
Mangere Manukau/Wiri
$413 5.6%
20 $425 5.8%
* Overall vacancy $118 2.5% $120 0.4%
Auckland Industrial Market Review
2017 compared to 2016
Occupier Demand Rentals Investor Demand
Enquiry Average prime grade Enquiry demand, prices
Investor confidence Warehouse $119/m2 Buyer groups = private, institutions
Supply Demand Office $240/m2
Prime Incentives 2 weeks/year of term
Vacancy Investment Sales Land Supply
Prime grade 1.4% (Feb 2017) Average prime yields 5.8% Enquiry
Secondary grade 2.3% (Feb 2017) Average secondary yields 7.0% Available land for sale
Spec build activity Value pressure
9
Wellington                                                                              195-197 Gracefield Road
                                                                                        Seaview, Wellington

Tenant and owner-occupier demand in Wellington has grown
even stronger over the past year with our latest vacancy survey
showing a record low of 2.9% in November 2016, a theme that
has continued into 2017. This was a further reduction from the
previous record low of 3.6% in November 2015, proving the need
for new development. Prime vacancy reduced to 0.6%, from 4.0%
(the lowest in five years) and secondary to 3.1%, down from 3.6%.
Other factors driving vacancy down include the conversion of
industrial premises to other uses, and demolition/acquisition for
infrastructure projects.
                                                                                        Gek Property Nominees (Seaview) Limited sold 195-197 Gracefield Road
Expanding businesses are another driver of demand in this market                        for $14,000,000 in November 2016, at a yield of 8.0%. The large transport/
with some moving into two or three different sites if they can’t find                   distribution depot comprises a medium stud warehouse and canopy
one property large enough. Further development is being hindered                        together with an adjoining large high stud purpose built modern
                                                                                        warehouse which includes a large drive through canopy.
by a lack of available vacant industrial land in the more centrally
located precincts, along with rising construction costs. This is
putting further pressure on the current supply demand dynamic
and driving rents upwards. Prime combined gross rents increased
by 7.4% in the year to June 2017 reaching $127/sqm, with secondary                      Wellington Industrial Vacancy by Precinct
increasing by 9.5% to $98/sqm.
                                                                                                                                             Nov-15                      Nov-16
The volume of sales over the past 12 months has been lower,
                                                                                            5%
recording firmer yields for properties that do come up for
                                                                                            4%
sale. Prime yields reduced to 7.7% as at June 2017, down from
                                                                             Vacancy Rate

7.9% 12 months ago, with secondary yields at 8.9%, down from                                3%

9.2%. Positive market conditions are expected to continue for                               2%
the next few years being underpinned by current and proposed
                                                                                            1%
infrastructure projects intensifying demand from businesses
involved directly and indirectly in the projects.                                           0%
                                                                                                                                                                                                                                    *
                                                                                                 Overall

                                                                                                                                                                                        Porirua

                                                                                                                                                                                                               Kilbirnie/Rongotai

                                                                                                                                                                                                                                    Miramar
                                                                                                                                        Grenada North

                                                                                                                                                                            Ngauranga
                                                                                                                     Petone/Alicetown

                                                                                                                                                                                                  Upper Hutt
                                                                                                                                                        Naenae/Wingate
                                                                                                           Seaview

The Hutt River stop bank works, aimed at protecting Lower Hutt
from flooding, will see around 15 industrial properties housing
around 35 businesses demolished by the Regional Council. The
new Petone to Grenada Link Road, proposed to start in 2019, will
                                                                                        Source: Colliers International Research
also reduce industrial supply by around 35 properties involving                         *0% vacancy
some 45 businesses, prompting tenants and owner occupiers to
re-position themselves in anticipation of the upcoming changes. A
total of almost 50,000 sqm of industrial space and over 7.5 hectares
of land will be removed from the market by these two projects.
                                                                                        33 Bouverie Street
Recent conversion projects to retail involving Countdown,                               Petone, Wellington
Bunnings, Briscoes/Rebel Sport and Kmart has removed a further
27,000 sqm of industrial buildings and around six hectares of
industrial land from the sought after Petone market.

The Transmission Gully motorway, expected to open in 2020,
will service the need for an additional and more reliable route
between Wellington and the lower North Island, strengthening
accessibility to Wellington as an industrial hub. It will also
improve connectivity around the region. The recently completed
MacKays to Peka Peka stage of the Kapiti Expressway will open
up the Kapiti Coast to new industrial development, eventually
stretching to Levin.

                                                                                        33 Bouverie Street was leased to Foodstuffs North Island for their new
                                                                                        Gilmours Wholesale & Beverage premises. The site comprises a large
                                                                                        warehouse built in 2004 with a 9m stud height and is to be refurbished
                                                                                        by the tenant.

                                                                        10
KEY
Upper Hutt
Industrial Areas
$150 9.1%
Average Overall
Land Values ($/m2) $83 1.4%
Porirua
Average Overall
Market Yields (%) $225 8.1%
INDICATIVE TRANSMISSION
Average Overall $103 3.4% GULLY MOTORWAY
Warehouse Rents* ($/m2)
Overall Vacancy Rates (%)
2
Grenada North
WY
A M
Trend 0%/$0 Actual $263 8.1%
Financial Indicators: Jun 16 to Jun 17
IRU
$111 0.2%
Physical Indicators: Nov 15 to Nov 16 Wingate/Naenae
POR
$188 8.5%
LLE
1
$93 3.9%
NVI
Ngauranga
NSO
$575 7.9%
2 Petone/Alicetown
$126 3.3% JOH
$650 7.9%
$121 4.6%
Wellington CBD
Seaview/Gracefield
$313 8.2%
$111 2.7%
Kilbirnie/Rongotai/Miramar
$825 8.6%
$101 0.6%
Wellington Industrial Market Review
2017 compared to 2016
Occupier Demand Rentals Investor Demand
Enquiry Average overall*: Enquiry demand, prices
Investor confidence Warehouse $108/m2 Buyer groups = private, institutions
Supply Demand Office $130/m2
Vacancy Investment Sales Land Supply
Overall vacancy 2.9% (Nov 2016) Average prime yields 7.7% Enquiry
New build activity Average secondary yields 8.9% Available land for sale
Value pressure
*Based on gross face rents
11Christchurch 466 Blenheim Road
Sockburn, Christchurch
The prime industrial market in Christchurch has remained tight
over the past 12 months. Demand has been concentrated on
efficient high stud premises.
The competitive construction industry in Christchurch is keeping
building costs in check. Most development at the moment is for
owner occupiers. Asking rents offered for newly built prime stock
have been competitive. This has enabled some tenants to expand
into newly built premises at not much more than an existing site.
New build rents are expected to stay at current levels over the short 466 Blenheim Road was sold with vacant possession following an
to medium term. In the secondary market increasing vacancy is international marketing campaign where a high number of offers were
putting downward pressure on rents, in particular for low stud received with most coming from outside of Christchurch including the
successful purchaser.
height buildings, with some landlords reducing their asking rent
to fill vacant space. Prime average net warehouse rents remained
at $103/sqm in June 2017, the same level as 12 months ago, with
secondary increasing to $77/sqm, up from $76/sqm 12 months ago.
Incentives effectively disappeared following the major earthquakes Christchurch Industrial Vacancy Survey by Precinct
in Christchurch, however for existing buildings they are now
starting to be discussed more regularly in negotiation.
Sep-15 Sep-16
The Christchurch investment market has substantial capital looking 4%
for opportunities. The recent sale of the Kathmandu Distribution
3%
Centre in Christchurch involved a national campaign which
Vacancy Rate
generated substantial interest from the North Island, particularly 2%
Auckland, showing the level of demand across the country for good
1%
quality prime assets. Secondary yields are starting to soften. Prime
yields in the 6.0% to 6.5% range are being seen more regularly with 0%
average prime yields sitting at 6.8% in June 2017, down from 7.0% 12
Sydenham
Middleton/Sockburn
Overall
Hornby/Islington
months ago, and secondary at 8.4%, down from 8.6% 12 months ago.
Over the next 12 months, the current level of development is
expected to ease. Although fundamentals are encouraging, some
constraints on debt availability and uncertainty around rental
growth may make developers pause before taking the plunge. Source: Colliers International Research
Kathmandu Distribution Centre
33 Kennaway Road, Woolston
The Kathmandu Distribution Centre at 33 Kennaway Road was sold for
$15,900,000, reflecting a yield of 6.8%.
12CHRISTCHURCH
INTERNATIONAL
AIRPORT 74
Bromley
Riccarton $150 8.4%
73 $363 6.4%
$85
$108
Hornby/Islington
Sydenham
$250 6.4%
$450 6.4%
$105 0%
$108 0%
73
Sockburn/Middleton
KEY
$300 6.4% Portlink Industrial Park
Industrial Areas
$105 0.9%
Average Prime
Land Values ($/m2) Woolston/Hillsborough
Average Prime $195 6.8%
Market Yields (%)
$105
Average Prime
75
Warehouse Rents ($/m2)
Prime Vacancy Rates (%)
Trend 0%/$0 Actual
Financial Indicators: Jun 16 to Jun 17
Physical Indicators: Sept 15 to Sept 16
Christchurch Industrial Market Review
2017 compared to 2016
Occupier Demand Rentals Investor Demand
Enquiry Average prime prade: Enquiry demand, prices
Business confidence Warehouse $103/m2 Buyer groups = private, institutions
Supply Demand Office $201/m2
Vacancy Investment Sales Land Supply
Prime grade 0.3% (Sep 2016) Average prime yields 6.8% Enquiry =
Secondary grade 2.0% (Sep 2016) Average secondary yields 8.4% Available land for sale =
Spec build activity Value pressure =
13Regional Centres
Tauranga Whango Place
Tauriko Business Estate, Tauranga
The Tauranga industrial market is currently experiencing record low
vacancy and justifiably so, considering the high population growth the city
has experienced over the past few years. This has created strong business
confidence, with the buoyancy of the property market allowing investors
to positively gear properties.
Tauriko Business Estate is set to commence construction on several
industrial sites including some speculative developments. This will
provide more options for businesses who may be struggling to expand
in the current tight conditions. The lack of available stock is expected to
cause upward rental growth on new builds and prime grade premises
over the next 12 months. As tenants and owner occupiers move into new
premises, secondary grade rents are expected to soften slightly.
NZL Group have leased a high tech purpose-built facility comprising a 17,000 sqm
After experiencing record low yields in the second half of 2016, yields have
warehouse and new head office. The state of the art warehouse is to be developed
begun to soften by 25 to 50 basis points over the past 12 months. However, within the Tauriko Business Estate and expected to be completed mid-2018.
investor demand remains strong, in particular for prime properties, and
yields are expected to remain steady over the next 12 months.
Hamilton 7-11 Simsey Place
Hamilton’s industrial market continued to achieve steady growth over Te Rapa Park, Hamilton
the past year, resulting in available prime vacant space being absorbed
almost as soon as it became available. However more supply is expected
as Chalmers Properties develop several speculatively built premises’
at Te Rapa Gateway, showing the current growth in the market. Strong
tenant demand for prime existing stock is putting upward pressure on
prime net combined rents which reached $130/sqm for June 2017, over
6% higher than 12 months ago. A potential challenge for developers is
tenants' unwillingness to pay the premium for new builds if they can find a
comparable existing premises at a lower cost.
Average prime yields have firmed by over 100 basis points in the past 12
months. Investors with good quality assets have rarely sold, but when they
have, strong prices have been achieved. A steady flow of investor enquiry,
including from Auckland, has placed further pressure on available stock
In March 2017, Wrightsons leased 4,420 sqm from Erinic Investments Ltd at 7-11
to purchase. Non-location sensitive businesses from Auckland have also
Simsey Place. The building was leased immediately after Fonterra (the former tenant)
looked to relocate to a more affordable market. Yields are likely to soften vacated.
over the next 12 months, however there is no evidence in the market yet, as
transactions are continuing to reflect firm yields.
Dunedin 197 Fryatt Street
Dunedin
Demand continues to outweigh supply in the Dunedin industrial market
with a lack of prime stock currently available for either lease or purchase.
Tenants interested in relocating are overlooking available secondary space
and instead opting for design-builds or staying put until the right option
becomes available. Port Otago subsidiary Chalmers Properties completed
a design build for Steel & Tube in early 2017 allowing the consolidation
of two existing sites into one purpose built facility. New builds have
upped the ante for industrial prime rents in Dunedin, with existing stock
expected to play catch up over the next 12 months.
With a high portion of core existing stock being leasehold, any freehold
investments that come up for sale are highly sought after. Business Steel & Tube Holdings Limited have leased a 4,600 sqm design-build warehouse from
confidence has been on the rise, but restricted borrowing ability may Chalmers Properties in the Harbour Basin industrial area. This development enabled
Steel & Tube to consolidate two former sites into one new facility.
cause yields to soften over the next 12 months.
14Outlook
Over the next 12 months we expect to see a continuation of similar
conditions in the industrial market. A shortage of prime stock will
continue to cause upward pressure on rents, some of which will
flow into the take-up of secondary space and continue to fuel the
demand for newly built stock. Speculative builds which have been
completed this past year have been successfully leased.
The rental growth cycle may be nearing its peak in some markets.
However, increasing land values and construction costs will
moderate the amount of new industrial development over the short
to medium term. Until more supply arrives, vacancy is expected to
remain at low levels.
Major infrastructure projects currently underway will create new
efficiencies through improved journey times and connectivity, and
potentially a change to the relative merits of various precincts.
Despite positive investment conditions over the past 12 months,
sales levels have eased from that in 2016. This however, isn’t a
reflection of weakening demand from tenants, but of the limited
amount of properties available for sale. Yields aren’t expected to
go much further south over the next 12 months, and as access to
lending becomes harder, investors will become more selective
about their next move.
15For more information contact: Colliers International
Research and Consulting
Alan McMahon Chris Farhi offers a range of commercial
National Director | Director | Strategic Consulting and residential property
Research & Consulting solutions:
Caity Pask
Leo Lee Senior Analyst | Strategic Consulting • Property Investment Strategies
Research Manager
• Demand & Supply Studies
Elena Christodoulou Colliers International • Market Analysis & Forecasts
Research Analyst Level 27, SAP Tower
151 Queen St, • Feasibility Analysis
Emily Duncan Auckland • GIS Spatial Analysis
Research Analyst +64 9 358 1888 • Catchment Analysis
Josh Lee • Lease Audit & Benchmarking
Research Co-ordinator • Site Options Analysis
• Corporate Real Estate Strategy
• Financial Analysis
• Business Cases
2015 & 2016 RICS Award
Whilst all care has been taken to provide reasonably accurate information within this report, Colliers International cannot guarantee
the validity of all data and information utilised in preparing this research. Accordingly Colliers International New Zealand limited, do
not make any representation of warranty, expressed or implied, as to the accuracy or completeness of the content contained herein
and no legal liability is to be assumed or implied with respect thereto.
© All content is Copyright Colliers International New Zealand Limited 2017 and may not be reproduced without expressed permission.
Licensed REAA 2008
16You can also read